 Original Article


Affiliation:
Department of Food Science and Technology, The Federal University of Technology, Akure PMB 704, Nigeria
Email: taaderinola@futa.edu.ng
ORCID: https://orcid.org/0000-0003-1002-1588


 ,
,
Affiliation:
Department of Food Science and Technology, The Federal University of Technology, Akure PMB 704, Nigeria
Explor Foods Foodomics. 2026;4:1010153 DOI: https://doi.org/10.37349/eff.2026.1010153
Received: September 10, 2025 Accepted: April 21, 2026 Published: May 25, 2026
Academic Editor: Marcello Iriti, Milan State University, Italy
Aim: The study investigated the nutritional, functional, antioxidant, and enzyme inhibitory properties of tigernut-wheat composite flours.
Methods: Composite samples were prepared by substituting wheat flour with tigernut flour at 5–20%, while 100% wheat flour served as the control. Proximate, functional, antioxidant, and enzyme inhibitory analyses were carried out on the composite flours to determine the effects of tigernut substitution.
Results: Proximate analysis revealed that tigernut addition significantly increased fiber (1.08–3.22%), ash (0.83–3.20%), and fat (2.61–7.32%) contents. While the crude protein content decreased slightly at higher substitution (13.00–6.91%), the carbohydrate content did not follow any specific pattern. Functional properties such as water absorption (73.13–85.26%) improved with tigernut incorporation, while bulk density and foaming capacity also showed positive trends. Antioxidant indices demonstrated substantial enhancement: total phenolic content (2.20–8.87 mg GAE/g) and improved radical scavenging activities. In addition, α-glucosidase inhibition rose from 27.25% in the control to 64.86% in the highest blend, while α-amylase inhibition declined, indicating potential benefits for moderating postprandial glycemia.
Conclusions: Tigernut substitution enriched the mineral and phytochemical content of wheat flour and enhanced its functional and antioxidant properties. These findings suggest that tigernut-wheat composite flour could serve as a functional ingredient for bakery and snack formulations, offering improved nutritional quality and preliminary benefits related to glycemic modulation.
Composite flour is defined as a mixture of flours obtained from different food sources, including high-starch crops such as cassava, potato, tigernut, and yam as well as protein-rich crops such as soybean, Moringa seed, and common beans among others with or without wheat flour. These flours are created to satisfy specific functional characteristics and nutritional composition [1, 2]. Composite flour is a term introduced by the FAO (Food and Agriculture Organization of the United Nations) under the Composite Flour Programme, which focused on the baking industry. The FAO defined composite flour as a mixture that is available in the market, acceptable from the cultural point of view, economical and with no significant difference in nutrition and functionality when compared to wheat flour [3].
Wheat (Triticum aestivum L.) is one of the most important cereal grains, consumed globally and being responsible for a large share of the total nutrient and energy intake of humans. However, wheat flour is commonly subjected to extensive milling and, therefore, undergoes a reduction in nutrients and an increase in the glycemic index (GI) [4]. Tigernut (Cyperus esculentus), also known as earth almond or chufa, is a nutrient-dense tuber containing carbohydrates (60–70% of dry weight, mostly slowly digestible starches), fiber (12–20% insoluble, 2–5% soluble), protein (< 10%, rich in essential amino acids), and minerals such as potassium, magnesium, iron, zinc, and calcium [5]. These components contribute to its recognized health benefits, including antidiabetic, antioxidant, and antimicrobial effects. Its use in various food products and for therapeutic purposes is well documented [6–8]. Wheat-tigernut composite flour can be utilized for various baked products such as bread, cookies, muffins, and cakes. Research has indicated that composite flours with up to 20% tigernut flour substitution can produce bakery products that are not only acceptable but also have enhanced nutritional and functional properties [9–11].
Fresh tigernuts were sourced and purchased from Shasha Market, Akure, while wheat flour (Golden Penny brand) was purchased at Oja Oba Market, Akure, Ondo State.
Tigernut flour was produced using a previous method [12]. The first step was to sort the nuts to get rid of broken, rotten/fermented seeds, stones, and other extraneous materials. Thereafter, the tigernuts were thoroughly washed several times with clean water until all the dirt, debris or foreign particles were completely removed. The washed nuts were drained using a sieve to remove excess water, then dried in an oven (Plus11 Sanyo Gallenkamp PLC; UK) at 65°C for 24 h. The dried nuts were ground into flour using a laboratory hammer mill (Fritsch, D-55743; Idar-Oberstein, Germany), then sieved with a 250-μm mesh size, packaged, sealed, and stored in a plastic bag (Ziploc bag) at room temperature (25 ± 2°C) until use. Four different samples were then made by blending tigernut flour and wheat flour in ratios of 5:95, 10:90, 15:85, and 20:80, while 100% wheat was the control.
Approximately 13–16 mg of flour was weighed into 2 mL microcentrifuge tubes, and distilled water was added to obtain a final concentration of 10 mg/mL (i.e., 1.3–1.6 mL water for 13–16 mg sample, respectively). The mixture was vortexed for 1 min, allowed to hydrate for 10 min, vortexed again for 60 s, and centrifuged at 10,000 × g for 10 min (Model KX3400C; Kenxin Intl. Co.). The clear supernatant was collected and used for subsequent analyses. The extract was used for the antioxidant and enzyme inhibition assays. All antioxidant and enzyme inhibition assays were performed at a single concentration as obtained, and results are reported as percentage activity relative to the control.
The following functional properties were determined as recently reported [13].
Bulk density was determined by transferring 50 g of flour into a 100 mL graduated cylinder. The cylinder was gently tapped repeatedly until the volume became stable. The bulk density was calculated using the final settled volume as:
To determine water and oil absorption capacities (WAC and OAC), 1 g of flour was dispersed in 10 mL of distilled water or corn oil using a 15 mL centrifuge tube. The suspension was mixed for 1 min at room temperature and allowed to stand for 30 min to enable hydration. Thereafter, the tubes were centrifuged at 1,200 × g for 30 min. The supernatant was carefully decanted, and the tubes were inverted to remove any unbound water or oil. WAC and OAC were then calculated from the retained weight:
Suspensions of each composite flour blend (0.2–2% w/w) were prepared in distilled water and transferred into test tubes. The dispersions were heated in a boiling water bath for 1 h, then immediately cooled in cold water, followed by further cooling at 4°C for 2 h. The least gelation concentration was recorded as the lowest concentration at which the sample remained in place without flowing when the test tube was inverted.
The swelling capacity was determined according to a previously reported method [13]. In summary, 1 g of flour was dispersed in 10 mL of distilled water in a centrifuge tube and heated at 90°C for 30 min with occasional shaking to promote uniform suspension. The tubes were then centrifuged at 1,000 × g for 20 min, after which the supernatant was discarded. The weight of the resulting paste was measured, and swelling capacity was determined using the formula provided below
Two grams of flour were dispersed in 50 mL of distilled water in a 100 mL graduated cylinder. The suspension was vigorously shaken to produce foam, and the volume was recorded after 30 s. Foaming capacity was expressed as the percentage increase in volume relative to the initial suspension.
The cylinder was then left to stand undisturbed for 30 min, after which the foam volume was recorded. Foaming stability was expressed as the percentage change in foam volume relative to the initial value.
Two grams of flour were dispersed in 40 mL of distilled water and thoroughly mixed. While stirring continuously for 5 min, 10 mL of vegetable oil was gradually added. The mixture was then transferred into a graduated centrifuge tube, heated at 85°C for 15 min, and centrifuged until a constant oil layer was obtained. Emulsion capacity was expressed as the percentage of oil emulsified per gram of flour using the formula below:
The emulsion stability was calculated as the percentage of the emulsified layer that remained after 30 min using the same equation above for emulsion capacity.
Proximate compositions (moisture, protein, fat, ash and fiber) of the flour samples were determined using standard methods [14], while carbohydrate content was determined by difference.
The minerals were analyzed from a solution that was obtained by adding 0.1 N HNO3 to the ash residue, then the suspension was filtered using a Whatman filter paper. The filtrate containing Ca, Fe, Mg, Zn, Na and K was analyzed with an Atomic Absorption Spectrophotometer (AAS, Buck Scientific 210VGP; USA), while phosphorus was determined using the vanadomolybdate method based on the formation of a yellow phosphovanadomolybdate complex. The absorbance of the sample and standard solutions was measured using a spectrophotometer. The concentration of minerals in the samples was then determined using the standard curve plot of absorbance versus known concentrations of standard solutions (0, 0.5, 1, 2, 4, 5, 10, 20 and 40 ppm), and the results were expressed by the following formula:
The total phenolic content (TPC) was estimated utilizing the Folin-Ciocalteu method [15] with gallic acid as the reference compound. A volume of 50 μL of the diluted sample solution was taken into a test tube and mixed with 50 μL of water, followed by 500 μL of Folin-Ciocalteu reagent. The combination was subjected to vortex mixing and after 3 min, 400 μL of sodium carbonate (7.5%) was added to the mixture. The tubes were kept in a water bath at 45°C for 40 min, and then the absorbance was measured at 765 nm with a blank as reference. Gallic acid standard of 0.1 mg/mL was processed in the same way to create the standard curve. The blank treatment was 100 μL of distilled water, 500 μL of Folin-Ciocalteu reagent, and 400 μL of sodium carbonate solution. The TPC was then expressed in terms of gallic acid equivalent per gram of sample (mg GAE/g sample) by means of the calibration curve of gallic acid.
Total flavonoid content was evaluated through the aluminum chloride colorimetric assay [16] with slight modification. The number of flavonoids was determined by mixing 500 μL of aqueous extract with 500 μL of methanol in a 10 mL flask. To this mixture, 50 μL of 10% aluminum chloride (AlCl3) and 50 μL of 1 M potassium acetate were added sequentially. The volume was then adjusted to 2.5 mL with distilled water, and the solution incubated at room temperature for 30 min. Absorbance was recorded at 415 nm with a spectrophotometer (JENWAY 6305; United Kingdom). The total flavonoid concentration was determined using quercetin as the standard reference for the assay.
The samples’ capability to scavenge 2,2-diphenyl-1-picrylhydrazyl (DPPH) free radical was measured by the method of Agunbiade et al. [17] with slight modifications. In brief, 1 mL of the extract was mixed with 1 mL of DPPH solution in methanol at a concentration of 0.4 mM. The mixture was left in the dark for the next 30 min, after which the absorbance was read at 517 nm. Methanol was used for the control. The percentage of radical scavenging activity was then calculated using the following formula:
The ability of the sample to eliminate hydroxyl radical was measured with the use of a previous method [18]. The sample extract was added to the reaction mixture containing 400 μL of 0.1 M phosphate buffer (pH 7.4), 120 μL of 20 mM deoxyribose, 40 μL of 20 mM hydrogen peroxide, and 40 μL of 500 μM FeSO4. The volume was made up to 800 μL with distilled water and incubated at 37°C for 30 min. The addition of 0.5 mL of 2.8% trichloroacetic acid followed by 0.4 mL of 0.6% thiobarbituric acid solution was used to stop the reaction. Then, the tubes were heated in a boiling water bath for 20 min and absorbance at 532 nm was measured. Using the following equation, the hydroxyl radical scavenging activity was computed as:
The extract’s ability to scavenge 2,2'-azino-bis (3-ethylbenzothiazoline-6-sulfonic acid) (ABTS) radicals was determined based on the method of Agunbiade et al. [17]. The ABTS radical cation was produced by mixing a 7 mM ABTS solution with a 2.45 mM potassium persulfate (K2S2O8) solution and allowing the reaction to proceed in the dark for 12–16 h. The obtained solution was diluted with ethanol until its absorbance at 734 nm reached the value of 0.70 ± 0.02. For the assay, 100 μL of the extract was mixed with 100 μL of distilled water and 1.8 mL of ABTS working solution. The mixture was kept in the dark for 15 min, then absorbance was measured at 734 nm. The percentage of the scavenging activity was calculated using the equation below:
The ferric reducing antioxidant power (FRAP) of the samples was determined by utilizing a modification of a previously described method [19]. The sample was dissolved in a 0.2 M phosphate buffer which was maintained at pH 6.6. An aliquot of 250 μL was taken, and it was mixed with 250 μL of the buffer and 250 μL of 1% potassium ferricyanide solution. Thorough mixing of the mixture was done with a vortex machine followed by heating at 50°C for 20 min. During the incubation period, 250 μL of 10% trichloroacetic acid was added along with 50 μL of 0.1% ferric chloride that had been dissolved in double distilled water and then followed by 200 μL of distilled water. The solution was allowed to stand for 10 min at room temperature after which it was centrifuged at 1,000 × g for 10 min. An aliquot (200 μL) of the supernatant was taken and put in a clear bottom 96-well plate and the absorbance was measured at a wavelength of 700 nm.
The α-amylase inhibitory potential of the extract was evaluated based on a previous study [20] with slight modifications. Equal volumes (100 μL each) of the sample or control (distilled water) and the enzyme solution (prepared in 0.02 M phosphate buffer, pH 6.9, containing 0.006 M NaCl) were mixed and subjected to incubation at 28°C for 10 min. Afterward, 200 μL of 1% starch solution (prepared in the same buffer) was added and the mixture was incubated for another 10 min at room temperature. The termination of the reaction was done by adding 1 mL of dinitrosalicylic acid reagent, followed by 5 min heating in a boiling water bath. After cooling, the mixture was diluted with distilled water at a ratio of 1:5 (v/v) and the absorbance was read at 540 nm. The percentage inhibition of α-amylase activity was calculated using the equation provided below:
The effect of the plant extracts on α-glucosidase activity was determined using a previously described method [20] with slight modifications. The substrate, p-nitrophenyl-α-D-glucopyranoside (pNPG), was prepared in 20 mM phosphate buffer (pH 6.9). An aliquot of 50 μL of α-glucosidase solution (0.3 U/mL) was pre-incubated with 100 μL of the sample for 10 min. The reaction was initiated by adding 100 μL of 3.0 mM pNPG, and the mixture was incubated at 37°C for 20 min. The reaction was terminated with 2 mL of 0.1 M Na2CO3, and absorbance was measured at 405 nm. The percentage inhibition of α-glucosidase activity was determined using the same formula applied for α-amylase inhibition.
All chemical analyses were performed in triplicate (technical replicates, n = 3), and results are expressed as mean values ± standard deviation (SD). Data were subjected to analysis of variance (ANOVA), and differences between means were separated using the least significant difference (LSD) test at a significance level of p < 0.05. Statistical analyses were carried out using SPSS software (version 21).
The results of the functional properties of the flour blends are presented in Table 1. Bulk density ranged from 0.73 g/mL in the control (100% wheat flour) to 0.85 g/mL in the 20% tigernut blend. WAC increased with tigernut addition, from 73.13% in wheat flour to 85.26% in the 20% blend. Similarly, OAC rose from 48.36% to 54.80%. The least gelation concentration decreased from 0.80% in wheat flour to 0.20% in blends containing ≥ 15% tigernut. The swelling index showed a modest increase from 4.30 to 5.10. Foaming capacity and stability improved with tigernut addition, ranging from 25.76% to 31.96% and 68.20% to 75.90%, respectively. Likewise, emulsion capacity and stability rose from 42.66% to 48.96% and 76.40% to 83.10%, respectively.
Functional properties of tigernut-wheat composite flour.
| Samples | A | B | C | D | E |
|---|---|---|---|---|---|
| Bulk density (g/mL) | 0.73 ± 0.01e | 0.76 ± 0.01d | 0.79 ± 0.01c | 0.82 ± 0.01b | 0.85 ± 0.01a |
| Water absorption capacity (%) | 73.13 ± 0.60e | 75.83 ± 0.60d | 78.40 ± 0.40c | 82.06 ± 0.65b | 85.26 ± 0.65a |
| Oil absorption capacity (%) | 48.36 ± 0.55e | 49.93 ± 0.60d | 50.30 ± 0.20c | 52.40 ± 0.60b | 54.80 ± 0.60a |
| Least gelation concentration (%) | 0.80 ± 0.00a | 0.60 ± 0.00b | 0.40 ± 0.00c | 0.20 ± 0.00d | 0.20 ± 0.00d |
| Swelling capacity | 4.30 ± 0.10c | 4.50 ± 0.10bc | 4.86 ± 0.55bc | 4.90 ± 0.10b | 5.10 ± 0.10a |
| Foaming capacity (%) | 25.76 ± 0.55e | 27.36 ± 0.55d | 29.90 ± 0.70c | 30.46 ± 0.55b | 31.96 ± 0.11a |
| Foaming stability (%) after 30 min | 68.20 ± 0.70d | 69.90 ± 0.70bc | 70.86 ± 0.55bc | 73.90 ± 0.70b | 75.90 ± 0.70a |
| Emulsion capacity (%) | 42.66 ± 0.55e | 44.26 ± 0.55d | 45.80 ± 0.60c | 47.46 ± 0.55b | 48.96 ± 0.55a |
| Emulsion stability (%) after 30 min | 76.40 ± 0.60c | 78.10 ± 0.60b | 79.23 ± 0.25b | 81.80 ± 0.60a | 83.10 ± 0.60a |
Values are mean of triplicate determination ± standard deviation. Values with different superscript in the same row are significantly different (p < 0.05). A: control (100% wheat flour); B: 95% wheat flour, 5% tigernut flour; C: 90% wheat flour, 10% tigernut flour; D: 85% wheat flour, 15% tigernut flour; E: 80% wheat flour, 20% tigernut flour.
The proximate composition of the wheat-tigernut composite flours is presented in Table 2. Moisture content ranged from 12.59% in the control (100% wheat flour) to 6.84% in the 20% tigernut blend. Fat content was significantly higher with tigernut inclusion, from 2.61% in wheat flour to 7.32% in the 20% tigernut blend. Crude fiber content ranged from 1.08% in the control to 3.22% in the 20% tigernut blend, with significant increases at higher substitution levels. Ash content increased from 0.83% in wheat flour to 3.20% in the 20% tigernut blend. Protein content decreased with tigernut substitution, from 13.00% in wheat flour to 6.91% in the 20% tigernut blend. Carbohydrate content ranged between 72.51 and 69.89, though these changes did not follow any specific trend.
Proximate composition of tigernut wheat composite flour (%).
| Sample | Moisture | Fat | Fibre | Ash | Protein | Carbohydrate |
|---|---|---|---|---|---|---|
| A | 12.59 ± 0.14a | 2.61 ± 0.00c | 1.08 ± 0.14d | 0.83 ± 0.09d | 13.00 ± 0.04a | 69.89 ± 0.22b |
| B | 9.87 ± 0.12b | 2.65 ± 0.03c | 1.18 ± 0.05c | 1.33 ± 0.02c | 12.89 ± 0.02a | 72.08 ± 0.14a |
| C | 9.45 ± 0.08bc | 4.46 ± 0.00b | 2.22 ± 0.00b | 2.15 ± 0.15b | 11.75 ± 0.04b | 69.97 ± 0.18b |
| D | 8.77 ± 0.07c | 7.22 ± 0.11a | 2.35 ± 0.02b | 2.06 ± 0.16b | 9.69 ± 0.04c | 69.91 ± 0.21b |
| E | 6.84 ± 0.71d | 7.32 ± 0.03a | 3.22 ± 0.10a | 3.20 ± 0.01a | 6.91 ± 0.05d | 72.51 ± 0.72a |
Values are mean of triplicate determination ± standard deviation. Values with different superscript in the same column are significantly different (p < 0.05). A: control (100% wheat flour); B: 95% wheat flour, 5% tigernut flour; C: 90% wheat flour, 10% tigernut flour; D: 85% wheat flour, 15% tigernut flour; E: 80% wheat flour, 20% tigernut flour.
The mineral composition of wheat-tigernut composite flours (Table 3) showed significant enhancement with increasing levels of tigernut substitution. Calcium content increased from 47.53 mg/100 g in 100% wheat flour to 61.76 mg/100 g in the 20% tigernut blend. Sodium values ranged from 191.40 to 206.73 mg/100 g, with tigernut blends showing significantly higher levels (p < 0.05). Potassium levels ranged between 383.93 and 409.93 mg/100 g, with tigernut-containing flours consistently showing higher concentrations. Phosphorus content increased from 367.50 to 392.43 mg/100 g as tigernut substitution rose. Magnesium increased from 123.60 to 134.53 mg/100 g with tigernut addition. Iron content rose from 2.10 to 2.46 mg/100 g across the blends, while zinc increased from 2.27 to 2.71 mg/100 g with tigernut substitution.
Mineral composition of tigernut-wheat composite flour (mg/100 g).
| Sample | Ca | Na | P | K | Mg | Fe | Zn |
|---|---|---|---|---|---|---|---|
| A | 47.53 ± 0.65e | 191.40 ± 1.93d | 367.50 ± 1.87e | 383.93 ± 1.25e | 123.60 ± 0.70e | 2.10 ± 0.02e | 2.27 ± 0.02e |
| B | 50.10 ± 0.40d | 195.46 ± 1.25c | 374.13 ± 1.25d | 390.46 ± 1.25d | 126.06 ± 0.75d | 2.19 ± 0.02d | 2.40 ± 0.02d |
| C | 54.13 ± 0.35c | 199.90 ± 1.27b | 380.60 ± 0.79c | 397.46 ± 0.75c | 128.53 ± 0.75c | 2.28 ± 0.02c | 2.51 ± 0.02c |
| D | 58.36 ± 0.25b | 200.33 ± 0.20b | 385.93 ± 0.75b | 402.93 ± 0.75b | 131.53 ± 0.75b | 2.37 ± 0.02b | 2.61 ± 0.02b |
| E | 61.76 ± 0.35a | 206.73 ± 1.25a | 392.43 ± 0.75a | 409.93 ± 0.75a | 134.53 ± 0.75a | 2.46 ± 0.02a | 2.71 ± 0.02a |
Values are mean of triplicate determination ± standard deviation. Values with different superscript in the same column are significantly different (p < 0.05). A: control (100% wheat flour); B: 95% wheat flour, 5% tigernut flour; C: 90% wheat flour, 10% tigernut flour; D: 85% wheat flour, 15% tigernut flour; E: 80% wheat flour, 20% tigernut flour.
The TPC (Figure 1A) of the composite flours increased significantly (p < 0.05), from 2.20 mg GAE/g in the control (100% wheat flour) to 8.87 mg GAE/g in the 20% tigernut blend. Similarly, total flavonoid content (Figure 1B) rose from 1.22 mg QE/g in the control to 1.88 mg QE/g in the highest tigernut blend.
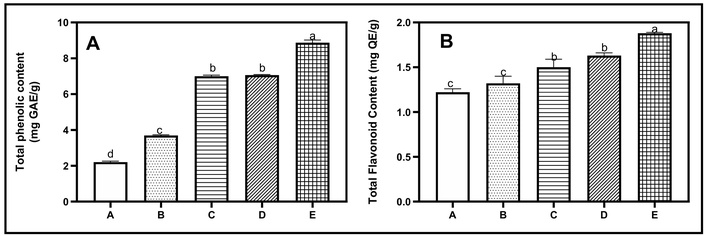
Total phenolic (A) and total flavonoid (B) contents of the composite flour. Bars with different alphabets are significantly different (p < 0.05). A: control (100% wheat flour); B: 95% wheat flour, 5% tigernut flour; C: 90% wheat flour, 10% tigernut flour; D: 85% wheat flour, 15% tigernut flour; E: 80% wheat flour, 20% tigernut flour.
Antioxidant capacity was assessed using ABTS, DPPH, FRAP, and hydroxyl radical (OH) assays (Figure 2A–2D). The marked improvement in ABTS scavenging activity reflects the contribution of tigernut-derived phenolic compounds. DPPH radical scavenging activity also increased markedly, from 18.23% in the control to 47.27% in the highest substitution level. FRAP values, which measure reducing power, increased from 3.34 mg/g in the control to 4.59 mg/g in the 20% tigernut flour. Hydroxyl radical scavenging (OH, Figure 2D) followed the same pattern, increasing from 15.66% in the control to 46.78% in the highest tigernut blend.
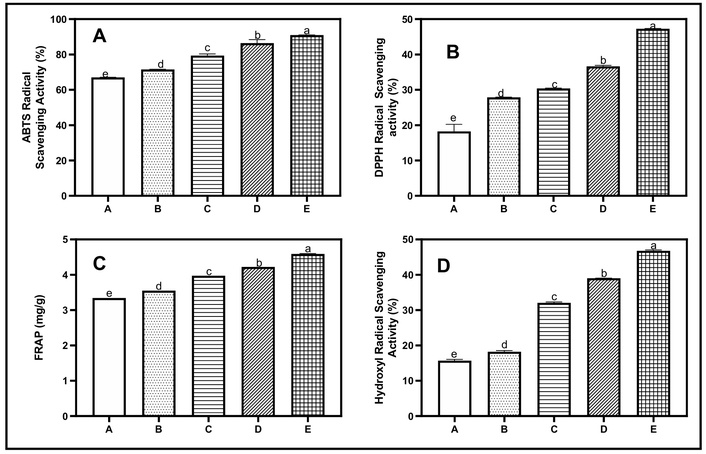
Antioxidant potential of the composite flour measured through ABTS (A), DPPH (B), ferric reducing antioxidant power (C) and hydroxyl radical scavenging ability (D). Bars with different alphabets are significantly different (p < 0.05). A: control (100% wheat flour); B: 95% wheat flour, 5% tigernut flour; C: 90% wheat flour, 10% tigernut flour; D: 85% wheat flour, 15% tigernut flour; E: 80% wheat flour, 20% tigernut flour.
The enzyme inhibitory activities of α-amylase (Figure 3A) and α-glucosidase (Figure 3B) revealed contrasting trends with tigernut substitution. α-Amylase inhibition decreased significantly, from 73.43% in the control to 14.15% in the 20% tigernut blend. Conversely, α-glucosidase inhibition rose from 27.25% in the control to 64.86% at the highest level of tigernut substitution.
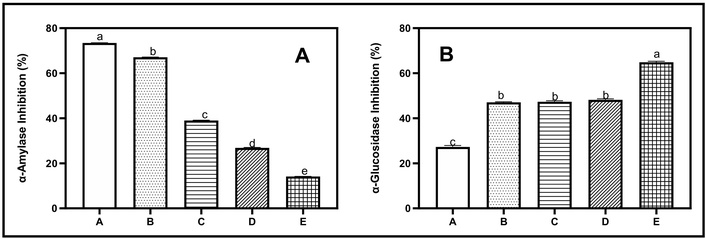
Inhibition of α-amylase (A) and α-glucosidase (B) by the composite flour. Bars with different alphabets are significantly different (p < 0.05). A: control (100% wheat flour); B: 95% wheat flour, 5% tigernut flour; C: 90% wheat flour, 10% tigernut flour; D: 85% wheat flour, 15% tigernut flour; E: 80% wheat flour, 20% tigernut flour.
The increase in bulk density with tigernut inclusion suggests improved packing efficiency and reduced porosity in the composite flours, which is beneficial for handling and storage. This agrees with findings by Ade-Omowaye et al. [12] and Özcan [21], who reported improved bulk density in wheat-tigernut blends, reflecting the denser particle structure of tigernut flour. The significant increase in WAC with tigernut addition is beneficial for bakery products, supporting dough quality and product texture. The higher WAC can be attributed to the hydrophilic nature of tigernut fiber and carbohydrates, which provide more binding sites for water [5]. Similarly, the rise in OAC reflects the higher lipid content of tigernut. Since oil absorption influences flavor retention, palatability, and mouthfeel, the higher OAC indicates better potential for use in cakes and cookies. Ahemen et al. [9] observed comparable improvements in OAC when tigernut was blended with wheat for bread production.
The decrease in least gelation concentration with higher tigernut substitution indicates enhanced gel-forming ability, important in products that require thickening or structural binding. This likely results from starch–protein interactions, consistent with prior reports [12]. The modest increase in swelling index suggests that tigernut starch granules possess high swelling potential, beneficial for dough viscosity and crumb texture.
Foaming capacity and stability are relevant in aerated products like cakes, where they contribute to lightness and structure. The observed increase implies that tigernut proteins possess surface-active properties that promote foam formation and stabilization, consistent with prior observations [17]. Similarly, the increases in emulsion capacity and stability are desirable in fat-rich products such as biscuits and cakes, where emulsions improve texture, uniformity, and shelf stability. The improved emulsifying behavior is attributable to tigernut proteins and lipids, which enhance fat–water interactions, consistent with the findings of Ade-Omowaye et al. [12] and Yu et al. [5].
Overall, tigernut inclusion positively influenced almost all functional properties of wheat flour, producing blends with higher water and oil binding, foaming, swelling, and emulsifying potential, while lowering gelation concentration. These improvements are linked to the high lipid, fiber, and protein contents of tigernut [11, 22].
Moisture content is a critical factor affecting flour stability and shelf life, as higher values encourage microbial growth and enzymatic activity that may lead to spoilage [2]. The observed decrease in moisture with increasing tigernut substitution indicates that tigernut flour has lower inherent moisture than wheat, which may improve the shelf life. Similar reductions in moisture content with composite flour substitution have been reported in tigernut-wheat bread and cookies [12, 21]. Fat content increased substantially with tigernut inclusion, reflecting the naturally high oil content of tigernut tubers, which are rich in healthy unsaturated fatty acids [5]. This increase enhances energy density, essential fatty acids, and baking performance [5, 9]. A similar trend of increased lipid content with tigernut addition was observed in wheat–tigernut–sesame composite breads [9]. However, the higher fat may also predispose the flour to rancidity if not properly stored.
Tigernut is known to be a good source of dietary fiber [5, 23], and the increase in fiber enhances the health-promoting value of the composite flour, potentially improving gut health, lowering cholesterol, and reducing glycemic response [24]. The fiber enrichment observed here supports the potential of tigernut-wheat blends as functional ingredients for diabetic-friendly and weight management foods. Similar increases in fiber have been reported in tigernut composite cookies and bread [12, 21]. Ash content, which reflects the mineral composition, increased with tigernut substitution, demonstrating that tigernut contributes appreciable minerals such as calcium, potassium, magnesium, and phosphorus, as earlier highlighted in tigernut compositional studies [5]. This indicates improved micronutrient density of the blends.
Protein content, however, decreased with tigernut substitution. This reduction is expected since wheat is richer in gluten-forming proteins compared to tigernut, which contains more starch and fat but less protein [12]. The reduction may affect dough structure but aligns with low-protein diet considerations. Studies by Ade-Omowaye et al. [12] and Özcan [21] similarly reported decreased protein content when wheat was partially substituted with tigernut. The carbohydrate content fluctuated between 72.51% and 69.89% and did not follow a specific trend with increasing tigernut substitution. This lack of a linear pattern likely stems from the displacement effect caused by the simultaneous increases in fat and fiber levels. Despite these variations, the carbohydrate content remained high across all blends, ensuring the flour remains a concentrated energy source. Similar values in carbohydrate levels following tigernut incorporation have been reported in previous studies on composite breads and biscuits [9, 21].
The observed enhancement in mineral composition reflects the nutrient density of tigernut, which has been reported as a rich source of calcium, potassium, magnesium, phosphorus, and iron [5]. Incorporating tigernut into wheat flour, therefore not only alters functional properties but also improves the micronutrient composition of the blends, making the flour nutritionally superior. Tigernut substitution significantly enhanced the mineral composition of wheat flour, increasing calcium, potassium, magnesium, phosphorus, iron, and zinc [12]. These minerals contribute to bone health, enzymatic activity, and overall nutritional quality, highlighting the potential of the composite flours to address micronutrient deficiencies [5].
Potassium levels were consistently higher in tigernut-containing flours. Potassium is important for fluid balance, nerve function, and blood pressure regulation, counteracting the effects of sodium. The observed increase is a positive nutritional development, indicating a favorable sodium–potassium ratio in the blends. This aligns with findings from wheat–chufa bread formulations where potassium enrichment was also observed [21]. Phosphorus increase with tigernut substitution reflects tigernut’s inherent mineral composition [5]. Phosphorus is essential for skeletal mineralization and energy metabolism through ATP. The higher phosphorus values enhance the nutritional quality of the blends, particularly important in cereal-based diets that are often low in bioavailable phosphorus due to phytates. Magnesium enrichment is also notable, as magnesium acts as a cofactor in many enzymatic reactions, including those involved in glucose metabolism and protein synthesis. Adequate magnesium intake has been linked to reduced risk of diabetes and cardiovascular disease. The enrichment observed in tigernut blends is consistent with reports on tigernut composite breads [12].
The increase in iron content is critical since iron is required for hemoglobin synthesis and oxygen transport, and its deficiency remains one of the most widespread nutritional problems. The observed increase could help address iron-deficiency anemia, especially in wheat-consuming populations. Similar improvements in iron levels have been documented in wheat–tigernut–sesame composite products [5, 9]. Zinc levels also increased with tigernut substitution. Zinc is essential for immune function, growth, and enzymatic activities. The increase is nutritionally advantageous, as zinc deficiency is common in cereal-based diets. This finding aligns with reports that tigernut incorporation enhances zinc content in composite flours [21].
The marked increase in TPC demonstrates the high phenolic concentration of tigernut, which contains compounds such as gallic acid, caffeic acid, and p-coumaric acid with strong antioxidant and enzyme inhibitory activities [5, 25]. Since phenolic compounds act as primary antioxidants, their enrichment in the composite flour indicates an improved functional potential. Flavonoids are multifunctional bioactives that, in addition to their antioxidant activity, provide protection against allergies, inflammation, microbial infections, and tumor formation [7]. The steady increase with tigernut addition, therefore, highlights the nutraceutical potential of the composite flours. These findings are consistent with earlier reports of tigernut-based products showing higher levels of both phenols and flavonoids compared to wheat alone [7, 26, 27].
The higher ABTS activity of the composite flours can be attributed to their increased phenolic and flavonoid content, confirming tigernut’s role in enhancing antioxidant potential [7, 25]. The enhanced DPPH values further demonstrated tigernut’s contribution to hydrogen-donating ability and radical neutralization. Similar improvements in DPPH scavenging activity with tigernut incorporation have been reported in fortified beverages and bakery products [7]. The increase in FRAP values confirms that tigernut enriched the electron-donating capacity of the blends, thereby strengthening their antioxidant potential. These results are in agreement with previous findings, where tigernut substitution elevated FRAP values in composite food products [28, 29]. Hydroxyl radical scavenging ability (OH) also improved substantially. Hydroxyl radicals are among the most reactive oxygen species, and the ability of tigernut blends to quench them demonstrates their potential in preventing oxidative damage to biomolecules. Antioxidants with strong hydroxyl scavenging activity are particularly important in protecting against lipid peroxidation and chronic disease risk [30].
The reduction in α-amylase inhibition observed with increasing tigernut substitution (Figure 3A) may reflect differences in the intrinsic enzyme inhibitory properties of the composite flour compared with wheat flour. In contrast, α-glucosidase inhibition increased with increasing tigernut content (Figure 3B). The observed decline in α-amylase inhibition alongside a significant increase in α-glucosidase inhibition may offer a balanced approach to glycemic control. While α-glucosidase is the final enzyme in carbohydrate digestion, excessive inhibition of α-amylase can lead to the accumulation of undigested starch in the large intestine, often resulting in gastrointestinal discomfort such as abdominal distension [31–33]. Therefore, a formulation that exhibits potent α-glucosidase inhibition with moderate α-amylase activity is often considered a desirable profile for functional foods aimed at managing postprandial hyperglycemia [31, 33]. This trend may be associated with the presence of phenolic compounds in tigernut, which have previously been reported to exhibit glucosidase inhibitory activity [25]. Tigernut extracts have also been reported to exhibit various inhibitory properties in-vitro [7, 25, 27]. However, as no dose–response evaluation or reference inhibitor such as Acarbose was included in the assay, the magnitude of inhibition relative to established standards cannot be established. Consequently, the present results are preliminary and indicative of relative inhibitory potential among the flour formulations, rather than definitive evidence of antidiabetic potential. Further studies incorporating dose–response analysis and standard inhibitor controls would be necessary to better characterize the enzyme inhibitory capacity of these composite flours.
Tigernut incorporation successfully enhanced the crude fiber and essential mineral content, although a reduction in protein was observed at higher substitution levels. Notably, the composite flours exhibited enhanced α-glucosidase inhibitory activity in-vitro, suggesting a potential for glycemic modulation. While these findings indicate promising functional attributes for specialized bakery and snack formulations, they remain preliminary. Further studies, including in-vivo trials, are required to confirm the physiological relevance and clinical efficacy of these composite flours in managing postprandial hyperglycemia.
ABTS: 2,2'-azino-bis (3-ethylbenzothiazoline-6-sulfonic acid)
DPPH: 2,2-diphenyl-1-picrylhydrazyl
FAO: Food and Agriculture Organization of the United Nations
FRAP: ferric reducing antioxidant power
OAC: oil absorption capacities
pNPG: p-nitrophenyl-α-D-glucopyranoside
TPC: total phenolic content
WAC: water absorption capacities
TAA: Conceptualization, Methodology, Project administration, Supervision, Writing—review & editing. PAO: Formal analysis, Methodology, Writing—original draft. The authors read and approved the submitted version.
The authors declare that there are no conflicts of interest.
Not applicable.
Not applicable.
Not applicable.
The raw data supporting the conclusions of this manuscript will be made available by the authors, without undue reservation, to any qualified researcher.
No funding was received for this study.
© The Author(s) 2026.
Open Exploration maintains a neutral stance on jurisdictional claims in published institutional affiliations and maps. All opinions expressed in this article are the personal views of the author(s) and do not represent the stance of the editorial team or the publisher.
Copyright: © The Author(s) 2026. This is an Open Access article licensed under a Creative Commons Attribution 4.0 International License (https://creativecommons.org/licenses/by/4.0/), which permits unrestricted use, sharing, adaptation, distribution and reproduction in any medium or format, for any purpose, even commercially, as long as you give appropriate credit to the original author(s) and the source, provide a link to the Creative Commons license, and indicate if changes were made.



View: 1341
Download: 40
Times Cited: 0


