 Original Article

Affiliation:
1CIDCA, CONICET-CICPBA, Facultad de Ciencias Exactas, Universidad Nacional de La Plata, La Plata 1900, Argentina
2Facultad de Ciencias Agrarias y Forestales, Universidad Nacional de La Plata, La Plata 1900, Argentina
ORCID: https://orcid.org/0000-0001-9288-1017
Affiliation:
1CIDCA, CONICET-CICPBA, Facultad de Ciencias Exactas, Universidad Nacional de La Plata, La Plata 1900, Argentina
ORCID: https://orcid.org/0000-0001-8819-0133
Affiliation:
1CIDCA, CONICET-CICPBA, Facultad de Ciencias Exactas, Universidad Nacional de La Plata, La Plata 1900, Argentina
Email: marielapatrignani@biol.unlp.edu.ar
ORCID: https://orcid.org/0000-0001-5280-7779
Explor Foods Foodomics. 2026;4:1010145 DOI: https://doi.org/10.37349/eff.2026.1010145
Received: January 29, 2026 Accepted: April 21, 2026 Published: May 14, 2026
Academic Editor: Ryszard Amarowicz, Institute of Animal Reproduction and Food Research of the Polish Academy of Sciences, Poland
Aim: This study aimed to evaluate the effect of incorporating aqueous extracts from Aloysia citrodora (lemon verbena) leaves and Pelargonium × hortorum (geranium) red flowers into semi-sweet biscuits in order to enhance antioxidant capacity and support the development of functional bakery products.
Methods: Aqueous extracts were incorporated into a standard biscuit formulation at two inclusion levels (10% and 30%). Dough and baked biscuits were analyzed for texture, colour, total phenolic content, and antioxidant capacity. The influence of extract type, concentration, and baking temperature (130°C and 160°C) on technological properties and bioactivity was assessed.
Results: The low pH of the geranium extract (pH < 4) resulted in significantly softer dough textures (P < 0.05). Biscuit fracture stress did not differ among formulations (P > 0.05), indicating no adverse effects on structural integrity. Baking at 160°C produced crisper biscuits, particularly in control samples and those containing 30% lemon verbena, as indicated by higher Young’s modulus and lower fracture strain values. Antioxidant capacity was strongly dependent on extract type and concentration. Biscuits and doughs containing 30% geranium extract exhibited the highest antioxidant values (P < 0.05), while samples with 10% lemon verbena extract did not differ significantly from controls.
Conclusions: Pelargonium × hortorum red flower extract demonstrated strong potential as a natural antioxidant ingredient in bakery products, enabling the production of functional biscuits without compromising technological quality and supporting strategies aimed at reducing oxidative stress.
In recent years, there has been a marked increase in the development of new foods that are organoleptically appealing and offer health benefits to consumers. Many chronic diseases are associated with an imbalance in oxidative stress [1–3]. Besides, the incorporation of antioxidants into mass-market products such as biscuits could be an interesting alternative to increase their intake and protect against cell damage caused by exposure to free radicals. Biscuits are ready-to-eat foods that are widely accepted across all age groups. Also, biscuits have a long shelf life due to their low moisture content [4].
Plants contain bioactive compounds, including phenolics, which are the main contributors to their antioxidant activity (AA). The main use of antioxidants in foods is the prevention of the off-flavours due to lipid oxidation [5]. Moreover, the addition of a wide variety of plant materials in biscuits in order to make them healthier has been explored [4]. Rosemary, thyme, cloves, cinnamon, and oregano are examples of natural aromatic plants and spices that have been used in bakery products because they provide some essential nutrients and give excellent flavour and aroma [6]. Among the millions of known plant species worldwide, only a small number of them are widely used as food sources, while more than a hundred wild edible plant species remain neglected [7]. Some edible leaves and flowers have been used as part of a meal or in infusions such as tea [8, 9].
Different parts of plants can be used to extract antioxidants, and their antioxidant power depends on both the quality of the original source and the technologies used to extract them [10]. Traditional extraction methods include maceration, percolation, and the Soxhlet method with different solvents [11, 12], while other authors reported the use of infusion as an extraction method [9, 13].
In a previous study, the total phenolic content (TPC) of 0.5% aqueous extracts, prepared from dried and ground samples of flowers and leaves collected in green places of La Plata, was analyzed [14]. Their values ranged from 6 to 50 mg gallic acid equivalents (GAE)/g for flower extracts, and from 1.8 to 15.9 mg GAE/g for leaf extracts.
Pelargonium is one of the seven genera of the Geraniaceae family, and includes almost 280 species [15]. Pelargonium × hortorum is the geranium species most widely cultivated. It is a perennial herbaceous plant with flowers almost year-round [16].
Hibiscus rosasinensis Linn (Malvaceae) is an ornamental and popular medicinal plant native to China, but is widely disseminated in tropical and sub-tropical regions. The bioactive attributes of extracts from Hibiscus rosa-sinensis are numerous [17]. Callistemon citrinus is an evergreen shrub originating from Australia. It is widely cultivated as an ornamental garden plant. Its lemon-scented flower spikes are present almost all year round on the plant, but mainly in November and December in the southern hemisphere [18].
Among the analyzed leaf extracts, the highest values were recorded in Aloysia citrodora (lemon verbena) and Bauhinia forficata (cow’s foot) extracts; both extracts showed values of 15 mg GAE/g dry sample with no significant difference between them, but higher than the other leaf extracts. The genus Bauhinia (Leguminosae) has been used in traditional medicines around the world. Seven species have been recorded as having pharmacological properties, with the most widely consumed and studied being B. forficata [19]. The most widely consumed and studied of these is B. forficata. Native to South America, B. forficata contains high levels of phenolic compounds. These are especially found in its leaves. The main compound is kaempferitrin [20]. Aloysia citrodora is a well-known aromatic species that is rich in antioxidant compounds, which originated in South America but, nowadays, grows across a wide geographical area [21]. Lemon verbena leaves have been included in the Argentine Pharmacopoeia as an herbal medicine since the 5th edition (1966), and in the European Pharmacopoeia since the 6th edition (2008) [22]. The main component of the non-volatile fraction is verbascoside, which is responsible for its various bioactivities [22].
In the present work, red geranium flower and lemon verbena leaf extracts were selected to be incorporated into a biscuit formulation, considering that these plants are more readily available throughout the year.
Therefore, the aim of this work was to evaluate the texture, colour, and antioxidant capacity of biscuits made with red geranium flower and lemon verbena leaf extracts. In this context, the study focused on assessing the feasibility of incorporating these extracts into a bakery model system and their contribution to antioxidant-related parameters [TPC and ferric reducing antioxidant power (FRAP)]. These results may serve as a starting point for future studies evaluating potential physiological effects associated with functional foods.
Red geranium flowers and lemon verbena leaves were hand-harvested in March 2023, in parks and green spaces of La Plata, Argentina. Samples were washed with chlorinated water, rinsed with tap water, and dried in an oven at 60°C before analysis. Dried samples of red geranium flowers and leaves of lemon verbena were ground (< 500 μm). Aqueous bioactive components were extracted with warm filtered water (chlorine off purifier, Hidrolit, Argentina) by stirring for 10 min at 600 revolutions per minute (rpm) and 45°C (Dragon Laboratory HCM100-Pro, Beijing, China). Then, after 15 min of resting time at room temperature, samples were centrifuged at 3,500 × g for 10 min (Giumelli Z-127-D Centrifuge, Argentina). The pH of centrifuged extracts was measured (HI 1330B, Hanna Instruments, Woonsocket, RI, USA). The Brix degrees were also determined (HI 96801 Refractometer, Hanna Instruments, Woonsocket, RI, USA).
The colour of both extracts was measured at three points using a colourimeter (model CR-400, Konica Minolta, Osaka, Japan) with standard illuminant D65 and a visual angle of 2°, calibrated using a white standard porcelain plate (L*: 96.96; a*: 0.37; b*: 2.10). Colour parameters L* (lightness), a* (greenness/redness), and b* (blueness/yellowness) were determined in the CIE (Commission Internationale de l’Éclairage) L*a*b* colour space.
The TPC of extracts was determined using the Folin-Ciocalteu (FC) phenol reagent using the micromethod described by Attard [23]. The FC phenol reagent (Cat. No. F9252, Sigma-Aldrich, St. Louis, MO, USA) was diluted 1:10 before use. Briefly, 10 µL of properly diluted extract, blank (water), or diluted standard were mixed with 100 µL FC solution (FC 1:10 v/v) in a 96-well microplate. After 3 min, 80 µL sodium carbonate solution (20% prepared in 0.1 M NaOH) was added. The reaction was performed for 1 h at room temperature in the dark. After that, the absorbance (Abs) was measured at 750 nm in a microplate reader (BioTek Instruments, Winooski, VT, USA). The results were expressed as mg GAE/mL using a freshly prepared gallic acid solution to produce the calibration curve (gallic acid 0–0.25 mg/mL) (Cat. No. G7384, Sigma-Aldrich, St. Louis, MO, USA). The obtained curve was Abs at 750 nm = 1.8472x + 0.0979 (R2 = 0.991), where x is the concentration of gallic acid.
The microplate FRAP assay method described by Patrignani et al. [24], with slight modifications, was used to determine the AA of both extracts. Briefly, 30 μL of properly diluted extract was added directly to the 96-well microplate, followed by 270 μL of freshly prepared FRAP assay solution (20 mM ferric chloride solution, 10 mM TPTZ [2,4,6-tris(2-pyridyl)-s-triazine] solution, and 0.3 M acetate buffer, pH 3.6). The TPTZ reagent (Cat. No. 93285) was supplied by Fluka Chemicals (Buchs, Switzerland). The Abs was measured at 593 nm at room temperature (25°C) in a microplate reader, after 30 min of incubation. A standard curve was run simultaneously (0–1.248 µmol FeSO4·7H2O/mL). The AA was expressed as µmol Fe+2 per mL (µmol Fe+2/mL).
The ingredients include wheat flour 000 (ash content less than 0.650%, 10.1% protein, 14.7% moisture, Favorita, Molinos Río de la Plata, Buenos Aires, Argentina), maize starch (Maizena, Unilever de Argentina S.A., Buenos Aires), high oleic sunflower oil (Molino Cañuelas, Provincia de Buenos Aires), sucrose (Ledesma, Jujuy, Argentina), baking powder (Royal, Kraft Foods, Buenos Aires, Argentina) and filtered water. The formulation and ingredient ratios were previously evaluated by Patrignani et al. [24] and have been successfully used as a model system for cookie development and the analysis of antioxidant compounds.
Five samples were prepared from a control recipe, one with water, and the other four replacing 10% or 30% of water with both extracts. The control recipe included wheat flour (31.2%), maize starch (25.6%), sucrose (11.4%), baking powder (0.6%), high-oleic sunflower oil (4.6%), and filtered water (26.6%). A kneading machine (Philips Cucina, São Paulo, Brazil) was used to prepare the dough at medium speed (speed 3 = 837 rpm). The dry ingredients were mixed first, then all the liquid ingredients were added and mixed for 3 min. Dough was held at 4°C for 30 min in a polypropylene bag before sheeting with a rolling pin to give a desirable thickness (1 cm for texture measurements and 0.3 cm for baking biscuits).
The texture profile analysis (TPA) of dough was evaluated using a texture analyser (TA-XT2i, Stable Micro Systems Ltd., Godalming, Surrey, UK) in a compression mode. Compression was exerted by an SMS P/35 cylindrical probe (pre-test speed of 2 mm/s, test speed of 1 mm/s, post-test speed of 2 mm/s, with a 50 kg load cell). The strain was set at 30%, and 30 s between cycles. The firmness, consistency, adhesiveness, resilience, and cohesiveness of dough were determined from the force-time curves. A total of six discs of each dough were analyzed (2.0 × 1.0 cm).
Rectangles of dough (2.5 × 5.0 × 0.3 cm) were placed on a silicone sheet and baked in an oven (White Westinghouse, W-CG18). Two baking conditions were evaluated: 130°C for 30 min and 160°C for 22 min. All formulations were simultaneously baked and then allowed to cool at room temperature. Dough and biscuits were weighed, and the weight loss was calculated. Biscuit and dough samples were extracted as previously described (section Preparation of geranium and lemon verbena extracts). The TPC and the antioxidant potential (AP) of extracts were determined as explained in sections TPC and AA of extracts: FRAP assay. Results were expressed as mg GAE and µmol Fe+2 per g of dried sample, respectively.
The width (w, cm), length (l, cm), and thickness (t, cm) of samples were measured in each biscuit using a vernier caliper. From these values for each biscuit, the volume (w × l × t) and the spread ratio [(w + l)/(2 × t)] were estimated.
Fracture properties of biscuits were studied by a three-point bending test with a texture analyser (TA-XT2i, Stable Micro Systems Ltd., Godalming, Surrey, UK) according to Baltsavias et al. [25] at room temperature. Span length was 1.8 cm, and compression speed was set at 0.1 mm/s. Samples were placed on supports with their top surface down. The texture was measured over a 60 min period immediately after baking. The load, deformation, and work done to failure were recorded for at least 4 replicate samples of each biscuit.
The strength (F, N) needed to break the biscuits, and the deformation was obtained from the force-deformation curve [25]. These parameters were used to calculate the fracture stress (σ, kN m–2), fracture strain (ε), and Young’s modulus (Y, kN m–2).
The aw of biscuits was measured with an AquaLab Series 3 equipment (Decagon Devices, Inc., Pullman, WA), at 25°C in duplicates in ground biscuits.
The colour of dough and biscuits was measured at three points using a colourimeter (model CR-400, Konica Minolta, Osaka, Japan). The CIE L* (lightness), a* (greenness/redness), b* (blueness/yellowness) colour space values were determined, and then the brownness index (BI) of biscuits (Equation 1) and the total difference of colour in dough and biscuit samples (s) with respect to control ones (prepared only with water) (0) (ΔE, Equation 2) were calculated.
All determinations were carried out at least in duplicate. The effect of formulation and baking conditions on the biscuit characteristics was subjected to a two-way analysis of variance (ANOVA) at a 0.05 significance level. Then, least significant differences (LSD) were calculated to compare the means (InfoStat, 2012; Córdoba, Universidad Nacional de Córdoba, Argentina).
The geranium extract (GE) was prepared from 1.99 g of dried flowers (moisture content 11.12 ± 0.30%) and 40 g of filtered water. The supernatant pH was 3.66 ± 0.01, and the total solids (°Brix) were 2.27 ± 0.06. The lemon verbena extract (LE) was prepared from 2.99 g of dried leaves (moisture: 9.14 ± 0.02%) and 40 g of water. The supernatant pH was 7.31 ± 0.01, and the total solids (°Brix) were 1.37 ± 0.06 (data not shown).
LE was characterized by a L* value of 37.3 ± 2.2 (lightness), a* of 4.1 ± 0.5 (indicating a slight red component), and b* of 11.5 ± 1.2 (indicating a strong yellow component). In contrast, GE displayed an L* value of 26.2 ± 2.4, a* of 8.1 ± 1.7 (indicating a more intense red hue), and b* of 4.8 ± 0.7 (suggesting a mild yellow contribution). The plant materials are shown in Figure 1.
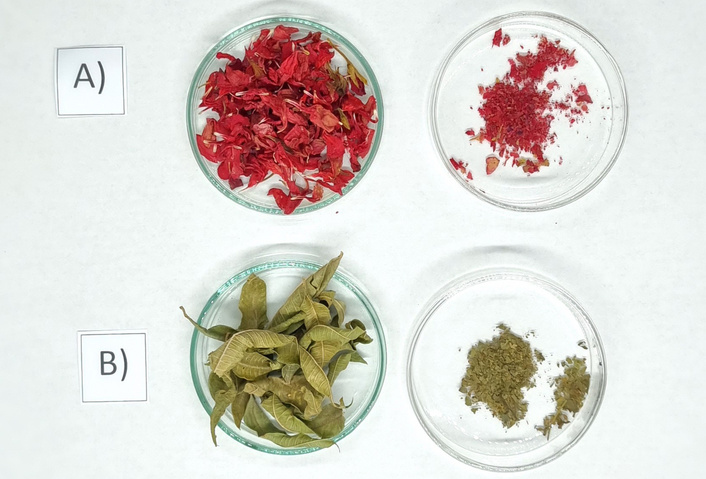
Morphology of A) Pelargonium × hortorum (geranium) red flowers and B) Aloysia citrodora (lemon verbena) leaves.
The TPC of both extracts was determined using the FC method. The GE had a value of 8.6 ± 1.0 mg GAE/mL, which was five times higher than the value of 1.7 ± 0.6 mg GAE/mL for the LE (P < 0.05).
Dough and the biscuits obtained under the two baking conditions tested are shown in Figure 2.
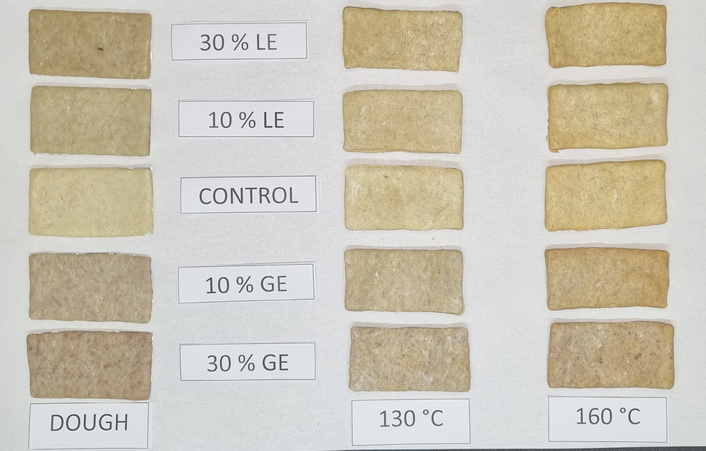
Dough samples (left) and biscuit samples (right) prepared with different levels (0, 10, and 30%) of Pelargonium × hortorum (geranium) red flower extract and Aloysia citrodora (lemon verbena) leaf extract. GE: geranium extract; LE: lemon verbena extract.
The colour characteristics of the samples are summarised in Table 1.
Colour of dough and biscuit samples prepared with extracts from Aloysia citrodora (lemon verbena) leaves and Pelargonium × hortorum (geranium) red flowers at different temperatures (130 and 160°C).
| Sample type | L* | a* | b* | ΔE | BI | |
|---|---|---|---|---|---|---|
| Dough | Control | 73.1 ± 0.5a | –0.1 ± 0.1d | 14.2 ± 0.4a | - | 21.0 ± 0.7b |
| 10% LE | 70.2 ± 0.5b | 0.0 ± 0.0d | 13.4 ± 0.2b | 3.0 ± 0.8d | 20.8 ± 0.4b | |
| 30% LE | 63.0 ± 1.0c | 1.2 ± 0.2c | 13.4 ± 0.7b | 10.2 ± 0.8c | 24.8 ± 1.7a | |
| 10% GE | 63.1 ± 0.7c | 3.9 ± 0.1b | 9.5 ± 0.4d | 11.8 ± 0.9b | 20.5 ± 0.6b | |
| 30% GE | 60.4 ± 0.6d | 5.8 ± 0.2a | 10.2 ± 0.2c | 14.6 ± 0.8a | 25.2 ± 0.6a | |
| LSD0.05 | 0.8 | 0.2 | 0.5 | 0.88 | 1.0 | |
| Biscuits 130°C | Control | 73.4 ± 1.0a | 3.7 ± 0.4e | 20.6 ± 0.7bc | - | 28.4 ± 0.8e |
| 10% LE | 72.9 ± 0.8a | 4.0 ± 0.4e | 20.8 ± 0.5b | 5.1 ± 2.9d | 32.8 ± 1.7c | |
| 30% LE | 68.2 ± 0.6b | 3.5 ± 0.4e | 17.8 ± 1.4d | 14.3 ± 3.6b | 32.3 ± 1.5c | |
| 10% GE | 60.6 ± 1.0d | 6.1 ± 0.4bc | 12.5 ± 1.0e | 15.9 ± 3.7ab | 27.7 ± 0.8e | |
| 30% GE | 57.7 ± 0.9e | 8.2 ± 0.4a | 11.3 ± 1.4f | 17.5 ± 1.3a | 32.4 ± 0.5c | |
| Biscuits 160°C | Control | 72.0 ± 1.9a | 4.6 ± 0.7d | 21.9 ± 0.9ab | - | 35.6 ± 1.0b |
| 10% LE | 67.7 ± 1.5b | 6.3 ± 1.0b | 22.5 ± 1.1a | 2.5 ± 0.7d | 37.4 ± 0.8a | |
| 30% LE | 64.8 ± 1.2c | 5.3 ± 1.3cd | 19.7 ± 0.8c | 4.6 ± 1.6d | 36.4 ± 0.8a | |
| 10% GE | 61.4 ± 0.4d | 6.4 ± 0.3b | 13.3 ± 1.2e | 11.7 ± 1.8c | 26.5 ± 1.0f | |
| 30% GE | 59.0 ± 0.9de | 8.4 ± 0.3a | 11.5 ± 0.7f | 11.9 ± 1.1c | 30.7 ± 0.6d | |
| LSD0.05 | 1.6 | 0.8 | 1.3 | 3.0 | 1.3 | |
Values in the column followed by different letters are significantly different (P < 0.05). L* (L* = 0 [black], L* = 100 [white]), a* (−a* = green, +a* = red), and b* (−b* = blue, +b* = yellow) are the parameters of colour, ΔE is the total difference of colour between samples with extracts and the control sample, and BI (browning index) was calculated to quantify the degree of browning. GE: geranium extract; LE: lemon verbena extract.
The values obtained for pH, moisture, and textural characteristics of dough samples are summarized in Table 2.
Characterization of dough samples with extracts from Aloysia citrodora (lemon verbena) leaves and Pelargonium × hortorum (geranium) red flowers.
| Sample type | pH | M | F (N) | C (N·s) | A (N·s) | Co | E |
|---|---|---|---|---|---|---|---|
| Control | 6.54 ± 0.08a | 31.4 ± 0.3b | 1.1 ± 0.1a | 2.2 ± 0.2a | 0.6 ± 0.3a | 0.6 ± 0.1 | 0.9 ± 0.2 |
| 10% LE | 6.55 ± 0.06a | 30.6 ± 0.3c | 1.0 ± 0.2a | 2.1 ± 0.3a | 0.6 ± 0.2a | 0.6 ± 0.1 | 1.0 ± 0.1 |
| 30% LE | 6.55 ± 0.03a | 31.2 ± 0.0b | 0.8 ± 0.1b | 1.6 ± 0.2b | 0.6 ± 0.1a | 0.6 ± 0.0 | 1.0 ± 0.1 |
| 10% GE | 6.37 ± 0.04b | 32.1 ± 0.1a | 0.5 ± 0.1c | 1.0 ± 0.2c | 0.4 ± 0.1b | 0.6 ± 0.0 | 1.0 ± 0.0 |
| 30% GE | 6.35 ± 0.03b | 31.6 ± 0.1b | 0.5 ± 0.1c | 1.1 ± 0.2c | 0.4 ± 0.1b | 0.60 ± 0.1 | 1.0 ± 0.0 |
| LSD0.05 | 0.07 | 0.4 | 0.1 | 0.3 | 0.1 | P > | P > |
Values in the column followed by different letters are significantly different (P < 0.05). P > indicates that no significant difference was found according to ANOVA. References: pH; M: moisture (%); dough texture from the TPA assay: F: firmness (N); C: consistency (N·s); A: adhesiveness (N·s); Co: cohesiveness (-); E: elasticity (-); (-): dimensionless. GE: geranium extract; LE: lemon verbena extract; TPA: texture profile analysis.
In biscuits, the moisture, aw, and dimensions characteristics were notably influenced by the baking condition (P < 0.05) (Table 3).
Characterization of biscuit samples prepared with extracts from Aloysia citrodora (lemon verbena) leaves and Pelargonium × hortorum (geranium) red flowers at different temperatures (130 and 160°C).
| Sample type | WL (%) | M (%) | aw | sf | V (cm3) | T4 (cm) | σ (kN m–2) | ε | Y (kN m–2) | |
|---|---|---|---|---|---|---|---|---|---|---|
| 130°C | Control | 28.2 | 6.4 ± 1.6a | 0.31 ± 0.00d | 4.7c | 11.6 ± 0.2ab | 3.35a | 11.8 ± 4.9 | 1.30 ± 0.41a | 4.1 ± 1.7c |
| 10% LE | 27.8 | 5.8 ± 0.0ab | 0.33 ± 0.00c | 4.5c | 13.2 ± 1.4a | 3.48a | 10.5 ± 5.0 | 1.34 ± 0.46a | 4.9 ± 1.9c | |
| 30% LE | 28.8 | 4.7 ± 0.7bc | 0.28 ± 0.00e | 5.3bc | 10.4 ± 1.2bc | 3.70a | 18.7 ± 6.5 | 1.21 ± 0.18a | 7.7 ± 2.7c | |
| 10% GE | 30.1 | 5.6 ± 0.3b | 0.30 ± 0.00d | 6.1ab | 7.7 ± 1.1d | 3.74a | 25.3 ± 9.9 | 0.80 ± 0.19b | 15.3 ± 4.3bc | |
| 30% GE | 30.6 | 4.6 ± 0.1bc | 0.26 ± 0.01f | 6.2ab | 7.9 ± 0.9cd | 2.86b | 15.7 ± 2.3 | 0.71 ± 0.29b | 11.5 ± 5.6bc | |
| 160°C | Control | 21.4 | 2.8 ± 0.0d | 0.16 ± 0.00h | 6.2ab | 8.7 ± 0.7cd | 2.70b | 19.2 ± 5.7 | 0.76 ± 0.08b | 26.5 ± 5.5abc |
| 10% LE | 20.3 | 3.6 ± 0.3cd | 0.21 ± 0.00g | 6.0ab | 9.6 ± 2.3c | 2.90b | 15.9 ± 5.2 | 0.90 ± 0.27ab | 18.9 ± 7.7bc | |
| 30% LE | 24.3 | 3.0 ± 0.1d | 0.17 ± 0.00h | 6.8a | 7.5 ± 1.1d | 2.65b | 21.7 ± 6.2 | 0.70 ± 0.19b | 38.8 ± 21.2a | |
| 10% GE | 24.4 | 6.9 ± 0.7a | 0.54 ± 0.00a | 5.2bc | 9.0 ± 0.6cd | 2.82b | 17.2 ± 9.4 | 0.97 ± 0.35ab | 17.9 ± 3.2bc | |
| 30% GE | 30.1 | 7.1 ± 1.1a | 0.51 ± 0.00a | 6.2ab | 8.2 ± 1.5cd | 2.48b | 23.3 ± 14.2 | 0.98 ± 0.46ab | 33.0 ± 34.4ab | |
| LSD0.05 | P > | 1.5 | 0.01 | 1.1 | 1.8 | 0.43 | P > | 0.45 | 19.2 | |
Values in the column followed by different letters are significantly different (P < 0.05). P > indicates that no significant difference was found according to ANOVA. References: WL: weight loss during baking (%); M: moisture (%); aw: water activity; sf: spread factor; V: volume (cm3); T4: the height of four biscuits that are stacked on top of each other. Texture parameters calculated from the three-point-bending test: σ: fracture stress (kN m–2); ε: fracture strain (dimensionless); Y: Young’s modulus (kN m–2). No significant differences were found in the fracture stress (σ) of all biscuits (P > 0.05). GE: geranium extract; LE: lemon verbena extract.
The antioxidant capacity of the GE was 129.8 ± 44.6 μmol Fe+2/mL, while that of the LE was 55.2 ± 5.1 μmol Fe+2/mL (P < 0.05). Results of the antioxidant capacity of dough and biscuits by the microplate FRAP method are shown in Figure 3.
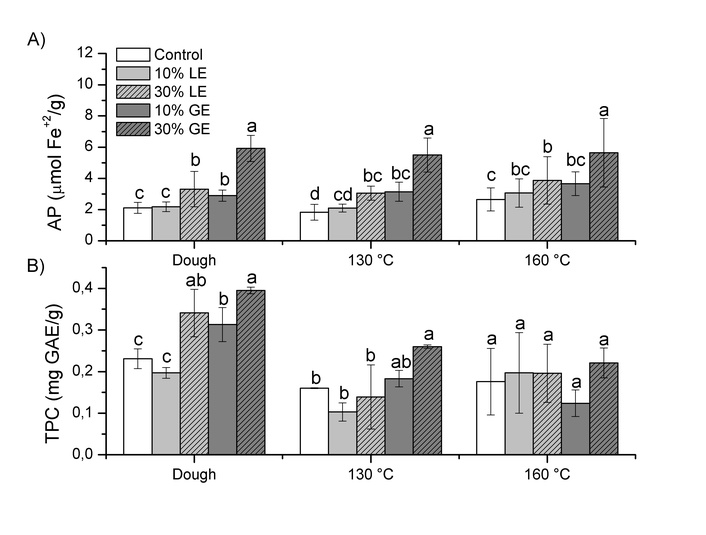
Antioxidant potential (AP) A) and total phenolic content (TPC) B) of dough and biscuit samples. Values in the same group (dough or biscuits) with different letters are significantly different (P < 0.05). GE: geranium extract; LE: lemon verbena extract.
The highest AP values were observed in 30% GE samples for dough and biscuits baked at both temperatures, whereas the lowest values were found in control samples.
The wide range of colours found in flowers and leaves is generated by the quantity and quality of various pigments, such as carotenoids and anthocyanins [26]. Anthocyanins (polar) give the characteristic red, purple, or blue colours. Carotenoids (nonpolar) give colours ranging from red to yellow [27], and chlorophyll (nonpolar) gives green tones.
LE exhibited a relatively light greenish-yellow colour, GE displayed a darker, more reddish tone. These values reflect the distinct pigmentation profiles of the two plant materials, likely attributable to their differing compositions of flavonoids and other phenolic compounds. Also, phytochemicals such as phenolic acids, flavonoids, carotenoids, and tocopherols have antioxidant properties. The markedly higher TPC observed in GE is consistent with its high antioxidant capacity [14].
Organic solvents or mixtures of organic solvents are used in many studies to analyze the antioxidant content. However, their toxicity makes them unsuitable for use in the pharmaceutical and food industries [28]. For this reason, in the present study, warm water was used to extract bioactive compounds from samples. Besides, plant extracts made with water are more nutritionally relevant than extracts prepared with organic solvents [29]. Considering this extraction approach, the effect of natural extracts incorporation on bakery products could be further evaluated.
Incorporation of extracts and baking conditions were significant factors in the colour of the samples (P < 0.05). The reddish colour of the GE persisted in both 10% and 30% dough and biscuits. In samples made with LE, a brownish tinge was only noticeable in dough with 30% LE, but not in the other samples (Figure 2). According to Mokrzycki and Tatol [30], an observer may be able to discriminate the colour difference between two objects if it is greater than 5. Taking this into account, the control and 10% LE samples would be indistinguishable (Table 1). However, the rest of the samples differ noticeably in colour from the control sample, as indicated by a ΔE greater than 10. Browning index (BI) represents the purity of the brown colour and is reported as an important parameter in processes that involve enzymatic or non-enzymatic browning [31]. The control biscuits and LE ground biscuits baked at 160°C showed significantly higher BI values than the ground biscuits baked at 130°C (P < 0.05, Table 1). Among the samples with GE, significant differences were found only in the biscuits with 30% GE, and values of BI were higher in the biscuits baked at 130°C than those baked at 160°C (P < 0.05, Table 1).
Minor differences in total colour difference (ΔE) were observed in samples made with 10% LE. On the other hand, all samples with 30% LE showed significant differences from the control sample (Table 1).
Moreover, dough samples with GE had a notably lower pH compared to the other samples (P < 0.05). Despite the equal liquid-to-dry ratio in all doughs, substantial variations in moisture content were observed. The dough with 10% LE had the lowest moisture content, while the dough with 10% GE had the highest. Those differences may be due to different compositions of soluble substances extracted from both plant materials. There were no significant differences in cohesiveness or elasticity of the dough samples (P > 0.05). But the control dough and the dough with 10% LE had the highest values for firmness, consistency, and adhesiveness, while the lowest values were found in both samples with GE (P < 0.05) (Table 2). The low pH of GE could explain its softer dough texture. In agreement, other authors have suggested that acidic conditions enhance the electrostatic repulsion of proteins, which could reduce their interaction with water and starch granules, resulting in a softer dough [32].
Baking conditions strongly influenced biscuit moisture, aw, and dimensional characteristics. The values of weight loss were higher at a lower temperature. According to Zhang et al. [32], the increase in weight loss indicates a weaker and more open gluten structure, whereas decreases could be due to the formation of a stronger and more compact gluten network. At low temperatures, the dough rises more in height than in width, resulting in a lower spread factor. Additionally, in control and samples with LE, the biscuits had a higher volume and aw, and retained more moisture when baked at a lower temperature (130°C, 30 min) compared to those baked at a higher temperature (160°C for 22 min).
However, the opposite was observed in samples with GE: greater moisture and aw values were found for biscuits baked at a high temperature. This may be because shorter cooking times result in more water being retained due to the higher soluble solids content (2.2°Brix). The control biscuits and the biscuits with 30% LE had a crisper texture at 160°C, with higher Y values and lower ε values being observed than at 130°C. The texture of the biscuits with 10% LE was similar to the control samples at 130°C, but at 160°C, the control samples had a higher Y (a crisper texture) than 10% LE. Biscuits with 10% GE had lower ε values (less rubbery texture) than the control samples at 130°C and lower Y values than the control sample at 160°C.
In addition to these textural differences, the antioxidant properties of the samples were also evaluated. The FRAP method has been used to assess the reducing antioxidants in food matrices, because it is fast and relatively simple to perform [33]. The highest AP values (5.9, 5.5, and 5.6 μmol Fe+2/g for dough, biscuits baked at 130°C, and 160°C) were observed in 30% Pelargonium × hortorum red flower extract samples (30% GE), and these values differ significantly from those of the remaining samples (P < 0.05). The lowest AP values were observed in control samples (2.1, 1.8, and 2.6 μmol Fe+2/g for dough, biscuits baked at 130 and 160°C, respectively). Moreover, 10% Pelargonium × hortorum red flower extract samples (10% GE) showed similar values to those with 30% Aloysia citrodora leaf extract samples (30% LE). There were no significant differences between the 10% LE samples (dough, biscuits baked at 130°C or baked at 160°C) and the control samples (P > 0.05).
The results shown in Figure 3B indicate that dough samples exhibited higher TPC than the corresponding baked biscuit samples. This difference is likely attributable to the presence of phenolic compounds in the raw ingredients of the dough. However, during the heating process, some of these compounds may be lost due to their thermolabile nature, particularly when high baking temperatures are applied (160°C). In agreement with this observation, no significant differences in TPC were detected among the formulations when biscuits were prepared at 160°C (P > 0.05). In contrast, at 130°C, phenolic compounds from the GE remained relatively stable when a high extract proportion (30%) was used. This finding suggests that phenolics from GE exhibit greater thermal stability than those derived from LE. In this regard, baking at 130°C would be a suitable alternative for the elaboration of GE cookies, as it would allow for adequate AA and preserve phenolic compounds to a greater extent than baking at 160°C. These results are in accordance with Blanch and del Castillo [34] and Žilić et al. [35], who found higher TPC values when baking at low temperatures than at high temperatures.
Because of the extraction procedure used in the present study, the antioxidants obtained were likely phenolic compounds and flavonoids present in Pelargonium × hortorum red flower and Aloysia citrodora leaf extracts. According to a revision made by Celi et al. [36] about different Pelargonium species, flavonoids were the most common compounds (with quercetin being one of the principal components), followed by phenolic acids and coumarins. Abdel Bar et al. [37] evaluated different biomolecules present in Pelargonium × hortorum, finding concentrations between 125–214 µg/mL of gallic acid. Pelargonium × hortorum also contains several anthocyanins, including peonidin-3,5-O-diglucoside [3,750 µg Ideain equivalent (IE)/g], malvidin-3,5-O-diglucoside (1,803 µg IE/g), pelargonidin glucoside derivative (620 µg IE/g), and cyanidin-3,5-diglucoside (473 µg IE/g), among others, with total anthocyanin content around 7,600 µg IE/g) [38]. Other authors also found rosmarinic acid [217 μg/g fresh weight (f.w.)] and caffeic acid (133 μg/g f.w.) on flowers of Pelargonium × hortorum [39]. On the other hand, the main compounds found in lemon verbena are flavones, iridoids, and phenylpropanoids [40]. Bilia et al. [41] reported that the leaves contain phenylpropanoid concentrations ranging from 20 to 150 mg/g dry weight, of which approximately 97% corresponds to verbascoside. Verbascoside is a hydrophilic compound and has antioxidant, anti-inflammatory, and antineoplastic properties, as well as wound-healing and neuroprotective effects [42]. More recently, Athanasiadis et al. [21] reported that the TPC of aqueous extracts of lemon verbena leaves ranged from 90 to 113 mg GAE/g, whereas ethanol extracts contained between 40 and 100 mg GAE/g, depending on the extraction conditions and techniques used. In addition, phenolic acids (vanillic acid, p-coumaric acid, and ferulic acid) ranged from 0.5 to 8.94 mg/g, while flavonoids (rutin, quercetin 3-O-galactoside, verbascoside, narirutin, and kaempferol 3-O-glucoside) ranged from 22.77 to 163.38 mg/g.
In conclusion, the incorporation of aqueous plant extracts as water substitutes proved to be an effective strategy to enhance the antioxidant content of biscuits. In particular, Pelargonium × hortorum (geranium) red flower extract demonstrated strong potential as a natural antioxidant ingredient for bakery products, enabling the production of functional biscuits while preserving technological quality. The results indicate that phenolic compounds from GE exhibited greater thermal stability than those from LE, and that baking GE biscuits at 130°C represents a suitable strategy to maintain AA and phenolic compounds more effectively than baking at 160°C. Nevertheless, appropriate extract concentrations must be carefully selected to avoid adverse effects on colour or texture. Overall, these findings support the use of edible plant extracts as a promising approach for developing potentially functional bakery products. While this study focused on instrumental texture and colour, future studies may benefit from incorporating sensory evaluation of taste attributes, such as flavour, sweetness, and overall palatability, using trained or consumer panels to further explore consumer acceptance of biscuits formulated with Pelargonium × hortorum red flower or Aloysia citrodora leaf extracts. Moreover, microbiological evaluation and storage stability studies would provide valuable information regarding product safety and shelf life. In addition, future research should evaluate the specific bioactive compounds present in these extracts, their effective intake levels, and the amount of product required to reach such doses. These aspects will be addressed in future research to support the development of functional bakery products with improved nutritional and technological quality.
AA: antioxidant activity
Abs: absorbance
AP: antioxidant potential
aw: water activity
BI: brownness index
CIE: Commission Internationale de l’Éclairage
f.w.: fresh weight
FC: Folin-Ciocalteu
FRAP: ferric reducing antioxidant power
GAE: gallic acid equivalents
GE: geranium extract
IE: Ideain equivalent
LE: lemon verbena extract
rpm: revolutions per minute
TPA: texture profile analysis
TPC: total phenolic content
Y: Young’s modulus
PAC: Conceptualization, Investigation, Methodology, Data curation, Formal analysis, Visualization, Writing—original draft, Funding acquisition. ADC: Investigation, Methodology, Writing—review & editing. MP: Data curation, Formal analysis, Writing—review & editing. All authors read and approved the submitted version.
The authors declare that they have no conflicts of interest.
Not applicable.
Not applicable.
Not applicable.
The data that support the findings of this study are available from the corresponding author upon reasonable request.
We thank CONICET, UNLP, and MIN-CYT for the financial support. M. Patrignani and A.D. Carboni are members of the CYTED IBERO-CIRCULAR Network, project no.323RT0142. The funders had no role in study design, data collection and analysis, decision to publish, or preparation of the manuscript.
© The Author(s) 2026.
Open Exploration maintains a neutral stance on jurisdictional claims in published institutional affiliations and maps. All opinions expressed in this article are the personal views of the author(s) and do not represent the stance of the editorial team or the publisher.
Copyright: © The Author(s) 2026. This is an Open Access article licensed under a Creative Commons Attribution 4.0 International License (https://creativecommons.org/licenses/by/4.0/), which permits unrestricted use, sharing, adaptation, distribution and reproduction in any medium or format, for any purpose, even commercially, as long as you give appropriate credit to the original author(s) and the source, provide a link to the Creative Commons license, and indicate if changes were made.

View: 798
Download: 41
Times Cited: 0
