Short Communication

Affiliation:
1Laboratory of Sciences and Health Technologies, Higher Institute of Health Sciences, Hassan First University, Settat 26000, Morocco
Email: abdessamad.didi@uhp.ac.ma
ORCID: https://orcid.org/0000-0003-4225-9232
Affiliation:
1Laboratory of Sciences and Health Technologies, Higher Institute of Health Sciences, Hassan First University, Settat 26000, Morocco
ORCID: https://orcid.org/0009-0000-7778-7065
Affiliation:
1Laboratory of Sciences and Health Technologies, Higher Institute of Health Sciences, Hassan First University, Settat 26000, Morocco
ORCID: https://orcid.org/0000-0001-9938-2843
Affiliation:
2Faculty of Science, Ibn Tofail University, Kenitra 14000, Morocco
ORCID: https://orcid.org/0009-0003-5732-5893
Affiliation:
3National Center for Nuclear Energy, Science and Technology, Kenitra 14000, Morocco
ORCID: https://orcid.org/0009-0008-8701-542X
Affiliation:
3National Center for Nuclear Energy, Science and Technology, Kenitra 14000, Morocco
ORCID: https://orcid.org/0000-0003-2195-3268
Affiliation:
4Laboratory of Theoretical Physics, Particles, Modeling and Energies, Faculty of Sciences, Mohammed First University, Oujda 60000, Morocco
ORCID: https://orcid.org/0000-0002-5381-920X
Explor Foods Foodomics. 2026;4:1010139 DOI: https://doi.org/10.37349/eff.2026.1010139
Received: October 14, 2025 Accepted: March 22, 2026 Published: April 26, 2026
Academic Editor: Ivone Vaz-Moreira, Universidade Católica Portuguesa, Portugal
This study aimed to characterize and quantify essential and potentially toxic elements in commonly consumed spices in order to evaluate their nutritional value and assess possible food-safety risks related to metal contamination. Four spices: fenugreek (Trigonella foenum-graecum), black pepper (Piper nigrum), turmeric (Curcuma longa), and ginger (Zingiber officinale) were collected from a supermarket in Mehdia (Kenitra, Morocco). Samples were homogenized, sieved (< 250 μm), and digested using a nitric/perchloric acid mixture (3:1, v/v) following AOAC Method 999.10. Sixteen elements were determined using high-resolution inductively coupled plasma mass spectrometry (ICP-MS). Quality assurance was ensured through the use of blanks, duplicate analyses, and certified reference material (NIST SRM 1573a). The results revealed significant elemental variability among the spices: ginger showed the highest sodium and manganese levels, turmeric was rich in potassium and magnesium, black pepper exhibited elevated calcium, and fenugreek contained high phosphorus concentrations. Lead was detected in all samples (3.60–15.90 μg/kg), remaining below Codex Alimentarius limits. Overall, the findings demonstrate the reliability of ICP-MS for ultra-trace elemental analysis in spices and confirm their dual nutritional and toxicological relevance. Although toxic metal levels were within regulatory limits, continuous monitoring and strengthened safety controls are recommended to minimize potential health risks.
Spices have been integral to human culture for millennia, serving not only as flavoring agents in culinary traditions but also as important components of traditional medicine [1]. Historical records from ancient civilizations such as Egypt, China, and India document the use of spices for therapeutic purposes, including the treatment of digestive disorders, respiratory ailments, inflammation, and infectious diseases [2]. These early medicinal uses, often based on empirical observations, have been transmitted across generations. In contemporary contexts, spices continue to play a dual role: enhancing food palatability while contributing to health maintenance and disease prevention [3, 4].
The chemical profile of spices is notably complex, comprising a wide array of bioactive substances, including volatile oils, phenolics, alkaloids, flavonoids, and trace elements [5]. While significant research has focused on the organic compounds responsible for taste and aroma, less emphasis has been placed on inorganic constituents, which can have profound biological and toxicological impacts [6]. Essential elements such as iron (Fe), zinc (Zn), and copper (Cu) contribute to vital physiological processes, including enzymatic catalysis, immune modulation, redox balance, and energy metabolism [7]. In contrast, the presence of toxic elements such as lead (Pb), cadmium (Cd), arsenic (As), and mercury (Hg) poses serious public health concerns, especially when these elements accumulate through chronic dietary exposure [8].
Accurate quantification of these trace elements in food matrices is thus critical for both nutritional evaluation and toxicological risk assessment. Numerous analytical techniques are employed for elemental analysis, ranging from classical approaches like atomic absorption spectroscopy (AAS) and UV-visible spectrophotometry to more sophisticated nuclear and optical spectrometric methods. Among them, neutron activation analysis (NAA) has long been appreciated for its multi-elemental capabilities and low detection limits [9–12].
In this study, we employed inductively coupled plasma mass spectrometry (ICP-MS), a highly sensitive and versatile plasma-based optical and mass spectrometric technique for the trace-level determination of essential and toxic elements in selected spice samples. ICP-MS offers exceptional detection limits [down to parts-per-trillion (ppt)], rapid analysis, and a broad dynamic range, making it especially effective for complex biological matrices such as food. The spice samples analyzed in this study were randomly purchased from a supermarket located in the Mehdia region, Kenitra, Morocco. They are of Indian origin and are essential ingredients in traditional dishes such as tagines, ensuring that the analysis reflects products commonly available to local consumers.
The objective of this work was to utilize ICP-MS to determine the concentration levels of various trace elements in four widely consumed spices: fenugreek (Trigonella foenum-graecum), black pepper (Piper nigrum), turmeric (Curcuma longa), and ginger (Zingiber officinale). These spices were selected for their global culinary relevance and longstanding medicinal use. By evaluating their elemental composition, this research aims to provide insights into both the nutritional potential and toxicological risks of spice consumption, while also demonstrating the effectiveness of advanced optical-material-based analytical techniques for food safety applications. Therefore, this study aims to provide a comprehensive elemental profile of four widely used culinary spices, fenugreek, black pepper, turmeric, and ginger using ICP-MS, supported by correlation and principal component analyses (PCAs) to assess their nutritional contribution and potential toxicological risks.
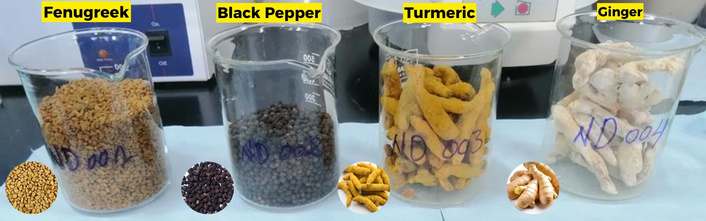
Samples of fenugreek (Trigonella foenum-graecum), black pepper (Piper nigrum), turmeric (Curcuma longa), and ginger (Zingiber officinale) were collected from reliable sources to ensure authenticity and quality (Figure 1). These samples were purchased from a supermarket located in Mehdia (Kenitra, Morocco). The products were labeled as Indian-origin commercial brands commonly available in Moroccan markets.
Each sample was ground into a fine, homogeneous powder using a stainless-steel grinder (Moulinex AR110830, France). Approximately 0.5 g of the powdered sample (particle size < 250 μm, sieved through a 60-mesh stainless-steel screen) was accurately weighed using an analytical balance (± 0.0001 g) and placed in Teflon digestion vessels.
The powdered samples were digested using a wet acid digestion method, employing a mixture of nitric acid (HNO3, 65%) and perchloric acid (HClO4, 70%) in a 3:1 (v/v) ratio. The digestion procedure followed AOAC Method 999.10 [13] with minor modifications. The digestion procedure included:
Pre-digestion at room temperature for 30 min;
Heating in a closed digestion system (microwave-assisted) up to 180°C;
Cooling, followed by dilution with ultrapure water (resistivity ≥ 18.2 MΩ·cm) to a final volume of 50 mL.
This protocol ensures complete mineralization of organic matrices and efficient release of trace elements for analysis.
The elemental analysis was performed using a Thermo Scientific iCAP-Q ICP-MS (Thermo Fisher Scientific Inc., Bremen, Germany) available at CNESTEN. The ICP-MS analysis followed the U.S. EPA Method 6020B [14] for trace-element determination in aqueous digests. Operational conditions [power 1,550 W, plasma 14 L/min argon (Ar), nebulizer 1.05 L/min, etc.] are summarized concisely. Quality control was ensured by analyzing procedural blanks, duplicate samples, and a certified reference material (NIST SRM 1573a, Tomato Leaves). Elemental recoveries ranged from 94% to 105%, and method detection limits varied between 0.1 and 2 μg kg–1, confirming the reliability and accuracy of the analytical protocol.
This technique uses a high-temperature Ar plasma (~10,000 K) to ionize elements in the sample, followed by a quadrupole mass analyzer that separates ions based on their mass-to-charge ratio (m/z) and quantifies them.
All measurements were performed in triplicate (n = 3 for each spice). Data are expressed as mean ± standard deviation (SD). SDs were calculated based on an instrumental relative SD (RSD) of = 4%, corresponding to the repeatability performance of the ICP-MS system under optimized operating conditions.
Differences among spices were evaluated using one-way analysis of variance (ANOVA), followed by Tukey’s post-hoc test for multiple comparisons. Pearson correlation coefficients were calculated to assess relationships between elemental concentrations.
PCA was performed using standardized data to evaluate multivariate patterns and discrimination among samples. Statistical significance was set at p < 0.05. All analyses were conducted using IBM SPSS Statistics v26 (Armonk, NY, USA) [15].
Following acidic digestion, the prepared samples were introduced into the inductively coupled plasma via a nebulization system. The aerosolized sample was transported by Ar gas into the plasma, where a high-temperature discharge (~10,000 K) was generated, enabling efficient atomization and ionization of the constituent elements. The resulting ions were extracted from the plasma through a set of interface cones, namely the sample cone and the skimmer cone, which facilitated ion transmission from atmospheric pressure into the high-vacuum region of the mass spectrometer while minimizing neutral species and plasma-derived interferences.
The ion beam was subsequently guided toward the mass analyzer, where ions were separated according to their m/z using a quadrupole analyzer. Elemental ions were then detected and quantified by an electron multiplier detector, generating signals directly proportional to the elemental concentrations present in the samples.
Elemental determinations were carried out using a Thermo iCAP-Q ICP-MS, equipped with a Cetac ASX-520 autosampler and operated using Qtegra™ ISDS software. A Thermoflex 2500 recirculating chiller was employed to ensure thermal stability of the instrument during analysis. The system was fitted with a concentric nebulizer, a quadrupole mass analyzer, and a collision/reaction cell. Ar (N60 grade, 99.9999% purity) was used as the plasma, auxiliary, and nebulizer gas, while high-purity helium (99.999%) was introduced into the collision cell to effectively reduce polyatomic and molecular interferences.
The radiofrequency (RF) plasma power was set to 1,550 W, a value optimized to ensure robust plasma stability and efficient ionization of the analytes following acidic digestion. Due to the elevated RF power, the plasma gas flow rate was adjusted to 14 L/min to maintain optimal plasma conditions. All instrumental operating parameters are summarized in Table 1.
Optimal operating conditions for ICP-MS analysis of the studied samples.
| Parameter | Condition |
|---|---|
| Plasma power (W) | 1,550 |
| Nebulizer flow (L/min) | 1.05 |
| Peristaltic pump speed (rpm) | 25 |
| Cool gas flow (L/min) | 14 |
| Auxiliary flow (L/min) | 0.8 |
| CCT entry lens (V) | –110 |
| CCT exit lens (V) | –40 |
| Cooling water flow (L/min) | 14 |
| D1 lens (V) | –347.16 |
| D2 lens (V) | –158 |
| 4.5 bkg | < 0.5 CPS |
| 220.7 bkg | < 2.0 CPS |
| 59Co/35Cl·16O | > 18.0 CPS |
| 59Co | > 50,000.0 CPS |
| 238U | > 300,000.0 CPS |
| 140Ce·16O/140Ce | < 0.03 CPS |
| 115In | > 100,000.0 CPS |
bkg: background signal; CCT: collision cell technology; CPS: counts per second; ICP-MS: inductively coupled plasma mass spectrometry. Ratios such as 140Ce·16O/140Ce and 59Co/35Cl·16O are used to monitor oxide formation and polyatomic interferences in ICP-MS performance.
ICP-MS is a highly sensitive analytical technique used for the detection and quantification of chemical elements at ultra-trace levels, often reaching ppt. It combines an extremely high-temperature inductively coupled plasma source for efficient atomization and ionization with a mass spectrometer for the separation and detection of ions based on their m/z. In ICP-MS analysis, the sample, typically in liquid form and containing the elements of interest, is introduced through a sample uptake system. A peristaltic pump ensures a constant and controlled flow of the sample toward the nebulizer, where it is converted into a fine aerosol by mixing with Ar gas. This aerosol then enters the spray chamber, which removes larger droplets that cannot be efficiently ionized, allowing only fine droplets to pass forward, thereby improving signal stability and reducing background noise. The aerosol is transported to the torch assembly, usually composed of quartz tubes and surrounded by a RF induction coil. The RF field ionizes the Ar gas, generating an inductively coupled plasma with temperatures ranging from approximately 6,000 to 10,000 K. At these temperatures, chemical bonds are broken, the sample is atomized, and the elements are efficiently ionized. The resulting ions are extracted through the sample cone and skimmer cone, which form the interface between the atmospheric-pressure plasma and the high-vacuum region of the mass spectrometer, while removing neutral species and excess plasma gas. Inside the vacuum system, ion guides composed of electrostatic or RF optics focus and transport the ions toward the mass analyzer with minimal losses. The quadrupole mass analyzer, consisting of four parallel rods, selectively filters ions according to their m/z by varying applied voltages, allowing individual elements or isotopes to be sequentially detected. Finally, the ions reach the detector, typically an electron multiplier, where the ion signal intensity is measured and converted into an electrical signal proportional to the elemental concentration in the original sample.
For analysis, samples were first digested using appropriate acid mixtures to ensure complete dissolution. The resulting solutions were then analyzed by ICP-MS to determine the concentrations of sodium (Na), magnesium (Mg), aluminum (Al), phosphorus (P), potassium (K), calcium (Ca), titanium (Ti), vanadium (V), chromium (Cr), manganese (Mn), Fe, nickel (Ni), Cu, Zn, strontium (Sr), and Pb.
The results reveal marked variations in elemental concentrations among the analyzed spices. The presence of three analytical replicates (n = 3) for each sample confirms the reliability and reproducibility of the measurements, as the values obtained for each replicate remain very close to one another, with RSD = 4%. This consistency indicates good analytical precision and suggests that the elemental distribution in the spice samples is relatively homogeneous (Table 2).
Trace element concentrations in spices (μg/kg, mean ± SD, RSD = 4%, n = 3).
| Element | Fenugreek (μg/kg) | Black pepper (μg/kg) | Turmeric (μg/kg) | Ginger (μg/kg) |
|---|---|---|---|---|
| Na | 1,280.08 ± 51.20 | 853.20 ± 34.13 | 784.92 ± 31.40 | 14,886.23 ± 595.45 |
| 1,294.60 ± 51.85 | 861.90 ± 34.48 | 791.70 ± 31.67 | 14,960.45 ± 598.42 | |
| 1,272.30 ± 50.76 | 846.10 ± 33.84 | 776.55 ± 31.06 | 14,795.80 ± 591.83 | |
| Mg | 2,454.11 ± 98.16 | 3,015.45 ± 120.62 | 4,068.17 ± 162.73 | 3,886.90 ± 155.48 |
| 2,475.90 ± 99.04 | 3,034.60 ± 121.38 | 4,090.45 ± 163.62 | 3,915.20 ± 156.61 | |
| 2,432.50 ± 97.30 | 2,990.80 ± 119.63 | 4,045.10 ± 161.80 | 3,854.60 ± 154.18 | |
| Al | 217.61 ± 8.70 | 874.86 ± 34.99 | 524.81 ± 20.99 | 396.18 ± 15.85 |
| 221.40 ± 8.86 | 881.75 ± 35.27 | 530.60 ± 21.22 | 401.30 ± 16.05 | |
| 214.05 ± 8.56 | 868.30 ± 34.73 | 519.25 ± 20.77 | 392.10 ± 15.68 | |
| P | 3,832.67 ± 153.31 | 1,960.67 ± 78.43 | 2,696.19 ± 107.85 | 1,784.62 ± 71.38 |
| 3,865.50 ± 154.62 | 1,982.45 ± 79.30 | 2,722.40 ± 108.90 | 1,806.75 ± 72.27 | |
| 3,798.20 ± 151.93 | 1,938.20 ± 77.53 | 2,671.60 ± 106.86 | 1,763.40 ± 70.54 | |
| K | 25,901.22 ± 1,036.05 | 36,957.90 ± 1,478.32 | 47,506.56 ± 1,900.26 | 33,649.53 ± 1,345.98 |
| 26,180.50 ± 1,047.22 | 37,220.10 ± 1,488.80 | 47,840.35 ± 1,913.61 | 33,895.70 ± 1,355.83 | |
| 25,640.70 ± 1,025.63 | 36,680.75 ± 1,467.23 | 47,210.20 ± 1,888.41 | 33,340.15 ± 1,333.61 | |
| Ca | 916.20 ± 36.65 | 1,884.00 ± 75.36 | 818.56 ± 32.74 | 457.99 ± 18.32 |
| 928.40 ± 37.14 | 1,902.35 ± 76.09 | 829.10 ± 33.16 | 463.80 ± 18.55 | |
| 904.70 ± 36.19 | 1,865.20 ± 74.61 | 808.45 ± 32.34 | 451.60 ± 18.06 | |
| Ti | 40.16 ± 1.61 | 82.53 ± 3.30 | 108.27 ± 4.33 | 20.66 ± 0.83 |
| 41.05 ± 1.64 | 83.40 ± 3.34 | 109.50 ± 4.38 | 21.10 ± 0.84 | |
| 39.30 ± 1.57 | 81.65 ± 3.27 | 107.20 ± 4.29 | 20.20 ± 0.81 | |
| V | 5.30 ± 0.21 | 11.49 ± 0.46 | 13.36 ± 0.53 | 13.34 ± 0.53 |
| 5.45 ± 0.22 | 11.70 ± 0.47 | 13.60 ± 0.54 | 13.55 ± 0.54 | |
| 5.15 ± 0.21 | 11.30 ± 0.45 | 13.10 ± 0.52 | 13.10 ± 0.52 | |
| Cr | 5.67 ± 0.23 | 8.67 ± 0.35 | 7.60 ± 0.30 | 7.62 ± 0.30 |
| 5.80 ± 0.23 | 8.90 ± 0.36 | 7.80 ± 0.31 | 7.85 ± 0.31 | |
| 5.55 ± 0.22 | 8.45 ± 0.34 | 7.40 ± 0.30 | 7.45 ± 0.30 | |
| Mn | 22.87 ± 0.91 | 62.33 ± 2.49 | 85.99 ± 3.44 | 673.24 ± 26.93 |
| 23.40 ± 0.94 | 63.70 ± 2.55 | 87.20 ± 3.49 | 685.50 ± 27.42 | |
| 22.30 ± 0.89 | 60.95 ± 2.44 | 84.75 ± 3.39 | 660.80 ± 26.43 | |
| Fe | 184.32 ± 7.37 | 281.64 ± 11.27 | 10.64 ± 0.43 | 75.34 ± 3.01 |
| 187.90 ± 7.52 | 285.40 ± 11.42 | 10.90 ± 0.44 | 77.10 ± 3.08 | |
| 180.80 ± 7.23 | 278.20 ± 11.13 | 10.40 ± 0.42 | 73.50 ± 2.94 | |
| Ni | 5.78 ± 0.23 | 6.49 ± 0.26 | 7.02 ± 0.28 | 11.32 ± 0.45 |
| 5.95 ± 0.24 | 6.70 ± 0.27 | 7.20 ± 0.29 | 11.60 ± 0.46 | |
| 5.60 ± 0.22 | 6.30 ± 0.25 | 6.85 ± 0.27 | 11.00 ± 0.44 | |
| Cu | 46.12 ± 1.84 | 33.35 ± 1.33 | 22.03 ± 0.88 | 17.08 ± 0.68 |
| 47.40 ± 1.89 | 34.10 ± 1.36 | 22.80 ± 0.91 | 17.60 ± 0.70 | |
| 45.10 ± 1.80 | 32.70 ± 1.31 | 21.30 ± 0.85 | 16.60 ± 0.66 | |
| Zn | 47.61 ± 1.90 | 35.26 ± 1.41 | 21.11 ± 0.84 | 31.36 ± 1.25 |
| 48.90 ± 1.96 | 36.10 ± 1.44 | 21.80 ± 0.87 | 32.10 ± 1.28 | |
| 46.40 ± 1.86 | 34.50 ± 1.38 | 20.50 ± 0.82 | 30.70 ± 1.23 | |
| Sr | 33.94 ± 1.36 | 61.27 ± 2.45 | 16.16 ± 0.65 | 15.71 ± 0.63 |
| 34.80 ± 1.39 | 62.60 ± 2.50 | 16.70 ± 0.67 | 16.10 ± 0.64 | |
| 33.10 ± 1.32 | 60.10 ± 2.40 | 15.70 ± 0.63 | 15.30 ± 0.61 | |
| Pb | 3.71 ± 0.15 | 10.01 ± 0.40 | 5.63 ± 0.23 | 15.41 ± 0.62 |
| 3.85 ± 0.15 | 10.35 ± 0.41 | 5.80 ± 0.23 | 15.90 ± 0.64 | |
| 3.60 ± 0.14 | 9.70 ± 0.39 | 5.45 ± 0.22 | 14.95 ± 0.60 |
Regarding major elements, the three replicate measurements clearly confirm that ginger consistently exhibits the highest Na concentrations, with values of 14,886.23, 14,960.45, and 14,795.80 μg/kg, which are significantly higher than those measured in fenugreek, black pepper, and turmeric. This elevated Na content may contribute to the particular flavor characteristics of ginger and may also influence its nutritional contribution. For K, turmeric shows the highest concentrations across the three replicates (47,506.56, 47,840.35, and 47,210.20 μg/kg), followed by black pepper and ginger, indicating that turmeric represents an important dietary source of K among the analyzed spices. Mg also presents relatively high concentrations, especially in turmeric (4,045.10–4,090.45 μg/kg), while Ca reaches its maximum levels in black pepper (1,865.20–1,902.35 μg/kg). The close agreement between the three replicate values for these macroelements confirms the stability of the measurements and supports the observed differences between spice types.
P, an essential macronutrient involved in energy metabolism and bone mineralization, was detected in all samples with moderate variations between the three replicates. Fenugreek showed the highest P concentrations (3,798.20–3,865.50 μg/kg), while lower levels were observed in ginger. Together with Mg and Ca, P contributes to several biological and physiological processes, including enzymatic regulation and skeletal health.
Trace elements such as Al, Ti, V, Cr, and Mn also exhibited noticeable differences among the spices; however, the replicate measurements remain highly consistent, demonstrating the robustness of the analytical procedure. For example, Al concentrations in black pepper remain consistent across the three measurements (868.30–881.75 μg/kg), while Ti concentrations are highest in turmeric (107.20–109.50 μg/kg). Among the trace micronutrients, Mn shows particularly elevated concentrations in ginger, with values ranging from 660.80 to 685.50 μg/kg, much higher than in the other spices. Mn is an essential element involved in antioxidant defense mechanisms and metabolic pathways, although excessive intake could potentially pose health concerns.
Other nutritionally important trace elements such as Fe, Cu, and Zn were also detected in measurable concentrations. Black pepper exhibited the highest Fe levels (278.20–285.40 μg/kg), whereas fenugreek contained the highest Cu and Zn concentrations. The narrow variability between the three replicates for each element confirms the reliability of the results and indicates good analytical precision.
Concerning potentially toxic elements, Pb was detected in all analyzed spice samples, with concentrations ranging from 3.60 to 15.90 μg/kg across the three replicates. Ginger presented the highest values among the studied spices, whereas fenugreek showed the lowest levels. Importantly, all measured concentrations remain well below the maximum permissible limit of 2 mg/kg established by the Codex Alimentarius Commission [16]. The presence of Pb in these samples is most likely associated with environmental contamination from soil, atmospheric deposition, or post-harvest handling and packaging processes rather than intrinsic plant uptake.
Overall, the close agreement between the three replicate measurements for each spice confirms the high reproducibility and reliability of the analytical method, while the observed variations between spices reflect differences in botanical origin, soil composition, agricultural practices, and environmental conditions. Although the concentrations of potentially toxic elements remain within safe limits, continuous monitoring of heavy metals in spices remains essential to ensure food safety and minimize long-term cumulative exposure.
Na and K concentrations in the analyzed spices showed significant variability. In the present study, ginger exhibited a Na concentration of 14,886.23 μg/kg (14.88 mg/kg). While this concentration is higher than the trace levels occasionally reported for certain specific Indian ginger cultivars, it remains relatively low when compared to the broader averages for Indian ginger, which typically present higher mineral variations (Shirin and Prakash [17]). This discrepancy may be attributed to differences in geographical origin, soil composition, irrigation practices, and cultivation methods. In contrast, turmeric presented the highest K concentration (47,840.35 μg/kg), which is consistent with the findings of [18], who reported K levels between 45,000 and 50,000 μg/kg in turmeric samples from various regions of India. This agreement suggests that K content in turmeric remains relatively stable despite geographical variations.
Regarding Mg and Ca, turmeric showed the highest Mg concentration (4,090.45 μg/kg), in close agreement with the results reported by [18], who found Mg levels ranging from 4,000 to 4,500 μg/kg in turmeric. Ca concentrations in black pepper were recorded at 1,884.00 μg/kg. Interestingly, this value is significantly lower than those reported by Potortì et al. [19], who detected Ca in the g/kg range. This substantial contrast highlights the high precision and sensitivity of our specific analytical technique in measuring lower-bound concentrations, while also suggesting potential variations due to geographical origin or sample processing. These similarities indicate consistency in the accumulation of major mineral elements across different studies.
Essential trace elements, including Fe, Zn, and Cu, were also found to be comparable with values reported in the literature. In this study, the Fe concentration in ginger was found to be 75.34 μg/kg, which is lower than the concentrations of 140 μg/kg and 290 μg/kg reported for yellow and white ginger, respectively, by Ajayi et al. [20]. Likewise, Zn levels measured in black pepper (35.26 μg/kg) are consistent with those reported by Braz [21] for African spices, where Zn concentrations ranged from 30 to 40 μg/kg. Overall, the elemental concentrations obtained in this study are in good agreement with previously published data. For instance, the Ca concentration in black pepper (1,884.00 μg/kg) closely matches the findings of Potortì et al. [19], while Mg levels in turmeric (4,068.17 μg/kg) align with those reported by Ikpeama et al. [18]. Such consistency across independent studies reinforces the reliability of the analytical methodology and suggests a relative regional uniformity in the elemental composition of commonly traded spices.
Concerning toxic elements, Pb was detected in all samples, with the highest concentration observed in ginger (15.90 μg/kg). These values are comparable to those reported by Moujanni et al. [22], who found Pb concentrations ranging from 10 to 20 μg/kg in imported spices. Although the detected levels remain below international safety limits, the consistent presence of Pb, even at low concentrations, highlights the importance of continuous monitoring to minimize consumer exposure and ensure food safety.
Although the investigation was limited to four spice types, the experimental design included triplicate analyses and the quantification of sixteen elemental variables, yielding a statistically robust multivariate dataset. This approach provides sufficient analytical depth to justify full research article consideration rather than a short communication.
Analyzing trace elements in spices is crucial as it can reveal potentially hazardous contaminants. Pb, in particular, is a well-known toxic element that can cause neurological damage, especially in children. Chronic exposure to high levels of Mn can also lead to neurotoxic effects. Although the concentrations measured in this study are generally low, the accumulation of these elements through regular and prolonged consumption of contaminated spices can pose health risks. Therefore, it is imperative to monitor and regulate contaminant levels in spices to ensure consumer safety.
Correlations and PCA of trace element concentrations in spices (Figure 2).
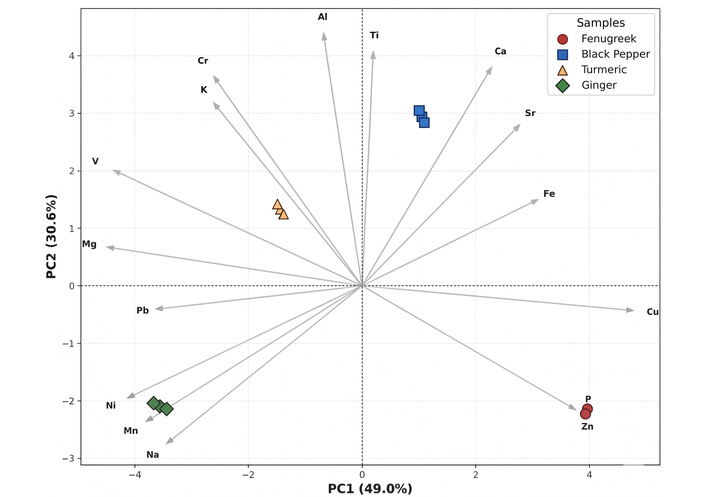
Principal component analysis (PCA) biplot summarizing the distribution of trace elements in fenugreek, black pepper, turmeric, and ginger. The first and second principal components (PC1 and PC2) account for 49.0% and 30.6% of the total variance, respectively.
The biplot obtained from PCA provides a multivariate visualization of the relationships between spice samples and their elemental composition. Figure 2 summarizes the distribution of trace elements in fenugreek, black pepper, turmeric, and ginger, considering the three analytical replicates for each spice. The first two principal components, PC1 (49.0%) and PC2 (30.6%), together explain 79.60% of the total variance, indicating that the two-dimensional representation captures most of the variability in the dataset.
Overall, the PCA clearly differentiates the four spices according to their elemental profiles. The clustering of the three replicates for each spice is very tight, which confirms the high reproducibility of the analytical measurements and the chemical homogeneity within each spice sample, consistent with the low RSD (= 4%) reported in Table 2.
PC1 (horizontal axis) represents the main source of variability in the dataset and is strongly influenced by elements such as Na, Mn, Ni, and Pb, which are oriented toward the negative side of the axis. In contrast, elements such as P, Zn, and Cu are oriented toward the positive direction of PC1. This distribution creates a clear separation between certain spice types. Ginger samples appear grouped on the negative side of PC1, closely aligned with the vectors corresponding to Na and Mn, confirming the high concentrations of these elements observed in the quantitative results. This strong association indicates that Na and Mn are the principal chemical markers characterizing ginger in the dataset.
On the opposite side of the diagram, fenugreek samples are positioned on the positive side of PC1, where they show strong associations with P, Zn, and Cu. This agrees well with the elemental concentrations presented in Table 2, where fenugreek exhibited relatively elevated levels of these elements compared with other spices. The clear separation between fenugreek and ginger along PC1, therefore, reflects their markedly different elemental signatures.
PC2 (vertical axis) represents the second most important source of variation and is mainly influenced by Ca, Sr, Ti, and Al, which are oriented in the positive direction of the vertical axis. Along this axis, black pepper samples appear clearly separated from the other spices, occupying the upper-right quadrant of the biplot. Their position indicates a strong association with Ca and Sr, which is consistent with the high Ca concentrations measured in black pepper in Table 2. This confirms that Ca-rich mineral composition is a distinguishing feature of black pepper among the analyzed spices.
Turmeric samples are located closer to the center of the plot, indicating a more balanced elemental composition without a single dominant trace element. However, their orientation toward the vectors representing Mg, K, Cr, and V suggests moderate correlations with these elements. This observation agrees with the quantitative results, where turmeric showed relatively high concentrations of K and Mg compared with several other spices.
Another important observation from the biplot is the direction and length of the element vectors. Longer vectors indicate elements that contribute strongly to the overall variability in the dataset. For example, vectors corresponding to Na and Mn are relatively long, confirming that these elements play a major role in distinguishing the spice samples. Additionally, elements pointing in similar directions are positively correlated, whereas those pointing in opposite directions tend to be negatively correlated.
Figure 3 illustrates a correlation matrix that depicts the pairwise relationships between trace element concentrations (in μg/kg) in the same four species. The Pearson correlation coefficients are visualized using colored circles: red indicates positive correlations, while blue denotes negative ones; the intensity and size of each circle reflect the strength of the correlation. Specifically, the further the correlation coefficient is from 0, the larger the dot. Several strong positive correlations are evident, such as Cr-V, Sr-Ca, and Mg-Na, suggesting that these elements may originate from common sources or share similar uptake mechanisms within plant matrices. On the other hand, significant negative correlations are observed between Zn-Mg and Ni-Cu, implying possible antagonistic interactions or differences in bioavailability or environmental exposure. Furthermore, the weak or negligible correlations between pairs such as Ca-K, Zn-Na, and Pb-Fe indicate independent uptake pathways or distinctly different environmental sources for these specific elements. This pattern, together with the PCA grouping, confirms that elemental distributions can differentiate spice types and reveal potential contamination signatures.
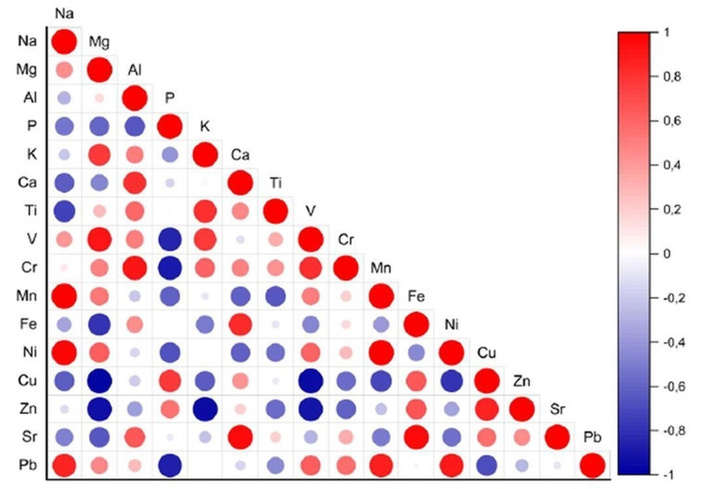
Correlation matrix of trace element concentrations (μg/kg) in fenugreek, black pepper, turmeric, and ginger.
This study successfully achieved its aim of characterizing the trace-element composition of four major culinary spices using high-resolution ICP-MS. The integration of PCA and correlation analyses provided insights into both nutritional and toxicological aspects, confirming that these spices are valuable dietary sources of essential elements while emphasizing the need to monitor toxic metal residues for food-safety assurance. The elemental analysis revealed notable variations among the spices: ginger showed elevated Na and Mn levels, turmeric had the highest K and Mg concentrations, black pepper contained more Ca, and fenugreek exhibited high P levels. Although the detected concentrations of toxic elements such as Pb were generally low, their presence highlights the importance of regular monitoring to protect consumer health. The data obtained can serve as a reference for future studies and contribute to establishing stricter food-safety standards. Further investigations on bioavailability and long-term exposure are recommended to better assess potential health risks.
Al: aluminum
Ar: argon
Ca: calcium
CCT: collision cell technology
CPS: counts per second
Cr: chromium
Cu: copper
Fe: iron
HClO4: perchloric acid
ICP-MS: inductively coupled plasma mass spectrometry
K: potassium
m/z: mass-to-charge ratio
Mg: magnesium
Mn: manganese
Na: sodium
Ni: nickel
P: phosphorus
Pb: lead
PCAs: principal component analyses
ppt: parts-per-trillion
RF: radiofrequency
RSD: relative standard deviation
SD: standard deviation
Sr: strontium
Ti: titanium
V: vanadium
Zn: zinc
The authors sincerely acknowledge the Higher Institute of Health Sciences, Hassan First University of Settat, for facilitating research collaboration and providing laboratory resources.
AD: Conceptualization, Methodology, Supervision, Writing—review & editing, Project administration. EME: Investigation, Data curation, Writing—original draft, Visualization. MK: Validation, Formal analysis, Writing—review & editing. AB: Resources, Supervision, Validation. IA: Data curation, Formal analysis, Visualization. HA: Supervision, Project administration, Writing—review & editing. AR: Supervision, Writing—review & editing. All authors read and approved the submitted version.
The authors declare there are no known competing financial interests or personal relationships that could have appeared to influence the work reported in this paper.
Not applicable.
Not applicable.
Not applicable.
The raw data supporting the conclusions of this manuscript will be made available by the authors, without undue reservation, to any qualified researcher.
Not applicable.
© The Author(s) 2026.
Open Exploration maintains a neutral stance on jurisdictional claims in published institutional affiliations and maps. All opinions expressed in this article are the personal views of the author(s) and do not represent the stance of the editorial team or the publisher.
Copyright: © The Author(s) 2026. This is an Open Access article licensed under a Creative Commons Attribution 4.0 International License (https://creativecommons.org/licenses/by/4.0/), which permits unrestricted use, sharing, adaptation, distribution and reproduction in any medium or format, for any purpose, even commercially, as long as you give appropriate credit to the original author(s) and the source, provide a link to the Creative Commons license, and indicate if changes were made.

View: 992
Download: 61
Times Cited: 0