Original Article

Affiliation:
Institute of Food Science and Technology, CAAS, Key Laboratory of Agro-Products Processing, Ministry of Agriculture, Beijing 100193, China
†
Affiliation:
Institute of Food Science and Technology, CAAS, Key Laboratory of Agro-Products Processing, Ministry of Agriculture, Beijing 100193, China
†
Affiliation:
Institute of Food Science and Technology, CAAS, Key Laboratory of Agro-Products Processing, Ministry of Agriculture, Beijing 100193, China
Affiliation:
Institute of Food Science and Technology, CAAS, Key Laboratory of Agro-Products Processing, Ministry of Agriculture, Beijing 100193, China
Email: bjfcaas@126.com
ORCID: https://orcid.org/0000-0001-8664-8788
Explor Foods Foodomics. 2023;1:162–177 DOI: https://doi.org/10.37349/eff.2023.00013
Received: September 15, 2022 Accepted: July 03, 2023 Published: August 31, 2023
Academic Editor: Josep Rubert, Wageningen University, Netherlands
Aim: In this study, Polyphenol and chemical profiles in core, pulp, and peel of 7 apple varieties [Fuji (FS), Qinguan (QG), Qingping (QP), Jinshuai (JS), Gala (GL), Changmiou (CMO), and Huahong (HH)] were comparatively studied to distinguish the different metabolism biomarkers in the three parts of apple fruit.
Methods: This study investigated the distribution of 15 polyphenolic compounds using a combination of multivariate analysis and ultra-performance liquid chromatography-quadrupole time-of-flight mass spectrometry (UHPLC-Q-TOF-MS).
Results: chlorogenic acid, catechin, epicatechin, phloretin were the most abundant components. While phloretin was the dominant component in core, chlorogenic acid was the main phenolic compound in pulp, and quercetin was mainly found in apple peel. The multivariate analysis showed that the chemical profile of peel was significantly distinct from that of apple pulp and core, whereas apple pulp and core overlapped with each other. The difference attributed to the compounds that were predicted from ultra-high performance liquid chromatography combined with quadrupole time-of-flight mass spectrometry (UHPLC-Q-TOF-MS), which were remarkably different (P < 0.05) and belong to polyphenol.
Conclusions: It indicates that the potential superior biomarker of polyphenols is to differentiate the products from apple core, pulp, and peel respectively. This research provided an insight on the polyphenolic profile of core, pulp, and peel of apple fruits.
Apple (Malus domestica L.) is a widely cultivated and consumed fruit throughout the world. The known apple varieties are more than 7,500 and only 10% of them are intendedly bred and cultivated to develop a series of desired characteristics, including Fuji (FS), Golden Delicious, Gala (GL), Granny Smith, Jonagold, and so forth [1]. Different apple cultivars vary in taste and appearance owing to their distinctively different chemical compositions. Polyphenols are responsible for the unique astringency flavor, susceptive to fruit browning, and also antioxidant activity.
Apple polyphenols can be divided into different structural subclasses, comprising four major groups, including dihydrochalcones (e.g., phloridzin), flavan-3-ols (e.g., catechin, epicatechin, and procyanidins), hydroxycinnamic acids (e.g., chlorogenic acid), and flavonols (e.g., quercetin glycosides) [2]. And the composition and proportion of each phenolic group varied in different apple varieties [3]. Given the molecular structure of free hydroxyl groups on the extended and conjugated aromatic system, apple polyphenols are of high potential for unpaired electron delocalization and metal chelating. Thus, apple consumption is related to bioactivity on prevention and treatment of several chronic disorders, like cancer, hypertension, hyperlipidemia, etc. [4]. In this respect, apple polyphenols have become an important indicator for antioxidant and nutritional properties evaluation as proposed in several literatures [5–7]. Accompanied by versatile and valuable chemometric techniques [2, 8, 9], apple polyphenols would be a feasible monitoring target molecules as markers to establish both the quality and origin of apple and apple products, which is crucial and a major concern in order to maintain and improve the standard of consumers life [10].
Apple polyphenol compositions are ultimately depended on the metabolic makeup of an apple fruit. Polyphenols are the main secondary metabolites in apple fruits for self-protection and adversity resistance [11]. They are primarily derived from phenylpropanoid and flavonoid pathways [12], in which a series of enzymatic reactions are involved. Specifically, phosphoenolpyruvic acid, the intermediates metabolite of primary metabolism, is catalyzed into L-phenylalanine by dehydratase, phosphate synthase, kinase, mutase, and aminotransferase successively. And L-phenylalanine is then subjected to catalyze reaction of phenylalanine ammonia lyase, chalcone synthase, flavanone 3-hydroxylase, dihydroflavonol 4-reductase, anthocyanidin synthase, and uridine diphosphate (UDP)-glucose flavonoid 3-O-glucosyl transferase to form different kinds of phenolic compounds. Nonetheless, apple fruit metabolism is also notably affected by external factors, like light, temperature, rainfall, cultivation technique etc. Therefore, the metabolism pattern varied in different parts of apple fruit (peel, pulp, and core), as well as in different apple varieties, leading to uneven space distribution of polyphenols in both concentration and composition. So far, several researchers have investigated the differentiation and classification of apple fruit according to the variety and/or geographical origin by using different chemometric techniques [2]. Focusing on untargeted metabolic profiles related to polyphenols, liquid chromatography quadrupole-time of flight mass spectrometry (LC-Q-TOF-MS), 1H NMR has been applied to discriminate their difference on dried apple [8], edible part of mongo [13], sweet potato [9], coffee leaves [10] and tea [14]. Moreover, LC-Q-TOF-MS has been demonstrated to be an advanced platform for the quantification and identification of characteristic components.
However, few work has been conducted to systematically illustrate the polyphenol spatial distribution in apple fruit among different varieties [15–17]. Currently, there is a lack of research on whether the polyphenolic profile of specific parts of the apple fruit can serve as an indicator for distinguishing between apple varieties. This study was aim to characterize and categorize apple fruit from perspective of spatial distribution of polyphenol profile in apple fruit. Seven apple varieties, including FS, Qinguan (QG), Qingping (QP), Jinshuai (JS), GL, Changmiou (CMO), and Huahong (HH) cultivars, were investigated for their polyphenol profile in fruit core, pulp, and peel. The metabolome spatial distribution in mature apple fruits were trying to be disclosed for character and category prediction by utilization of UHPLC-Q-TOF-MS based metabolomics approach.
High-performance liquid chromatography (HPLC) grade methanol and acetic acid were purchased from Merck Co. (Darmstadt, Germany). Standard phenolic compounds: coumaroylquinic acid, protocatechuic acid, neo-chlorogenic acid, chlorogenic acid, catechin, epicatechin, caffeic acid, p-cumaric acid, ferulic acid, phloretin, phlorizin, quercetin, quercitrin, quercetin-3-O-galactoside, procyanidin B1 of HPLC grade and bought from Sigma-Aldrich® Co. (St. Louis, Missouri, USA). Folin-Ciocalteu reagent, analytical hydrochloride, sodium hydroxide obtained from Aladdin® Industrial Corporation (Fengxian, Shanghai, China). Ultra-pure water provided by ULUP-Ⅰ microanalysis system (Xi’an, China) was used in all the experiment.
Apples of 7 varieties were collected in October 2017, which were provided by the national apple breeding research base of China in Xingcheng, Liaoning Province (N40°33’ E120°45’). The selected seven varieties include FS, QG, QP, JS, CMO, GL, and HH. The apples were packed in plastic atmosphere bags in shock proof cartons, and stored at 4°C, and 85% relative humidity refrigerator until use. For each apple variety, 5 fruits were segmented into three parts of core, pulp, and peel (seed was not considered in present study), which were instantly freezed in liquid nitrogen, and subsequently smashed into powder. The core, pulp, and peel freeze powder were then stored at –80°C for further analysis.
About 10 g frozen powder of the core, pulp, and peel of each variety of apple was taken, mixed with 1.0 mL 2% NaCl solution and 10 mL 80% methanol solution. The samples were extracted by using ultrasonic under 45 kHz, < 30°C, for 20 min. (Ultrasonic machine, SB 25-12 DTN, Scientz Biotechnology Co.,Ltd, Ningbo, China) . The supernatant was centrifuged (10,000 rpm, 4°C, 10 min) by using centrifuge (5804R, Eppendorf, Hamburg, Germany) before being collected. The residue part was then added 50 µL of 37% HCl and 10 mL of 80% methanol for ultrasonic-assisted extraction and collected the supernatant after centrifugation. The residue was further added 100 µL 5 mol/L NaOH, and 10 mL of 80% methanol for ultrasonic-assisted extraction, and collect the supernatant after centrifugation. Combined the neutral, acidic, and alkaline supernatant extracts, and dried by nitrogen blow at the temperature of less than 30°C. The dry matter was then dissolved in 5 mL methanol and stored at –80°C for further analysis.
The Folin-Ciocalteu method was used for total polyphenol concentration determination, based on the method established previously [18] with some modifications. Gallic acid was used as standard and ultra-pure water was used as blank. Briefly, 1.0 mL of diluted apple extracts (apple extracts were diluted by distilled water for 100-fold) was mixed with 0.5 mL of Folin-Ciocalteu reagent before adding 3 mL of sodium carbonate solution (10%, weight/volume). Water was added to bring the volume to 10 mL. The absorbance was read at 760 nm after 30 min reaction in dark place. Results were expressed as mg gallic acid equivalent (GAE) per gram sample. Each sample was tested in triplicate.
HPLC analysis of polyphenol composition was performed on a Waters® 2695 HPLC system with ultraviolet-photodiode array (UV-PDA) detector (HLPC-PAD, Waters, Milford, USA), the wavelength of which was set at the range of 200–600 nm. The system equipped with a Promosil® C18 column (4.6 mm × 250 mm, 100 A, 5 µm, Agilent Technologies, China) operated at 30°C. Phase A was 2% acetic acid in ultra-pure water, and phase B was 100% methanol. The flow was set as 1.0 mL/min, and the injection volume was 10 µL. The gradient program was the optimized settings: 20 min, 5–25% B; 15 min, 25–40% B; 5 min, 40% B; 5 min, 40–95% B; 5 min, 95% B; 3 min, 95–5% B; and finally, 2 min, 5% B, which referred the previous method [19]. The system was controlled by Breeze software. Quantification was conducted by external standards using HPLC grade standard polyphenol compounds.
Analysis was performed on an ultra-performance liquid chromatography (ACQUITY UPLC®, Waters Corp., Milford, MA) equipped with an Acquity UPLC® BEH column C18 1.7 μm 2.1 mm × 100 mm, Waters Corp.) connecting to a quadrupole time of flight mass spectrometer (Xevo® G2-S QTof, Waters Corp.). The detailed protocol was established in the reference [19]. The mobile solutions were water with 0.04% acetic acid (A) and methanol containing 0.04% acetic acid (B). The gradient program was set as follows, from 5–95% B, 11 min; 95% B, 1 min; 95–5% B, 0.1 min; 95% B, 2.9 min. The column was kept at 40°C and the flow rate was 0.3 mL/min. Mass spectra were acquired using electrospray ionization under positive mode over the range of m/z 100–1,700. The desolvation gas temperature was 550°C, the cone gas flow was 50 L/h, and the desolation gas flow was 1,000 L/h. The accurate mass and composition of the precursor were calculated and sequenced using the MassLynx™ software (Waters Corp., Milford, MA). The stability of the method was tested by performing 6 repeated injections of solutions prepared from authentic reagents catechins and chlorogenic acid every 2 h. The relative standard deviation of the retention times was below 2% and the mass error was below 5 ppm. Quality control (QC) samples were prepared by mixing all the sample extracts, then divided into four QC samples and analyzed using the same method as the experimental samples. The QC samples were run every six samples throughout the analytical run to make sure the repeatability could be assessed.
Chromatographic data acquired from the HPLC coupled with electrospray ionization quadrupole time-of-flight tandem mass spectrometry (HPLC-ESI-Q-TOF-MS) (waters Xevo® G2) were directly imported to Progenesis QI V2.0 data processing platform, which adopts an intuitive workflow approach to perform data analysis. Automatic data processing was available in the form of licensing individual data files, running and reviewing alignment before experiment design, in which two ways of grouping (group by apple varieties and group by peel, pulp, and core of apple fruit) were used. Furthermore, parameter was set for compounds ions peak picking, and data normalization method was established to review normalization. Then we review and edit the various adduct and forms of a compound, and identify compound using progenesis MetaSCOPE®, combined with database of NCBI, PUBMED filtered by conditions of ANOVA P value ≤ 0.05, variable importance in the projection (VIP) > 1, max fold change ≥ 20. The possible compounds were further analyzed by their identity and expression between conditions. Multivariate statistical analysis was conducted using principal component analysis (PCA), partial least-squares discriminant analysis (PLS-DA), and orthogonal partial least squares discriminant analysis (OPLS-DA) performed on EZinfo 3.0 (Umetrics®, Umea, Sweden). Regression model was constructed by PLS to examine the relation between metabolite profiling and the score of evaluation.
Chromatographic data acquired from the LC-Q-TOF-MS (Waters Xevo® G2) were imported to Waters UNIFI® for metabolites identification and binary comparison. The analysis was based on the natural products database, which was established by collecting the polyphenols and related metabolites information from the recently published literatures [10, 14, 20, 21]. The analysis was conducted by matching the imported data file and the data processing method, in which blank, standard, QC, and experimental tests were labeled and set for three replicates. The characteristic components screening and difference constitutes comparison were processed automatically.
Apple (Malus domestica) is the mostly consumed, cultivated, and investigated fruit, which is distinct in both the morphology and flavor among different apple varieties. Even though the seven apple varieties were cultivated in the same research base with the same cultivation approach, harvested time, and exactly the same storage method, the appearances of the same maturity of apple fruit were remarkably different from those in different apple varieties (Figure 1A). It has been reported that different apple varieties with distinctive morphology, texture, taste, flesh color, and also their polyphenol content and composition [18].
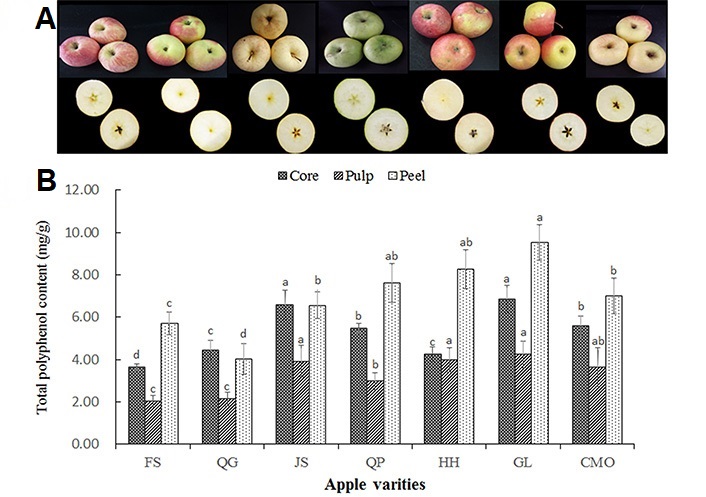
(A) The morphology and cross-section color of 7 apple varieties; (B) total polyphenol distribution in core, pulp, and peel of apple fruit. Data are presented as mean ± SD of three independent experiments, different letters upon error bars indicate significant difference. P < 0.05
Polyphenols are the main secondary metabolites in apple fruit, the content varied in different apple cultivars and in different part of the apple. In present study, there was a large variation in total polyphenol content across the peel, pulp, and core of the seven apple cultivars (Figure 1B), ranging from 368.6 μg/g to 684.0 μg/g fresh weight (FW) in core; from 202.5 μg/g to 423.5 μg/g FW in pulp; and from 401.6 μg/g to 952.9 μg/g FW in apple peel. These results are in line with the total polyphenol content (363.9–2,516.9 μg/g FW) of peel in 145 apple cultivars for two years [22]. The difference was proposed to be induced by different sampling strategies, quantification approaches, as well as climate variation, agricultural practices, and location. As comparable to the previous research that provided the polyphenol level in the pulp of 66 apple varieties from the UK [23], 58 apple varieties from China [2], and 20 apples from Jena German [7]. Moreover, total polyphenol level was a significant difference among different cultivars. Total polyphenol of apple peel was found in descending order in GL, HH, QP, CMO, JS, FS, and QG, while total polyphenol level of pulp was in the descending order of GL, HH, JS, CMO, QP, FS, QG; and total polyphenol level of core was in descending order of GL, JS, QP, CMO, QG, HH, FS.
In the present work, the distribution of four groups of polyphenols, including phenolic acid, flavanols, dihydrochalcones, and flavonols in apple peel, pulp, and core were separately identified and quantified by using high-performance liquid chromatography-diode array detection (HPLC-DAD). Phenolic acid, including gallic acid, p-coumaric acid, protocatechuic acid, caffeic acid, ferulic acid, neochlorogenic acid, and chlorogenic acid were listed in Table 1. Flavanols including catechin, and epicatechin; two dihydrochalcones including phloretin and phloretin-2’-O-glucuronide, and four flavonols including quercetin, quercetin-3-O-rhamnoside, quercetin-3-O-galactoside, quercetin-3-O-rutinoside level were showed in Table 2. These results are in good agreement with the research that chlorogenic acids were then the main phenolic acids in different apple varieties [3, 8, 24].
Flavanol, dihydrochalcone, and flavonol composition and distribution in core, pulp, and peel of apple fruit (ug/g)
| Variety | Part | Gallic acid | Protocatechuic acid | Caffeic acid | Neochlorogenic acid | Chlorogenic acid | p-coumaric acid | Ferulic acid |
|---|---|---|---|---|---|---|---|---|
| FS | Core | 3.153 ± 0.013 | 1.781 ± 0.011 | 2.657 ± 0.06 | 4.031 ± 0.037 | 153.295 ± 21.2 | 0.540 ± 0.090 | 0.524 ± 0.004 |
| Pulp | 0.047 ± 0.006 | 0.748 ± 0.009 | 3.439 ± 0.83 | 3.475 ± 0.045 | 90.569 ± 1.97 | 0.082 ± 0.001 | 0.875 ± 0.007 | |
| Peel | 4.173 ± 0.021 | 3.457 ± 0.057 | 15.167 ± 0.92 | 9.677 ± 0.096 | 76.873 ± 1.11 | 3.046 ± 0.087 | 4.670 ± 0.089 | |
| QP | Core | 3.142 ± 0.015 | 2.112 ± 0.029 | 40.643 ± 1.56 | 18.572 ± 0.198 | 213.804 ± 5.86 | 2.018 ± 0.031 | 4.272 ± 0.092 |
| Pulp | 1.944 ± 0.008 | 3.545 ± 0.053 | 19.929 ± 0.87 | 8.304 ± 0.087 | 36.377 ± 1.00 | 0.779 ± 0.062 | 1.139 ± 0.074 | |
| Peel | 3.420 ± 0.013 | 3.099 ± 0.048 | 29.135 ± 0.33 | 6.237 ± 0.074 | 16.796 ± 0.76 | 0.189 ± 0.007 | 1.980 ± 0.057 | |
| HH | Core | 3.752 ± 0.021 | 1.240 ± 0.029 | 6.197 ± 0.95 | 11.425 ± 0.154 | 21.493 ± 0.92 | LD | LD |
| Pulp | 2.608 ± 0.033 | 0.861 ± 0.008 | 6.894 ± 0.73 | 8.602 ± 0.102 | 25.367 ± 0.89 | LD | 1.054 ± 0.039 | |
| Peel | 4.488 ± 0.054 | 6.200 ± 0.074 | 64.085 ± 0.44 | 17.453 ± 0.933 | 57.097 ± 1.57 | LD | 8.795 ± 0.078 | |
| QG | Core | 4.155 ± 0.047 | 2.018 ± 0.042 | 2.605 ± 0.51 | 2.563 ± 0.087 | 389.675 ± 9.54 | LD | 3.380 ± 0.067 |
| Pulp | 1.385 ± 0.023 | 0.886 ± 0.009 | 2.546 ± 0.47 | 0.824 ± 0.055 | 215.055 ± 6.39 | 0.317 ± 0.003 | 3.105 ± 0.032 | |
| Peel | 4.364 ± 0.055 | 1.654 ± 0.015 | 7.150 ± 0.88 | 1.379 ± 0.099 | 234.573 ± 11.91 | LD | 6.399 ± 0.045 | |
| JS | Core | 4.426 ± 0.037 | 2.635 ± 0.017 | 25.295 ± 1.01 | 9.495 ± 0.201 | 364.027 ± 13.65 | 0.696 ± 0.004 | 1.747 ± 0.029 |
| Pulp | 1.888 ± 0.007 | 1.729 ± 0.023 | 19.242 ± 0.65 | 8.258 ± 0.179 | 150.299 ± 11.78 | 0.058 ± 0.001 | 0.312 ± 0.005 | |
| Peel | 3.674 ± 0.031 | 2.093 ± 0.044 | 39.338 ± 1.34 | 13.247 ± 0.327 | 135.727 ± 13.88 | 1.413 ± 0.002 | 4.722 ± 0.062 | |
| CMO | Core | 4.860 ± 0.056 | 4.196 ± 0.063 | 19.054 ± 0.94 | 20.568 ± 0.584 | 233.094 ± 12.94 | 3.15 ± 0.034 | 3.976 ± 0.043 |
| Pulp | 1.145 ± 0.014 | 0.711 ± 0.007 | 4.220 ± 0.07 | 3.487 ± 0.062 | 125.247 ± 9.32 | 0.167 ± 0.008 | LD | |
| Peel | 2.793 ± 0.023 | 4.507 ± 0.058 | 52.778 ± 1.58 | 17.287 ± 0.667 | 103.697 ± 8.77 | 3.712 ± 0.032 | 6.285 ± 0.051 | |
| GL | Core | 4.789 ± 0.072 | 1.235 ± 0.009 | 29.023 ± 0.457 | 17.104 ± 0.932 | 133.438 ± 3.421 | 1.844 ± 0.033 | 2.441 ± 0.808 |
| Pulp | 3.300 ± 0.039 | 2.395 ± 0.034 | 27.361 ± 0.655 | 10.067 ± 0.546 | 37.031 ± 1.023 | 2.112 ± 0.057 | 1.066 ± 0.993 | |
| Peel | 6.412 ± 0.078 | 6.031 ± 0.088 | 55.240 ± 1.533 | 28.873 ± 0.894 | 61.689 ± 1.967 | 6.937 ± 0.101 | 9.005 ± 0.976 |
Data are presented as mean ± SD of three independent experiments, different letters follow indicate significant differences (P < 0.05). LD: lower than detection limit
Flavanol, dihydrochalcone, and flavonol composition and distribution in core, pulp, and peel of apple fruit (ug/g)
| Variety | Part | Catechin | Epicatechin | Phloretin 2’-O-glucuronide | Phloretin | Quercetin | Quercetin-3-O-rhamnoside | Quercetin-3-O-galactoside | Quercetin-3-O-rutinoside |
|---|---|---|---|---|---|---|---|---|---|
| FS | Core | 11.476 ± 0.057 | 24.164 ± 1.12 | 328.260 ± 3.457 | 2.407 ± 0.087 | 13.152 ± 1.211 | 18.001 ± 1.053 | 71.476 ± 2.331 | LD |
| Pulp | 8.885 ± 0.044 | 28.191 ± 0.93 | 12.451 ± 0.786 | 0.626 ± 0.002 | 1.715 ± 0.033 | 6.826 ± 0.443 | 12.236 ± 1.327 | LD | |
| Peel | 35.044 ± 1.233 | 139.266 ± 5.67 | 61.064 ± 1.003 | 3.591 ± 0.232 | 10.576 ± 0.089 | 18.712 ± 0.321 | 37.161 ± 0.854 | LD | |
| QP | Core | 37.201 ± 1.768 | 91.672 ± 3.82 | 234.08 ± 3.221 | 1.707 ± 0.095 | 5.305 ± 0.096 | 31.266 ± 0.965 | 195.532 ± 3.676 | LD |
| Pulp | 12.478 ± 0.775 | 58.840 ± 1.77 | 11.699 ± 0.078 | 0.518 ± 0.008 | 2.077 ± 0.921 | 12.427 ± 0.883 | 23.779 ± 1.031 | LD | |
| Peel | 15.016 ± 0.853 | 73.534 ± 2.95 | 107.643 ± 2.191 | 3.477 ± 0.021 | 11.610 ± 0.997 | 38.852 ± 1.110 | 61.444 ± 1.221 | LD | |
| HH | Core | 20.822 ± 0.929 | 1.272 ± 0.06 | 481.541 ± 3.889 | 5.298 ± 0.011 | 5.770 ± 0.893 | 23.249 ± 1.091 | 115.748 ± 2.973 | LD |
| Pulp | 17.693 ± 0.893 | 61.041 ± 1.75 | 14.876 ± 0.989 | 1.184 ± 0.006 | 1.651 ± 0.076 | 6.669 ± 0.988 | 23.340 ± 0.965 | LD | |
| Peel | 55.486 ± 2.678 | 193.71 ± 6.89 | 98.484 ± 2.001 | 2.785 ± 0.004 | 8.058 ± 0.93 | 21.116 ± 1.212 | 97.106 ± 2.3332 | LD | |
| QG | Core | 28.184 ± 1.077 | 14.572 ± 2.55 | 522.347 ± 4.878 | 9.765 ± 0.024 | 10.948 ± 0.992 | 44.376 ± 2.331 | 113.691 ± 2.136 | LD |
| Pulp | 15.267 ± 0.436 | 5.796 ± 1.43 | 11.398 ± 0.911 | 4.822 ± 0.021 | 2.281 ± 0.065 | 3.708 ± 0.887 | 17.551 ± 0.981 | LD | |
| Peel | 10.679 ± 0.387 | 18.979 ± 3.87 | 56.608 ± 1.031 | 9.353 ± 0.053 | 13.717 ± 1.001 | 31.132 ± 1.223 | 40.378 ± 0.657 | 32.050 ± 0.881 | |
| JS | Core | 22.144 ± 0.975 | 99.285 ± 2.21 | 749.750 ± 8.997 | 6.455 ± 0.005 | 8.417 ± 0.884 | 23.786 ± 0.999 | 202.443 ± 2.334 | 3.145 ± 0.765 |
| Pulp | 19.930 ± 0.846 | 59.438 ± 1.76 | 40.905 ± 0.932 | 2.712 ± 0.031 | 2.831 ± 0.056 | LD | 30.200 ± 1.001 | LD | |
| Peel | 32.774 ± 1.773 | 126.095 ± 2.10 | 96.038 ± 1.005 | 5.754 ± 0.064 | 18.236 ± 0.108 | 27.091 ± 1.001 | 114.035 ± 5.342 | 4.549 ± 0.876 | |
| CMO | Core | 35.267 ± 1.652 | 70.162 ± 1.98 | 11.433 ± 0.945 | 7.03 ± 0.057 | 7.063 ± 0.230 | 16.199 ± 0.922 | 71.770 ± 2.537 | 4.927 ± 0.342 |
| Pulp | 7.647 ± 0.320 | 28.085 ± 0.97 | 18.643 ± 0.932 | 2.938 ± 0.009 | 2.059 ± 0.107 | 2.740 ± 0.934 | 26.751 ± 0.933 | 0.107 ± 0.002 | |
| Peel | 58.701 ± 2.351 | 165.489 ± 3.54 | 71.681 ± 1.034 | 4.874 ± 0.085 | 31.669 ± 1.336 | LD | 70.359 ± 1.897 | 23.368 ± 0.976 | |
| GL | Core | 26.555 ± 1.112 | 97.293 ± 2.336 | 303.421 ± 3.425 | 7.22 ± 0.032 | 9.216 ± 0.887 | 19.572 ± 0.988 | 136.996 ± 2.365 | 2.074 ± 0.331 |
| Pulp | 31.310 ± 1.973 | 80.697 ± 1.987 | 16.139 ± 0.887 | 3.328 ± 0.009 | 2.278 ± 0.006 | 4.119 ± 0.093 | 28.069 ± 1.021 | LD | |
| Peel | 70.957 ± 3.555 | 197.228 ± 3.354 | 62.385 ± 1.062 | 1.519 ± 0.007 | 125.675 ± 3.576 | 33.988 ± 1.009 | 56.590 ± 2.334 | 25.484 ± 2.101 |
Data are presented as mean ± SD of three independent experiments, different letters follow indicate significant differences (P < 0.05)
Polyphenol composition difference among different apple cultivars is one of the major characteristics for distinguishing varieties, as discussed in previous literature [25]. Given that other components of apple Metabolic profiles differences in peel, pulp, and core of 7 apple varieties were evaluated by multivariate statistics analysis. PCA is a widely used chemometric tool for extracting and rationalizing information from any multivariate description of a biological system, and it is used to reveal the internal structure of several variables by a few principal components [26]. In the PCA plot (Figure 2) the QC samples grouped together, revealing that the QC samples had similar metabolic profiles and the entire analysis was stable and repeatable. PCA analysis indicated that there are 9 components that explained 80% of the total variance upon 10,259 variables. The samples of peel, pulp, and peel part of apple fruit grouped in 3 separate areas in the plot, among which the metabolic profiles of pulp and core were partially overlapped, indicating that peel had notably different metabolic profile from that of pulp and core, while the metabolic profile of the latter two shared some similarities.
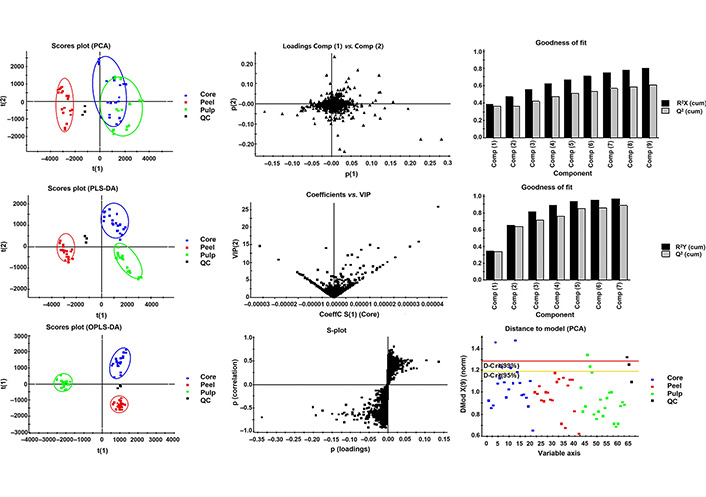
Multivariate modeling of variations using PCA, PLS-DA, and OPLS-DA of peel, pulp, and core of the 7 apple varieties. Score plots of the first t(1) and second t(2) predictive components are illustrated. On the score plot, the percentage of total variation explained by the component is indicated in parentheses. The colored ellipses include 95% of the multivariate normal distribution of the peel, core, and pulp samples respectively. On the loading plots of PCA, the variables with extreme values in each direction of principal component p(1) and p(2) were focused. On the plot of coefficients versus VIP, the variables with VIP value higher than 10 were focused. On the scores plot scatter (S)-plot, the predictive of P value (loadings) in the range of |P| > 0.1 were focused
Partial least-square analysis (PLS-DA) was used to generate pairwise comparisons of the metabolite contributions [27]. In present work, 7 components established for metabolic profile of peel, pulp, and core were compared to identify the metabolites that were responsible for the observed difference. As much as 88% of predictability (Q2) and strong goodness of fit (96%) on R2Y were observed in the PLS-DA models. Thereinto metabolic profiles of peel, pulp, and core were well separated from each other in three quadrants of the rectangular coordinates.
The OPLS-DA extends a regression of the PCA and uses the class membership to maximize the variation and introduce an orthogonal signal correction filter to separately handle the systematic variation correlated to or uncorrelated to the Y variable. Therefore, it has a better discriminant ability for the samples with larger within-class divergence than PCA, as has been illustrated by Bylesjö [28]. In the present study, 5 components were selected for samples from three parts of an apple that were clearly separated in the OPLS-DA score plot. The variance explained R2Y indicating 98% of the variation in the dataset could be modeled by the selected component. The variance prediction Q2 reached 96%, indicating a high goodness of fit.
The metabolomics profile of 7 apple varieties (FS, QG, QP, JS, CMO, HH, GL) were comparatively analyzed (Figure 3). In PCA plot, with 80% variance explanation upon 10,259 variables, 9 components were found. Based on the predictive component 1, t(1) and 2, t(2), HH, GL, and QP were distinctively separated from FS and QG. Besides, CMO and JS showed the most overlap. In PLS-DA modeling, 2 predictive components were established and only 17% variance explanation and 6% variance prediction were found. While 7 apple varieties were grouped into 3 parts on predictive component 1. It suggests the different metabolomic profiles of peel, pulp, and core of GL were different from that of HH and QP, and also that of the rest apple varieties. In respect of OPLS-DA model, there were 5 components, explaining 98% variance and possessing 96% variance prediction between the two groups (one with GL, HH, QP, and the other including FS, QG, JS, CMO), indicating the metabolomics profile difference and relationship among the 7 apple varieties.
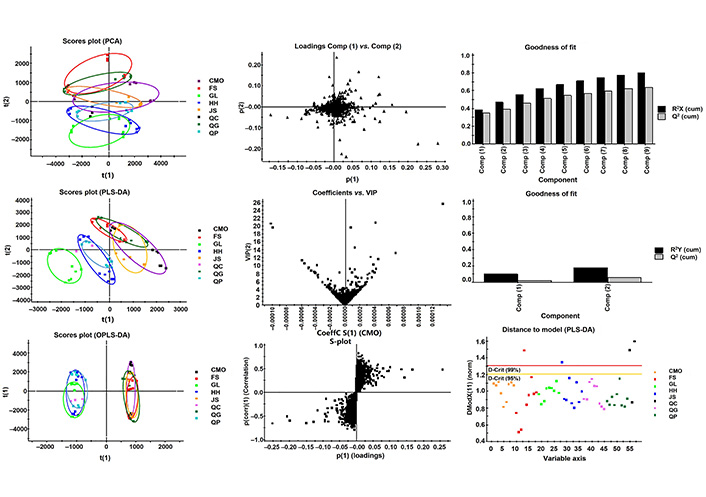
Diagnostic of multivariate modeling (PLS-DA). The diagnostic plot shows the distances within and orthogonal to the selected score plan for PLS modeling
The loading plot (Figure 3) indicated the variables responsible for the difference of the metabolomic profiles of peel, pulp, and core of apple fruit, which contained 27 compounds. The variables’ importance distribution along the PLS regression coefficient showed in the plot of coefficients versus VIP, among which 11 variables that had VIP > 10, coefficient > 0.00005 were investigated. The important variables distribution along the OPLS regression coefficients were displayed in S-plot, in which 9 variables were located at the extreme value in two direction of predictive component 1 (Table 3).
Significant biomarkers for comparing classifiers between three parts of apple fruit
| Compared items | m/z of discriminant features | Retention time (s) | Ion type | Elemental composition (hypothesis) | Tentatively identified compound name | Δppm | score |
|---|---|---|---|---|---|---|---|
| Core/pulp | 539.1381 | 10.78 | [M+Cl]– | C18H32O16 | Maltotriose | –1.55 | 39.5/5.54 |
| 680.6199 | 12.82 | [M-H]– | C42H83NO5 | Cer 18:1;3O/24:0;(2OH) | –0.58 | 31.6/0 | |
| 564.3302 | 11.77 | [M+FA-H]– | C26H50NO7P | 2-Linoleoyllyso phosphatidylcholine | –2.86 | 39.6/9.9 | |
| 463.0891 | 11.93 | [M-H]– | C21H20O12 | Hyperin | 1.59 | 39.1/0 | |
| Core/peel | 505.2558 | 11.84 | [M-H]– | C24H43O9P | LPG 18:3 | 4.74 | 35.7/0 |
| 371.0993 | 1.66 | [M+FA-H]– | C15H18O8 | Melilotoside | 3.70 | 37.9/0 | |
| 623.1625 | 5.22 | [M-H]– | C28H32O16 | Isorhamnetin-3-O-rutinoside | –3.76 | 36.1/0.127 | |
| 625.1416 | 9.89 | [M-H]– | C27H30O17 | Flavonoid glycoside 2: 2-(3,4-dihydroxyphenyl)-5,7-dihydroxy-4-oxo-4H-chromen-3-yl 4-O-hexopyranosylhexopyranoside | 2.61 | 38.3/0.217 | |
| 539.1381 | 9.78 | [M+Cl]– | C18H32O16 | Maltotriose | –1.04 | 34.9/2.95 | |
| 680.6199 | 9.79 | [M-H]– | C42H83NO5 | Cer 18:1;3O/24:0;(2OH) | –1.98 | 34.8/0 | |
| 562.3145 | 9.67 | [M+FA-H]– | C26H48NO7P | LPC 18:3 | –1.07 | 37.7/0 | |
| 609.1474 | 10.53 | [M-H]– | C27H30O16 | Rutin | –0.70 | 41.6/10.7 | |
| Pulp/peel | 609.1469 | 10.41 | [M-H]– | C27H30O16 | Quercetin-3-O-rutinoside | 1.54 | 44/27.8 |
| 471.3482 | 9.63 | [M-H]– | C30H48O4 | Hederagenin | –0.07 | 46.8/39.1 | |
| 819.5268 | 5.44 | [M+HCOO]– | C45H74O10 | DGDG 18:3/18:3 | –3.07 | 35.7/2.47 | |
| 433.1142 | 9.53 | [M-H]– | C21H22O10 | Naringenin-7-O-glucoside | –3.70 | 50/55.4 | |
| 564.3302 | 9.79 | [M+FA-H]– | C26H50NO7P | 2-linoleoyllyso phosphatidylcholine | –3.25 | 38.2/9.48 |
DGDG: digalactodiacylglycerol; LPC: lyso phosphatidylcholine; LPG: lyso phosphatidylglycerol
The significantly different phenolic components between core and pulp were hyperin, there is more hyperin found in core as compared to the pulp. While the melilotoside, isorhamnetin-3-O-rutinoside, flavonoid glycoside, and rutin were the significant different phenols found between core and peel, among which melilotoside and flavonoid glycoside were higher in core than that in peel, isorhamnetin-3-O-rutinoside and rutin were lower in core than that in peel. quercetin-3-O-rutinoside and naringenin-7-O-glucoside were the phenolic compound found different in peel and pulp, in which Quercetin-3-O-rutinoside were more in pulp and naringenin-7-O-glucoside were in peel.
In respect of metabolomics profile difference attributed to apple varieties, the variables located in the area related to the metabolomics profile difference among seven varietals of apple slices on the basis of the loading plot. While the variables’ importance distribution along PLS regression coefficient of CMO, HH, and JS showed that 5 variables had VIP > 1 coefficient > 0.00005. There were 21 important variables distribution along the OPLS regression coefficients as shown in S-plot (Table 4).
Significant biomarkers for comparing classifiers between seven apple varieties
| Compared items | m/z of discriminant features | Retention time (s) | Ion type | Elemental composition (hypothesis) | Tentatively identified compound name | Δppm | Score |
|---|---|---|---|---|---|---|---|
| GL/HH | 335.078 | 1.22 | [M-H-H2O]– | C16H18O9 | 4-O-caffeoylquinic acid | –4.30 | 37.5/6.81 |
| 549.1705 | 6.47 | [M+FA-H]– | C18H32O16 | Maltotriose | –0.64 | 39/15.8 | |
| 721.3654 | 5.00 | [M+FA-H]– | C33H56O14 | DGDG 18:3 | 0.60 | 39.4/0 | |
| 259.0246 | 0.94 | [M-H]– | C6H13O9P | Inositol 4-phosphate | –1.49 | 39.3/0 | |
| GL/QP | 371.0993 | 5.19 | [M+FA-H]– | C15H18O8 | Melilotoside | 4.05 | 37.6/0 |
| 329.1236 | 3.14 | [M+FA-H]– | C14H20O6 | Phenylethyl 2-glucoside | –3.08 | 36.8/0 | |
| 353.0888 | 6.08 | [M-H]– | C16H18O9 | Chlorogenic acid | 4.43 | 37.1/0 | |
| 441.1979 | 3.90 | [M+CHO2]– | C17H32O10 | Hexyl 6-O-pentopyranosylhexopyranoside | –1.43 | 36.6/0 | |
| 285.0413 | 6.33 | [M-H]– | C15H10O6 | Kaempferol | –0.71 | 37.7/0 | |
| 487.3437 | 8.26 | [M-H]– | C30H48O5 | Triterpenoid 1 | 1.50 | 39/0 | |
| 315.051 | 11.21 | [M-H]– | C16H12O7 | Isorhamnetin | 1.52 | 37.7/0 | |
| 177.0551 | 3.29 | [M-H]– | C10H10O3 | Coniferyl aldehyde | 1.67 | 37.6/0 | |
| 802.561 | 4.55 | [M+CHO2]– | C42H80NO8P | Phosphatidylcholine | 3.75 | 37.1/0 | |
| 503.3377 | 8.29 | [M-H]– | C30H48O6 | Triterpenoid 3 | –3.53 | 35.9/0 | |
| 539.1381 | 8.29 | [M+Cl]– | C18H32O16 | Maltotriose | 3.23 | 37.4/0 | |
| GL/FS | 319.0828 | 6.07 | [M-H-H2O]– | C16H18O7 | 4-O-p-coumaroylquinic acid | 2.99 | 38.7/0 |
| 353.0888 | 6.24 | [M-H]– | C16H18O9 | Chlorogenic acid | –0.31 | 39.1/0 | |
| 292.1045 | 6.07 | [M-H]– | C11H19NO8 | N-acetylmuramic acid | –0.94 | 38.1/0 | |
| 819.5268 | 11.75 | [M+HCOO]– | C45H74O10 | MGDG 18:3/18:3 | –3.99 | 37.4/2.84 | |
| 707.1853 | 12.16 | [2M-H]– | C16H18O9 | Neochlorogenic acid | 0.85 | 36.6/0 | |
| GL/QG | 707.1846 | 5.38 | [2M-H]– | C16H18O9 | Chlorogenic acid | –2.99 | 46.7/44.3 |
| 221.0566 | 10.45 | [M+Cl]– | C9H14O4 | 2-(1-hydroxyethyl)-4-(2-hydroxypropyl)-2H-furan-5-one | 4.72 | 39.3/5.43 | |
| 707.1786 | 4.50 | [2M-H]– | C16H18O9 | Neochlorogenic acid | –4.22 | 37.9/4.14 | |
| 425.2031 | 5.01 | [M+Cl]– | C19H34O8 | Terpene glycoside 1: (2R,3R,4S,5S,6R)-2-[6-hydroxy-3-[(E)-3-hydroxybut-1-enyl]-2,4,4-trimethylcyclohexyl]oxy-6-(hydroxymethyl)oxane-3,4,5-triol | –1.12 | 39.8/14.3 | |
| 335.078 | 3.78 | [M-H-H2O]– | C16H18O9 | 4-O-caffeoylquinic acid | –3.66 | 35.7/0.617 | |
| 593.1296 | 4.66 | [M-H]– | C30H26O13 | Flavonoid glycoside 1: [6-[2-(3,4-dihydroxyphenyl)-8-hydroxy-4-oxochromen-7-yl]oxy-3,4,5-trihydroxyoxan-2-yl]methyl (E)-3-(4-hydroxyphenyl)prop-2-enoate | 1.71 | 37.5/0 | |
| 680.6199 | 12.77 | [M-H]– | C42H83NO5 | Cer 18:1;3O/24:0 | 3.52 | 34.4/1.34 | |
| GL/CMO | 471.3482 | 3.21 | [M-H]– | C30H48O4 | Hederagenin | –2.22 | 35.1/0 |
| 505.2558 | 5.60 | [M-H]– | C24H43O9P | LPG 18:3 | 0.90 | 38/3.31 | |
| 503.3377 | 7.94 | [M-H]– | C30H48O6 | Triterpenoid 3 | –0.37 | 36.4/0 | |
| 337.0793 | 5.72 | [M-H]– | C16H18O8 | Gerberinside | –4.35 | 36.6/0 | |
| 477.1605 | 6.17 | [M+FA-H]– | C19H28O11 | (Hydroxymethyl)oxolan-2-yl]oxy-2-(hydroxymethyl)-6-[2-(4-hydroxyphenyl)ethoxy]oxane-3,4-diol | –3.55 | 36/0 | |
| 461.172 | 5.81 | [M-H]– | C19H28O10 | Sayaendoside | –0.05 | 41.8/18.4 | |
| 505.2558 | 6.13 | [M-H]– | C24H43O9P | LPG 18:3 | –0.76 | 38.4/3.72 | |
| 625.1416 | 5.73 | [M-H]– | C27H30O17 | 2-(3,4-dihydroxyphenyl)-5,7-dihydroxy-4-oxo-4H-chromen-3-yl 4-O-hexopyranosylhexopyranoside | –1.40 | 36/2.15 | |
| 609.1469 | 2.03 | [M-H]– | C27H30O16 | Quercetin-3-O-rutinoside | –0.72 | 55/93.9 | |
| 680.6199 | 6.12 | [M-H]– | C42H83NO5 | Cer 18:1;3O/24:0 | –4.96 | 37.8/3.2 | |
| 315.051 | 6.12 | [M-H]– | C16H12O7 | Isorhamnetin | 2.59 | 38.2/4.85 | |
| GL/JS | 721.3654 | 4.51 | [M+FA-H]– | C33H56O14 | DGMG 18:3 | 0.77 | 38.9//0 |
| 819.5268 | 4.89 | [M+HCOO]– | C45H74O10 | MGDG 18:3/18:3 | 3.35 | 37/2.89 | |
| 707.1853 | 5.84 | [2M-H]– | C16H18O9 | Neochlorogenic acid | –3.58 | 37.6/3.66 | |
| 433.1142 | 6.03 | [M-H]– | C21H22O10 | Naringenin-7-O-glucoside | –2.01 | 39.4/5.85 | |
| 593.1521 | 4.67 | [M-H]– | C27H30O15 | Kaempferol-3-O-rutinoside | –2.36 | 38.3/0 | |
| HH/FS | 503.3377 | 5.92 | [M-H]– | C30H48O6 | Triterpenoid 3: (1S,4aR,6aS,6bR,9S,10R,11R,12aR,14bS)-1,10,11-trihydroxy-9-(hydroxymethyl)-2,2,6a,6b,9,12a-hexamethyl-1,3,4,5,6,6a,7,8,8a,10,11,12,13,14b-tetradecahydropicene-4a-carboxylic acid | –1.86 | 39.1/0 |
| 357.1067 | 12.78 | [M-H]– | C12H22O12 | Lactobionic acid | 4.93 | 43.5/40 | |
| 562.3145 | 8.05 | [M+FA-H]– | C26H48NO7P | LPC 18:3 | 0.12 | 39.1/0 | |
| 281.1395 | 3.83 | [M-H]– | C15H22O5 | Alpha hydroxy acid 1: (4E)-8-hydroxy-4-(1-hydroxypropan-2-ylidene)-10-oxatricyclo[7.2.1.01,5]dodecane-8-carboxylic acid | –1.30 | 38.3/0 | |
| 441.1979 | 12.78 | [M+CHO2]– | C17H32O10 | Hexyl 6-O-pentopyranosylhexopyranoside | –0.70 | 40.7/21.6 | |
| 415.1613 | 4.51 | [M-H]– | C19H28O10 | Sayaendoside | 0.81 | 38.5/0 | |
| HH/QG | 625.1416 | 12.14 | [M-H]– | C27H30O17 | Flavonoid glycoside 2: 2-(3,4-dihydroxyphenyl)-5,7-dihydroxy-4-oxo-4H-chromen-3-yl 4-O-hexopyranosylhexopyranoside | 2.10 | 40.1/9.94 |
| 707.1853 | 3.77 | [2M-H]– | C16H18O9 | Neochlorogenic acid | –3.01 | 36.3/4.58 | |
| 477.1045 | 5.86 | [M-H]– | C22H22O12 | Isorhamnetin-3-O-glucoside | 4.89 | 38.8/4.38 | |
| 721.3654 | 4.64 | [M+FA-H]– | C33H56O14 | DGMG 18:3 | 1.91 | 38.6/0 | |
| HH/JS | 819.5268 | 12.62 | [M+HCOO]– | C33H56O14 | MGDG 18:3/18:3 | 0.39 | 37.3/0 |
| HH/CMO | 203.0827 | 2.63 | [M-H]– | C11H12N2O2 | Tryptophan | 2.52 | 37.8/0 |
| 341.1112 | 6.78 | [M-H]– | C12H22O11 | Trehalose | 0.36 | 37.6/1.59 | |
| QP/ FS | 625.1416 | 3.43 | [M-H]– | C27H30O17 | Flavonoid glycoside 2: 2-(3,4-dihydroxyphenyl)-5,7-dihydroxy-4-oxo-4H-chromen-3-yl 4-O-hexopyranosylhexopyranoside | 0.18 | 38/0 |
| 383.1107 | 5.25 | 383.1107 | C6H12N2O3S | (2S)-2-(carbamoylamino)-4-(methylsulfanyl)butanoic acid | 2.06 | 38.6/1.05 | |
| 609.1469 | 5.27 | [M-H]– | C27H30O16 | Quercetin-3-O-rutinoside | 0.60 | 39.3/0 | |
| 295.2278 | 2.16 | [M-H]– | C18H32O3 | 9-hydroxy-10E,12Z-octadecadienoic acid | 3.44 | 37.3/0 | |
| 358.1162 | 8.11 | [M+CHO2]– | C14H19NO7 | (2R)-2-(β-D-glucopyranosyloxy)-2-phenylacetamide | –0.92 | 38.7/0 | |
| QP/QG | 387.1167 | 4.49 | [M+FA-H]– | C12H22O11 | Trehalose | 2.02 | 36.8/0 |
| 477.1045 | 7.29 | [M-H]– | C22H22O12 | Isorhamnetin-3-O-glucoside | 3.29 | 38.3/8.99 | |
| QP/JS | 564.3302 | 6.43 | [M+FA-H]– | C26H50NO7P | 2-linoleoyllyso phosphatidylcholine | –0.02 | 39.2/0 |
| QP/CMO | 255.0665 | 4.91 | [M-H]– | C15H12O4 | 5,7-dihydroxyflavanone | –4.83 | 37.6/0 |
| 539.1381 | 4.91 | [M+Cl]– | C18H32O16 | Maltotriose | 0.77 | 39/0 |
MGDG: monogalactosyldiacylglycerol
The remarkable phenolic compound to differentiate GL and HH was 4-O-caffeoylquinic acid, in which GL possessed higher this specific phenol. Melilotoside, Chlorogenic acid, kaempferol, isorhamnetin were the significant phenols to differentiate the GL and QP, and only kaempferol was found higher in QP than in GL. 4-O-p-coumaroylquinic acid, chlorogenic acid, neochlorogenic acid showed different in GL and FS, in which neochlorogenic acid was higher in FS. Similarly, chlorogenic acid, neochlorogenic acid, 4-O-caffeoylquinic acid, and flavonoid glycoside were significant different in GL and QG, and only flavonoid glycoside was remarkably higher in QG than GL. Moreover, isorhamnetin was the significant phenolic compounds to distinguish GL and CMO. Whereas polyphenol could not necessarily differentiate all the apple varieties, which is closely dependent on the apple varieties.
Polyphenols are important characteristic components in apple fruit [29, 30]. In this study, different phenolic compounds in apple peel, pulp, and core of seven varieties were qualified and quantified. Chlorogenic acid was the most abundant component (21.49–389.68 μg/g FW) in core section of QG, JS, CMO, QP, FS, GL, and HH apple varieties, accounting for 33.94%, 23.89%, 45.46%, 24.26%, 24.14%, 16.84% and 3.08% of total phenolic content respectively. Chlorogenic acid content in pulp was in the range of 25.37–215.06 μg/g FW, accounting for 14.86–75.47% of total polyphenol content. While in peel section, chlorogenic acid was fall into the scope of 16.80–234.57 μg/g FW, and accounting for 4.51–50.08% of total polyphenols. Besides, neochlorogenic acid, caffeic acid, gallic acid, protocatechuic acid, p-coumaric acid, ferulic acid occupied 0.63–5.00%, 0.23–10.97%, 0.03–1.52%, 0.28–1.83%, 0–0.93%, 0.08–1.38% of total polyphenol content in respective part of apple. There are significant varietal differences of phenolic acid (P < 0.05) observed in both peel, pulp, and core. And the levels of phenolic acids were generally higher in the pulp than that in apple peel and core (in fresh weight) of 7 apple varieties.
Catechin and epicatechin as representative flavanols showed significantly different (P < 0.05) distribution in peel, pulp, and core of 7 apple varieties [26]. Catechin was in the range of 11.48–37.20 μg/g FW in apple core, 7.64–31.31 μg/g FW in pulp, and 15.02–70.95 in peel, accounting for 1.45–6.88%, 3.41–12.56%, 2.28–9.51% of the total polyphenol content in core, pulp, and peel respectively. While epicatechin was in the level of 1.27–99.28 μg/g FW in core, 5.79–80.70 μg/g FW in pulp, and 18.98–197.23 μg/g FW in peel, accounting for 0.18–13.68%, 2.03–35.52%, 4.05–32.96% of the total polyphenol content in core, pulp and peel respectively.
Phloretin and its glucuronic acid conjugates phloretin-2’-O-glucuronide as the typical dihydrochalcones were evaluated their distribution in core, pulp and peel of 7 different apple varieties [30, 31]. Phloretin level was 1.71–9.76 μg/g FW in core, 0.52–4.82 μg/g FW in pulp, and 1.52–9.35 μg/g FW in peel, accounting for 0.19–1.37%, 0.27–1.33%, 0.19–2.00% of the total polyphenol content in core, pulp, and peel. Whereas phloretin-2’-O-glucuronide content was significantly higher than that of phloretin (P < 0.05), falling in the range of 11.433–749.75 μg/g FW in core, 11.40–40.91 μg/g FW in pulp, 56.61–107.64 μg/g FW in peel, accounting for 2.23–69.01%, 4.00–12.11%, 8.34–28.90% of the total polyphenol content in core, pulp, and peel respectively.
As to flavonols, quercetin, quercetin-3-O-rhamnoside, quercetin-3-O-galactoside, quercetin-3-O-rutinoside were comparatively assessed [32]. Thereinto, quercetin-3-O-galactoside content was in the range of 71.48–202.44 μg/g FW in apple core, 12.24–30.20 μg/g FW in apple pulp, and 37.16–114.04 μg/g FW in apple peel, accounting for 9.90–22.19%, 6.15–13.58%, 7.56–18.25% of the total polyphenol content in core, pulp and peel respectively. Moreover, quercetin-3-O-galactoside level were significantly higher (P < 0.05) than that of quercetin-3-O-rhamnoside, quercetin, and quercetin-3-O-rutinoside.
So far, there were about 40 different phenolic acids in apple have been identified, including 8 hydroxybenzoic acids, 11 hydroxycinnamic acids, 5 hydroxyphenylacetic acids, and 1 hydoxyphenylpropanoic acid. With exception of chlorogenic and caffeic acid, methyl gallate, ethyl gallate, hydroxy phenyl acetic acid, three phenylacetic acid isomers, 3-(4-hydroxyphenyl) propionic acid, and homoveratric acid [22].
The metabolic profile variation within peel, pulp, and core were remarkably decreased, while the phenolic dispersion was in a descending order in core, pulp, and peel of apple. It indicates that the core is more likely to determine the difference of apple variety. This result could help instruct the apple variety distinguish by precisely located the sampling position in apple fruit. Moreover, the results revealed that metabolic profile in different part of apple fruit is different, among which polyphenolic metabolites made significant contributions. However, polyphenol is the important secondary metabolites that responding to the external stimuli, such as cold, hot, physical injury, insect, chemicals, etc. Therefore, specific polyphenol accumulation will vary according to several factors including the planting area, climate, soil agronomic method. Polyphenol profile is relatively stable, and just like the finger print for different apple varieties, especially the polyphenol profile in core part of the apple fruit, which could be the superior target for apple varieties distinguish.
Present study investigated the polyphenols spatial distribution in apple fruit, within which the correlation of the polyphenol distribution difference and the apple varieties character difference were found. The characteristic components of apple peel, pulp, and core were extracted and compared across different apple varieties. The result concluded that the phloretin were the dominant component in core, chlorogenic acid was the main phenolic compounds in pulp, and quercetin was mainly found in apple peel. The less varied of polyphenol in core of the apple is likely to be the main factor that determines the difference in apple variety. The work would like to provide an insight to distinguish the apple by the characteristic biomarker distributed in different part of fruit. In future research, it is crucial to develop more precise techniques for identifying biomarkers and establish more comprehensive and structured methodologies.
CMO: Changmiou
FS: Fuji
FW: fresh weight
GL: Gala
HH: Huahong
HPLC: high-performance liquid chromatography
JS: Jinshuai
LC-Q-TOF-MS: liquid chromatography quadrupole-time of flight mass spectrometry
OPLS-DA: orthogonal partial least squares discriminant analysis
PCA: principal component analysis
PLS-DA: partial least-squares discriminant analysis
QC: quality control
QG: Qinguan
QP: Qingping
XL, JXH and WYW: Conceptualization, Investigation, Writing—original draft, Writing—review & editing. JB: Validation, Writing—review & editing, Supervision. All authors read and approved the submitted version.
The authors declare that they have no conflicts of interest.
Not applicable.
Not applicable.
Not applicable.
Not applicable.
This work is funded by China Agricultural Research system [CARS-27], and the earmarked fund for the National Natural Science Foundation of China, “Mechanism study of polyphenol-pectin interaction on the oxidation characteristics of polyphenols in dried apple storage process [31901714]” The funders had no role in study design, data collection and analysis, decision to publish, or preparation of the manuscript.
© The Author(s) 2023.
Copyright: © The Author(s) 2023. This is an Open Access article licensed under a Creative Commons Attribution 4.0 International License (https://creativecommons.org/licenses/by/4.0/), which permits unrestricted use, sharing, adaptation, distribution and reproduction in any medium or format, for any purpose, even commercially, as long as you give appropriate credit to the original author(s) and the source, provide a link to the Creative Commons license, and indicate if changes were made.