Original Article

Affiliation:
1Food Science and Technology Program, School of Industrial Technology, Faculty of Applied Sciences, Universiti Teknologi MARA, Shah Alam 40450, Malaysia
Affiliation:
1Food Science and Technology Program, School of Industrial Technology, Faculty of Applied Sciences, Universiti Teknologi MARA, Shah Alam 40450, Malaysia
Affiliation:
2Faculty of Pharmacy and Health Sciences, Royal College of Medicine Perak, Universiti Kuala Lumpur, Ipoh 30450, Malaysia
ORCID: https://orcid.org/0000-0002-6740-0530
Affiliation:
3Department of Food Science and Nutrition, Faculty of Agriculture, Jerash University, Jerash 26250, Jordan
4College of Health Sciences, QU Health, Qatar University, Doha 2713, Qatar
ORCID: https://orcid.org/0000-0001-9031-5441
Affiliation:
5DKSH Performance Materials Malaysia Sdn Bhd, Petaling Jaya 47301, Malaysia
Affiliation:
1Food Science and Technology Program, School of Industrial Technology, Faculty of Applied Sciences, Universiti Teknologi MARA, Shah Alam 40450, Malaysia
6Food Science Research Group, Faculty of Applied Sciences, Universiti Teknologi MARA, Shah Alam 40450, Malaysia
7Integrative Pharmacogenomics Institute (iPROMISE), Universiti Teknologi MARA, Selangor Branch, Bandar Puncak Alam 42300, Malaysia
8Integrated Nutrition Science and Therapy Research Group (INSPiRE), Faculty of Health Sciences, Universiti Teknologi MARA, Selangor Branch, Bandar Puncak Alam 42300, Malaysia
Email: ekseow@uitm.edu.my
ORCID: https://orcid.org/0000-0001-8913-0781
Explor Foods Foodomics. 2026;4:1010129 DOI: https://doi.org/10.37349/eff.2026.1010129
Received: November 06, 2025 Accepted: February 26, 2026 Published: March 30, 2026
Academic Editor: Gökhan Zengin, Selcuk University, Turkey
Aim: The rising consumption of convenience foods has increased demand for nutritionally balanced snacks such as granola bars. Traditional formulations rely on sugar as a binder, which may raise health concerns. This study investigates the use of fructo-oligosaccharides (FOS), a low-calorie prebiotic sweetener, as a substitute for glucose syrup to enhance the nutritional quality of granola bars.
Methods: Five granola bars with different formulations were prepared by replacing sugar with FOS at varying substitution levels (0%, 25%, 50%, 75%, and 100%). The bars were evaluated for proximate composition, physicochemical properties (colour, pH, water activity, and texture), and sensory attributes.
Results: Increasing FOS levels significantly increased moisture and fiber content, while moderately reducing sugar, fat, and energy values. Higher FOS incorporation also slightly increased pH, reduced water activity, and produced lighter and less yellow bars. Sensory evaluation indicated that all formulations were acceptable, with the 75% FOS formulation receiving the highest preference scores.
Conclusions: The results from this study suggest that FOS syrup is an effective alternative to glucose syrup in granola bars, enhancing nutritional value without compromising sensory quality. Partial substitution (up to 75%) optimizes consumer acceptability while providing a functional, low-calorie, and fiber-enriched snack option.
Prebiotics are indigestible food components that selectively stimulate the growth and activity of beneficial gut bacteria, contributing to improved digestive health, immune regulation, and overall well-being [1, 2]. Moreover, prebiotics regulate the immune system, adding another layer of importance to their inclusion in everyday diets. Integrating prebiotics into commonly consumed foods has become a strategic approach to enhance public health. Among the various prebiotic-enriched foods, granola bars have gained significant popularity. Granola bars, typically made from dry ingredients such as oats, wheat, seeds, nuts, or dried fruits combined with a binder, have become increasingly popular as a nutritious snack or quick meal due to their balanced nutritional value [3, 4]. Their nutritional profile and sensory attributes, including texture and taste, can be modulated by adjusting ingredient composition, particularly the type and concentration of sweeteners, as well as dietary fibers.
In today’s food industry, it has become increasingly common to find numerous food products, especially ready-to-eat (RTE) meals or snacks, that contain high levels of added sugar. Excessive consumption of added sugars in processed foods, including conventional granola bars, is a significant contributor to metabolic disorders such as obesity, type 2 diabetes, and cardiovascular disease [5]. This has prompted the exploration of alternative sweeteners that reduce caloric content while maintaining desirable sensory and functional properties. Fructo-oligosaccharides (FOS) are prebiotic carbohydrates that are not digested in the upper gastrointestinal tract and reach the colon, where they selectively stimulate beneficial gut bacteria. In addition to their prebiotic effect, FOS reduces caloric intake, enhances mineral absorption, and supports digestive health [6–8]. Substituting glucose syrup with FOS in granola bars is expected to reduce sugar content, increase fiber intake, and provide functional health benefits without compromising sensory quality. Although FOS is already used in commercial products, scientific studies that systematically assess its impact on granola bar formulations across multiple concentrations are still limited.
Recent studies have highlighted the importance of evaluating functional bar formulations using an integrated approach. Misra et al. [9–11] demonstrated that microencapsulation of bioactive compounds such as probiotics and γ-aminobutyric acid (GABA) significantly influenced nutritional, physicochemical, and textural properties in functional bar matrices. Similarly, incorporation of erythritol into multigrain formulations was shown to improve physicochemical and functional properties while maintaining storage stability Misra et al. [12, 13]. Studies by Megala and Hymavathi TV [14] and Nowicka et al. [15] have also explored the FOS incorporation into fruit-based bars and snacks with positive effects on nutritional quality and consumer acceptance. These findings underscore the potential of systematically optimizing functional ingredients to enhance both health-promoting properties and consumer acceptability.
Building upon these findings, this study aims to fill the gap by investigating the effects of replacing glucose syrup with FOS at different concentrations (25–100%) on granola bars’ composition, sugar content, texture, and sensory attributes. By combining proximate analysis, sugar concentration quantification, texture profile analysis, and consumer sensory evaluation, the study provides a comprehensive assessment of how prebiotic enrichment affects both functionality and acceptability. The novelty of this work lies in its integrated approach, which simultaneously evaluates the nutritional (proximate), physicochemical, and sensory characteristics of granola bars with varying FOS levels. These insights are intended to guide evidence-based formulation strategies for developing functional, prebiotic-enriched granola bars that meet both consumer expectations and nutritional guidelines.
Different types of raw materials are used to prepare the granola bar. FOS was sponsored by a local ingredient supplier (DKSH, Selangor, Malaysia) in the form of powder. The other ingredients, such as rolled oats, puffed rice, pumpkin seeds, chia seeds, peanuts, almonds, glucose syrup, raisins, olive oil, and brown sugar, were purchased from the local market.
Absolute alcohol (Sigma-Aldrich, USA), petroleum ether (Merck, Germany), concentrated sulphuric acid (H2SO4, 95–98%; Merck, Germany), catalyst tablet (potassium sulphate and selenium; Merck, Germany), 50% sodium hydroxide (NaOH, Sigma-Aldrich, USA), 2% boric acid (Sigma-Aldrich, USA), 0.1 M methyl red (Sigma-Aldrich, USA), 0.255 N H2SO4 (Merck, Germany), 0.313 N NaOH (Sigma-Aldrich, USA), 1% hydrochloric acid (HCl, Sigma-Aldrich, USA), Fehling’s A solution and Fehling’s B solution (Merck, Germany), methylene blue indicator solution (Sigma-Aldrich, USA), invert sugar standard solution (Sigma-Aldrich, USA).
About 200 g of FOS powder was placed in 280 mL of water. This solution was warmed slowly over low heat until the mixture became slightly thicker. This solution was stirred continuously to prevent the coagulation of the FOS [16].
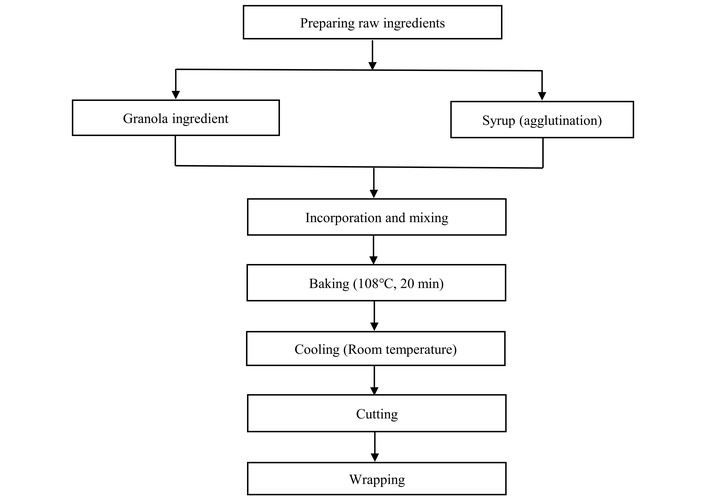
The bars were prepared according to the following steps, as shown in Figure 1. The ingredients were selected based on their functional roles and nutritional contribution. Rolled oats and puffed rice provided structure, complex carbohydrates, and desirable texture. Nuts and seeds (almonds, peanuts, chia seeds, pumpkin seeds) contributed protein, healthy fats, and dietary fiber, while raisins added natural sweetness. Glucose syrup acted as a binder and sweetener in the control formulation, and FOS syrup was included in varying amounts to assess its prebiotic effect. Olive oil improved mouthfeel and binding, and vanilla essence and salt enhanced flavour and balance.
Dry ingredients were added separately before mixing and nuts were crushed for uniformity. For agglutination of granolas, the slurry was prepared in a stainless-steel container, where the ingredients (vanilla flavour, salt, glucose syrup, and olive oil) were heated and mixed with dry ingredients until a uniform mixture was obtained. The mixture was deposited in the mold, compacted with a roller, and baked at 108°C for approximately 20 min until golden. After cooling, bars were cut and stored at room temperature for three days to stabilize chemical reactions and ingredient properties. Five formulations were prepared as shown in Figure 2, with the control (F0) prepared according to de Carvalho et al. [17] without FOS syrup (Table 1).
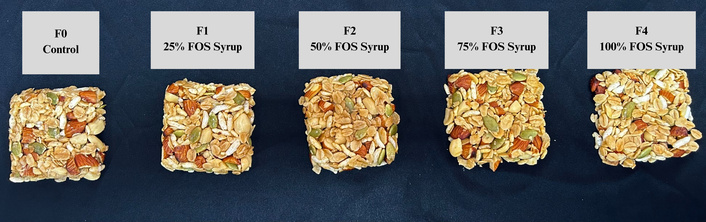
Representative appearance of granola bars prepared with different formulations (F0–F4) under standardized conditions. This figure illustrates the overall product appearance, whereas quantitative physical and texture characteristics are presented in the corresponding tables. FOS: fructo-oligosaccharides.
Formulation of granola bars [17].
| Ingredients | Formulation (g) | ||||
|---|---|---|---|---|---|
| F0 | F1 | F2 | F3 | F4 | |
| Salt | 4 | 4 | 4 | 4 | 4 |
| Olive oil | 20 | 20 | 20 | 20 | 20 |
| Almonds | 64 | 64 | 64 | 64 | 64 |
| Glucose syrup | 50 | 37.5 | 25 | 12.5 | – |
| FOS | – | 12.5 | 25 | 37.5 | 50 |
| Vanilla essence | 6 | 6 | 6 | 6 | 6 |
| Peanuts | 55 | 55 | 55 | 55 | 55 |
| Puffed rice | 18 | 18 | 18 | 18 | 18 |
| Rolled oat | 60 | 60 | 60 | 60 | 60 |
| Pumpkin seed | 17 | 17 | 17 | 17 | 17 |
The addition of FOS syrup was based on the % w/w of the total weight of ingredients. F0: granola bar with 100% glucose syrup (control—without addition of FOS syrup); F1: granola bar with 75% glucose syrup 25% FOS syrup; F2: granola bar with 50% glucose syrup 50% FOS syrup; F3: granola bar with 25% glucose syrup 75% FOS syrup; F4: granola bar with 100% FOS syrup. FOS: fructo-oligosaccharides.
Six analyses were conducted to determine the proximate analysis in the granola bar sample, namely, moisture, fat, protein, ash, crude fiber, and carbohydrate content. The granola bar was evaluated for its physicochemical features in triplicate (n = 3).
Moisture content was determined using the Association of Official Analytical Chemists (AOAC) hot air oven method [18]. Approximately 5 g of the homogenized sample was weighed into a pre-dried aluminium dish and dried at 105°C until a constant weight was achieved. After cooling in a desiccator, the moisture content was calculated using Equation 1:
Where, all weights are expressed in g.
Ash content was determined following the AOAC dry ashing method [18]. About 5 g of sample was dried, charred, and incinerated in a muffle furnace at 550°C until light grey ash was obtained. The ash content was calculated after cooling in a desiccator using Equation 2.
The crude fiber content was determined following the acid and alkali digestion method of AOAC [18]. Approximately 3 g of dried sample was sequentially digested with 0.255 N H2SO4 and 0.313 N NaOH under reflux conditions. The residue was dried, weighed, ignited at 550°C and reweighed. Crude fibre content was calculated using Equation 3:
Where, W1 = weight of sample (g), W2 = weight of crucible + dried residue (g), W3 = weight of crucible + ash (g).
The fat content was determined using the Soxhlet extraction method as described in AOAC [18]. Approximately 2 g of dried sample was extracted with petroleum ether for 8 h. After solvent evaporation, the extracted fat was dried at 100°C, cooled in a desiccator, and weighed. Fat content was calculated using Equation 4.
Where, weight of fat in sample = (weight of flask + fat) – weight of flask.
The protein content was determined using the Kjeldahl method following the AOAC procedures [18] using a protein analyzer. Approximately 1 g of sample was digested with concentrated H2SO4 and a catalyst mixture, followed by distillation and titration with 0.1 M HCl. Nitrogen content was calculated using Equation 5 and protein content was obtained by applying a conversion factor of 6.25 in Equation 6:
Where, conc. represents the concentration of the standard acid solution, and std acid refers to the standard acid used in the titration.
Total carbohydrate content was evaluated according to the difference method of AOAC [18] by subtracting the percentage of moisture, fat, protein, ash, and crude fiber. The percentage of total carbohydrate by difference was calculated using Equation 7.
Energy content was determined using an energy conversion factor. Total calories (kcal) were calculated based on 100 g samples using the Atwater values for fat (9.00 kcal/g), protein (4.02 kcal/g), and carbohydrates (3.87 kcal/g).
Sugar concentration was determined using the Lane and Eynon titration method following the AOAC Official Method 923.09, 2005 guideline [19]. All titrations were performed in triplicate.
Granola bar extraction: Approximately 5 g of granola bar was homogenized and extracted with Milli-Q water to a final volume of 100 mL. The extract was filtered and sugar analysis was conducted on the aqueous phase. Therefore, results are expressed as sugar concentration in the extract solution.
Determination of initial reducing sugar concentration: Reducing sugar concentration was determined by titrating appropriately diluted sample extract against boiling Fehling’s A and B solutions using methylene blue as an indicator. The endpoint was identified by the disappearance of the blue colour, yielding a brick-red precipitate.
Total sugar concentration analysis: An aliquot of the sample extract was hydrolyzed with concentrated HCl at 68°C for 30 min to convert sucrose into reducing sugars. The hydrolyzed solution was neutralized, diluted, and titrated following the same procedure for reducing sugars.
Standardization of sucrose solution: Standardization of sucrose solution was performed by preparing a 10% invert sugar solution adjusted to pH 8.0. It was titrated with 10 mL of boiling Fehling’s A and B solutions using 1% methylene blue as an indicator. The endpoint was defined by the disappearance of the blue colour (brick-red precipitate). Blank titrations were conducted without sample hydrolysis. All titrations were performed in triplicate and the mean value was used for calculations.
Method validation and quality control: Recovery tests were performed by spiking three sample extracts with known amounts of invert sugar and sucrose. Sugar concentrations were calculated using the dextrose factor equation (Equation 8).
Where the concentration of the standard sucrose = A mg/mL. Required volume of hydrolyzed standard sucrose solution to titrate with Fehling’s A and B = B mL. Calculated dextrose factor = (A × B) mg. Dextrose factor from table = C mg. Correction factor = (A × B) – C mg. Required volume of sample to titrate with Fehling’s A and B = D mL. Dextrose factor of sample from table = E mg.
The colour of the granola bar samples was measured using a Minolta Chromameter CR 400 (Minolta, Osaka, Japan). Colour parameters were recorded as L* (lightness), a* (green to red), and b* (blue to yellow). The instrument was calibrated using a white standard tile before each use. Samples were spread evenly on a plastic microbiological plate, and empty spaces were covered to ensure accurate reading. Measurements were taken at three random locations per sample and the mean values were used for statistical analysis.
The pH value of the sample was determined using a HANNA instrument pH meter calibrated with pH 4 and pH 8 buffer solutions. Ten g of the sample were homogenized with 100 mL of distilled water prior to measurement.
Water activity (aw) was measured using an AquaLab™ CX-2T water activity meter at 25.0 ± 0.3°C. Samples were homogenized in a porcelain mortar before analysis. Each measurement was repeated three times, and the mean value was used for statistical analysis [20].
The texture of the granola bars was assessed using a texture profile analysis (TPA) with a Texture Analyser TA-XT2i (Stable Micro Systems, UK) equipped with a 3-point bending rig. Sample dimensions were measured using a vernier caliper (width = 3 cm, thickness = 1 cm) before analysis. Each granola formulation was tested in triplicate. Bars were placed right-side up on the rig supports and compressed with a cylindrical probe (diameter = 1.2 cm) at a trigger force of 25 g. Pre- and post-test speeds were 10 mm/s, with a compression distance of 35 mm and a dwell time of 3 s. Instrument calibration was performed according to the manufacturer’s instructions before each session. Force-time curves were generated and textural parameters including hardness, fracturability, chewiness, springiness, and cohesiveness, were calculated using the instrument software.
Sensory evaluation of the granola bars was conducted with 30 untrained and semi-trained panellists (students from UiTM Shah Alam, aged 20–25 years). Samples were cut into 1.5 × 1.5 × 1 cm pieces and coded with a randomized three-digit number to ensure blinding. Panellists evaluated seven attributes, which are taste, odour, colour, texture, crispiness, appearance, and overall acceptability using a 7-point hedonic scale (1 = “dislike extremely”, 7 = “like extremely”). To minimize order and carry-over effects, samples were presented in a randomized order and panellists evaluated them from left to right while rinsing their mouths with mineral water between samples. Prior to testing, panellists received a brief orientation on the evaluation procedure to ensure consistent understanding.
The data were analyzed using Statistical Package Social Sciences (SPSS) version 26. One-way analysis of variance (ANOVA) and Tukey’s HSD post-hoc test were used to compare for any significant differences between samples. The mean and standard deviation were expressed as the values of different parameters. Differences were considered significant at p < 0.05. All analyses were carried out in triplicate.
Proximate composition and sugar content of the granola bar formulations (F0–F4) are presented in Table 2. Significant differences (p < 0.05) were observed among formulations for all measured parameters. Moisture content increased from 5.05% in the control (F0) to 6.25% in F4. Ash content ranged from 0.92% to 1.29%, showing minor variation among samples. Fat content decreased significantly from 18.25% (F0) to 15.61% (F4), while protein content increased from 8.26% to 11.01%. A significant increase in crude fiber was observed with increasing FOS substitution, ranging from 3.22% (F0) to 6.16% (F4). Conversely, carbohydrate content decreased from 64.12% to 59.90%. Correspondingly, the energy value declined from 453.77 kcal/100 g in F0 to 424.13 kcal/100 g in F4.
Proximate and sugar analyses of granola bar samples.
| Analysis | Formulation | ||||
|---|---|---|---|---|---|
| F0 | F1 | F2 | F3 | F4 | |
| Moisture (%) | 5.05d ± 0.06 | 5.17d ± 0.07 | 5.73c ± 0.08 | 6.05b ± 0.12 | 6.25a ± 0.02 |
| Ash (%) | 1.10b ± 0.13 | 1.13b ± 0.14 | 1.29a ± 0.13 | 0.92c ± 0.14 | 1.07b ± 0.15 |
| Fat (%) | 18.25a ± 0.24 | 17.39b ± 0.35 | 17.04b ± 0.10 | 15.80c ± 0.19 | 15.61c ± 0.26 |
| Crude fiber (%) | 3.22e ± 0.14 | 4.47d ± 0.16 | 5.47c ± 0.18 | 5.83b ± 0.18 | 6.16a ± 0.16 |
| Protein (%) | 8.26c ± 0.53 | 9.97b ± 0.41 | 10.25a ± 0.15 | 10.71a ± 0.24 | 11.01a ± 0.12 |
| Carbohydrate (%) | 64.12a ± 0.59 | 61.87b ± 0.42 | 60.22c ± 0.34 | 60.69c ± 0.39 | 59.90c ± 0.55 |
| Energy (kcal/100 g) | 453.77a ± 0.54 | 443.87b ± 0.39 | 436.14b ± 0.41 | 427.80c ± 0.69 | 424.13c ± 0.81 |
| Sugar concentration in extract (g/100 mL) | 211.15a ± 17.30 | 173.05ab ± 11.45 | 169.29b ± 11.18 | 163.66b ± 20.72 | 158.96b ± 9.87 |
Data are presented as mean ± SD of three independent replicates. One-way ANOVA followed by Tukey’s HSD post-hoc test was used to determine significant differences among samples (p < 0.05). Means with different superscript letters in the same row indicate statistically significant differences. F0—control, F1—25% FOS, F2—50% FOS, F3—75% FOS, F4—100% FOS. ANOVA: analysis of variance; HSD: honestly significant difference; FOS: fructo-oligosaccharides.
Total sugar concentration of the granola bars also varied significantly among formulations (Table 2). The control (F0) exhibited the highest sugar level (211.15 g/100 mL), while the FOS-based formulation (F4) exhibited the lowest (158.96 g/100 mL). A decreasing trend in sugar concentration was observed as FOS concentration increased, showing reductions of approximately 15–25% compared with the control. Among the FOS-containing formulations (F1–F4), no significant differences (p > 0.05) were detected among formulations beyond 50% FOS (F2–F4).
Four main physicochemical parameters were analyzed: colour, pH, aw, and texture profile. The colour composition, pH, and aw of the granola bar formulations (F0–F4) are presented in Table 3, while texture profile parameters are shown in Table 4.
Colour composition, pH value, and water activity (aw) of granola bar samples.
| Formulation | Colour composition | pH value | aw | ||
|---|---|---|---|---|---|
| L* | a* | b* | |||
| F0 | 44.86e ± 0.119 | 12.46a ± 0.046 | 25.75a ± 0.015 | 6.10b ± 0.010 | 0.359a ± 0.002 |
| F1 | 50.21d ± 0.006 | 1.36c ± 0.040 | 19.08b ± 0.029 | 6.10b ± 0.010 | 0.315b ± 0.006 |
| F2 | 51.50c ± 0.006 | 2.61b ± 0.038 | 18.97c ± 0.015 | 6.10b ± 0.010 | 0.292c ± 0.005 |
| F3 | 52.30b ± 0.010 | 2.67b ± 0.032 | 18.56d ± 0.035 | 6.10b ± 0.010 | 0.280d ± 0.005 |
| F4 | 59.47a ± 0.012 | 1.34c ± 0.023 | 17.38e ± 0.015 | 6.15a ± 0.060 | 0.218e ± 0.004 |
Data are presented as mean ± SD of three independent replicates. One-way ANOVA followed by Tukey’s HSD post-hoc test was used to determine significant differences among samples (p < 0.05). Means with different superscript letters in the same columns indicate statistically significant differences. F0—control, F1—25% FOS, F2—50% FOS, F3—75% FOS, F4—100% FOS. ANOVA: analysis of variance; HSD: honestly significant difference; FOS: fructo-oligosaccharides.
Texture profile analysis parameters of granola bars.
| Parameters | Formulation | ||||
|---|---|---|---|---|---|
| F0 | F1 | F2 | F3 | F4 | |
| Fracturability (g) | 9,364.45e ± 2.83 | 15,529.96d ± 7.44 | 24,578.50b ± 5.06 | 18,835.21c ± 4.29 | 30,629.21a ± 2.61 |
| Springiness | 0.13e ± 0.02 | 0.23d ± 0.01 | 0.31a ± 0.02 | 0.25c ± 0.03 | 0.28b ± 0.05 |
| Cohesiveness | 0.06d ± 0.02 | 0.14b ± 0.01 | 0.10c ± 0.00 | 0.11bc ± 0.01 | 0.14a ± 0.01 |
| Chewiness (g) | 517.28c ± 0.76 | 767.12b ± 0.83 | 843.81a ± 0.85 | 489.88d ± 0.62 | 389.02e ± 0.61 |
| Hardness (g) | 10,033.68e ± 7.87 | 16,943.24d ± 6.02 | 24,435.80a ± 4.22 | 18,973.46c ± 8.72 | 20,817.49b ± 5.67 |
Data are presented as mean ± SD of three independent replicates. One-way ANOVA followed by Tukey’s HSD post-hoc test was used to determine significant differences among samples (p < 0.05). Means with different superscript letters in the same row indicate statistically significant differences. F0—control, F1—25% FOS, F2—50% FOS, F3—75% FOS, F4—100% FOS. ANOVA: analysis of variance; HSD: honestly significant difference; FOS: fructo-oligosaccharides.
As shown in Table 3, significant differences (p < 0.05) were observed among formulations for all colour parameters. The L* value (lightness) increased gradually from 44.86 in the control (F0) to 59.47 in F4. In contrast, the a* value (redness) decreased from 12.46 in F0 to 1.34 in F4, while the b* value (yellowness) declined from 25.75 to 17.38 across formulations.
Meanwhile, the pH values of the granola bars ranged from 6.10 to 6.15. No significant differences (p > 0.05) were observed among formulations except for F4 with a slightly higher pH value.
In terms of aw, the values ranged from 0.218 to 0.359 and decreased consistently with increasing FOS substitution. The control (F0) exhibited the highest aw (0.359), while F4 recorded the lowest (0.218).
Texture profile analysis revealed significant variations (p < 0.05) among formulations for all measured parameters (Table 4). Hardness increased from 10,033.68 g (F0) to 20,817.49 g (F4) while fracturability increased from 9,364.45 g to 30,629.21 g. Springiness values increased from 0.13 in F0 to a maximum of 0.31 in F2, with slight variations in F3 and F4 with FOS substitution. Cohesiveness ranged from 0.06 to 0.14, showing no consistent trend across formulations. Chewiness values were highest in F2 (843.81 g) and lowest in F4 (389.02 g).
Overall, substitution of glucose syrup with FOS resulted in significant changes in colour attributes, aw, and textural properties of the granola bars.
The sensory evaluation of granola bar formulations (F0–F4) was conducted using a 7-point hedonic scale for taste, odour, colour, texture, crispiness, appearance, and overall acceptability. The mean scores are presented in Table 5.
Sensory evaluation of granola bars.
| Attributes | Formulation | ||||
|---|---|---|---|---|---|
| F0 | F1 | F2 | F3 | F4 | |
| Taste | 5.23ab ± 0.92 | 5.13b ± 0.89 | 5.26ab ± 1.03 | 5.81a ± 0.83 | 5.00b ± 1.09 |
| Odour | 5.39a ± 0.80 | 5.32a ± 0.90 | 5.13a ± 1.02 | 5.42a ± 0.99 | 5.23a ± 0.81 |
| Colour | 5.45ab ± 0.77 | 5.29b ± 0.74 | 5.29b ± 0.73 | 5.84a ± 0.82 | 5.23b ± 0.76 |
| Texture | 5.39ab ± 0.88 | 5.23b ± 0.76 | 5.52ab ± 1.02 | 5.97a ± 1.01 | 5.29b ± 1.03 |
| Crispiness | 5.42ab ± 0.96 | 5.06b ± 1.03 | 5.61ab ± 0.91 | 6.03a ± 0.86 | 5.13b ± 1.12 |
| Appearance | 5.81a ± 0.75 | 5.55a ± 0.89 | 5.65a ± 0.76 | 6.03a ± 0.75 | 5.55a ± 0.77 |
| Overall acceptability | 5.52ab ± 0.72 | 5.32b ± 0.87 | 5.52ab ± 0.77 | 6.06a ± 0.81 | 5.26b ± 0.86 |
Data are presented as mean ± SD of three independent replicates. One-way ANOVA followed by Tukey’s HSD post-hoc test was used to determine significant differences among samples (p < 0.05). Means with different superscript letters in the same row indicate statistically significant differences. F0—control, F1—25% FOS, F2—50% FOS, F3—75% FOS, F4—100% FOS. ANOVA: analysis of variance; HSD: honestly significant difference; FOS: fructo-oligosaccharides.
Scores for taste ranged from 5.00 to 5.81, with formulation F3 (75% FOS) obtaining the highest mean value and showing significant differences (p < 0.05) compared to F1 and F4. Odour scores did not differ significantly among formulations (p > 0.05), indicating minimal influence of FOS substitution on aroma perception. For colour, F3 exhibited the highest mean score (5.84), which was comparable to the control (F0). Texture scores ranged from 5.23 to 5.97, with F3 again achieving the highest value and no significant difference from the control. Crispiness scores showed significant differences (p < 0.05), with F3 obtaining the highest score (6.03), while appearance scores did not differ significantly among samples. Overall acceptability scores ranged from 5.26 to 6.06, with F3 being the most preferred formulation, followed by the control (F0). All formulations achieved mean scores above 5.0, indicating general consumer acceptance.
The increase in moisture content with higher FOS substitution is attributed to the hygroscopic nature of FOS which possesses multiple hydroxyl groups capable of forming hydrogen bonds with water molecules. Consequently, FOS enhances the water-binding capacity of the granola matrix, contributing to improved softness and pliability. Similar increases in moisture content have been reported in FOS-enriched cereal bars and prebiotic snack formulations, where FOS and related oligosaccharides improved water-binding capacity and textural freshness [21–23]. However, excessive moisture may negatively affect shelf stability by promoting stickiness and microbial growth. Therefore, maintaining moisture at moderate levels is essential when optimizing FOS levels during formulation.
Ash content showed only minor variation among formulations, suggesting that FOS substitution had minimal impact on the mineral composition of the granola bars. The observed values are consistent with those reported for cereal and granola-based products, where ash content is primarily influenced by raw ingredients such as cereals, nuts, and dried fruits rather than sweetener type [24, 25]. These findings indicate that replacing glucose syrup with FOS does not substantially alter the mineral contribution of the product.
The significant increase in crude fiber with increasing FOS levels reflects the contribution of FOS as a soluble, fermentable fiber [26]. In addition to increasing total fiber content, FOS may interact synergistically with insoluble fibers from oats and nuts, enhancing the functional fiber profile of the bars. Comparable fiber enrichment has been reported in FOS- and inulin-fortified cereal bars and bakery products [27–31]. This supports the use of FOS as both a sweetener and functional fiber ingredient in snack formulations.
A reduction in fat content was observed with increasing FOS substitution. This reduction is explained by the lipid-free nature of FOS, which partially replaces glucose syrup, a component that helps in emulsifying and binding fats within the matrix. The substitution likely disrupted fat entrapment and led to lower overall lipid retention. Similar reductions in fat content have been reported in granola and cereal bars formulated with prebiotic ingredients such as FOS and inulin [23, 32]. Reducing fat is desirable not only to lower total energy but also to improve oxidative stability by minimizing lipid oxidation during storage. However, excessive fat reduction could compromise the mouthfeel and cohesion of the product, suggesting that formulation optimization is important to maintain palatability.
The observed increase in protein content with higher FOS incorporation is primarily due to a relative concentration effect, as carbohydrate-based syrup was replaced while protein-rich ingredients increased. FOS may also promote mild protein-carbohydrate interactions during processing, improving matrix integrity. Comparable increases in protein proportion also have been reported in fiber-enriched snack bars and FOS-fortified food products [26, 33, 34]. These studies suggested that enhanced protein content contributes to improved nutritional density and may support satiety.
Carbohydrate content decreased slightly with increasing FOS substitution, reflecting the partial replacement of glucose syrup, which is a major contributor to rapidly digestible carbohydrates in cereal bars. Similar trends have been reported in granola and cereal-based products formulated with prebiotic sweeteners [24, 26, 32]. These findings show that the reduction in available carbohydrates may contribute to improved glycemic properties of the product.
The decrease in total energy value with increasing FOS substitution corresponds to reductions in fat and digestible carbohydrate content, as well as the lower metabolizable energy of FOS (≈ 1.5 kcal/g) compared to glucose (≈ 4 kcal/g). Similar decreases in energy value were reported by Hartmann et al. [34] in FOS-enriched meat products (hamburgers) and Nadeem et al. [27] in prebiotic fruit bars. The reduction in caloric density indicates that replacing glucose syrup with FOS can effectively reduce energy content while maintaining nutritional quality.
The total sugar concentration in the extracts decreased significantly with increasing FOS substitution, consistent with the replacement of glucose syrup by FOS which has lower sweetness intensity, limited digestibility, and a low glycemic index [35]. Previous studies have demonstrated that partial replacement of conventional sugars with FOS can reduce sugar concentration without adversely affecting product quality in baked goods, dairy products, and snack foods [33, 36–38]. The present findings confirm that FOS is effective in lowering sugar concentration in granola bars while maintaining overall product acceptability and nutritional enhancement through increased fiber content. These findings also suggest that FOS may act as a valuable ingredient in developing functional foods that cater to health-conscious consumers.
The significant increase in L* values with higher FOS levels indicates the production of lighter-coloured granola bars (Table 3). This effect is primarily attributed to the reduced intensity of Maillard reactions during baking, as FOS provides fewer reducing sugars than glucose syrup. Similar observations were reported by Ramli et al. [39] who observed lighter colour tones in dark chocolate formulated with Nypa fruticans sugar substitute due to suppressed non-enzymatic browning.
The decrease in both a* and b* values further supports the reduced formation of brown pigments such as melanoidins during thermal processing. Comparable trends were also observed by Pallavi et al. [23] and Nadeem et al. [27], who reported that prebiotic syrups yielded lighter colour and improved visual appeal in cereal and fruit bars. These findings suggest that FOS substitution effectively modulates browning reactions, resulting in visually lighter products.
The incorporation of FOS did not have a significant impact on the pH values of the granola bars, as formulations F1, F2, and F3 exhibited values comparable to the control (F0). A slight but significant increase was observed in F4 (100% FOS), with a pH of 6.15. Nevertheless, all formulations remained within the pH range reported for FOS-enriched products (5.98–6.06) by Hartmann et al. [34]. Moreover, FOS is known to be stable across typical food pH ranges (4.0–7.0), indicating that its incorporation does not compromise pH stability [40].
aw values decreased significantly (p < 0.05) with increasing FOS substitution, ranging from 0.359 in F0 to 0.218 in F4. This reduction suggests that FOS limits the availability of free water within the product matrix. The lowest aw observed in F4 indicates a reduced potential for microbial growth. Souiy et al. [41] reported aw values between 0.45 and 0.53 for gluten-free and sugar-free energy bars, while Sánchez-Maldonado et al. [42] classified foods with aw < 0.85 as low-moisture foods. Accordingly, all granola bar formulations in this study can be categorized as low-moisture products, which do not require refrigeration for microbial stability.
Texture results revealed increased hardness and fracturability with higher FOS incorporation. This trend is consistent with the reduced fat content observed in the proximate analysis, as lower fat levels promote stronger inter-particle bonding and a denser product structure. Hartmann et al. [34] observed similar effects in FOS-fortified low-fat meat products.
The irregular variation in cohesiveness and chewiness may be attributed to the heterogeneous particle distribution and differences in syrup viscosity. FOS syrup is generally less viscous than glucose syrup, which can lead to firmer but less cohesive matrices [26, 33]. Comparable hardness and chewiness values were reported by Austina Ribanar and Hemalatha [43] in snack bars, supporting that the textural properties obtained in this study fall within acceptable ranges for consumer products.
Overall, increasing FOS levels produced granola bars with greater structural rigidity, reduced stickiness, and acceptable texture suitable for consumer acceptance.
The sensory results indicate that granola bars containing moderate levels of FOS (particularly F3, 75% substitution) achieved the most favourable scores across nearly all attributes. This suggests that partial replacement of glucose syrup with FOS can enhance consumer perception when an optimal balance of sweetness, texture, and moisture is maintained. Similar trends were reported by Ramli et al. [39], where partial replacement of sucrose with Nypa fruticans syrup preserved desirable sensory characteristics in dark chocolate formulations.
In contrast, complete substitution with FOS (F4) resulted in slightly lower preference scores for taste and crispiness, likely due to reduced sweetness intensity and binding capacity. Similar findings were reported by Krasina et al. [30], who found that excessive FOS incorporation may negatively affect palatability, whereas partial replacement maintained acceptable sweetness and texture in fiber-enriched snack bars. The absence of significant differences in odour among formulations suggests that FOS has minimal aromatic contribution, consistent with findings by Dutcosky et al. [44], who observed that prebiotic syrups do not introduce strong volatile compounds in cereal-based products and primarily influence physical attributes like texture. The study showed that even at high levels, these prebiotic syrups were well-accepted by consumers and primarily modified the mouthfeel and appearance rather than introducing strong or “off” volatile compounds.
Colour perception by panellists aligned with instrumental measurements, as the lighter appearance associated with higher FOS levels remained within an acceptable sensory range. This indicates that reduced Maillard browning did not adversely influence visual appeal. Texture preference for F3 reflects an optimal balance between hardness and cohesiveness. Although instrumental results indicated increased hardness at higher FOS levels, these changes were not perceived negatively by panellists up to 75% substitution. This aligns with Megala and Hymavathi [14] and Nowicka et al. [15], who found that FOS-enriched snack bars remained texturally acceptable despite increased firmness when moisture content was adequately controlled.
Crispiness and overall appearance were also most favoured in F3, possibly due to improved structural uniformity and reduced stickiness. According to Dai et al. [45], FOS can stabilize moisture migration within food matrices, contributing to improved product integrity and reduced tackiness. Overall acceptability scores exceeding 5.0 across all formulations indicate good consumer acceptance and are comparable to values reported by Hartmann et al. [34] for FOS-based bakery snacks.
Overall, this study demonstrates the feasibility of using fructooligosaccharide (FOS) syrup as a functional alternative to glucose syrup in granola bar formulations. Partial substitution of glucose syrup with FOS, particularly at a 75% replacement level, provided the most favourable balance between nutritional improvement, physicochemical stability, and sensory acceptance. The incorporation of FOS contributed to reduced aw and controlled sweetness while maintaining acceptable texture and appearance, which are critical quality attributes for shelf-stable snack products. These findings highlight the potential of FOS as a sugar-reducing ingredient for the development of nutritionally enhanced granola bars without compromising consumer acceptability. Further formulation optimization may improve the performance of fully substituted systems.
AOAC: Association of Official Analytical Chemists
aw: water activity
FOS: fructo-oligosaccharides
H2SO4: sulphuric acid
HCl: hydrochloric acid
NaOH: sodium hydroxide
The authors wish to thank the Faculty of Applied Sciences, Universiti Teknologi MARA, especially the laboratory assistants, for their excellent assistance in making this research a success. The authors are grateful for the sponsorship of ingredients by DKSH Performance Materials Malaysia Sdn. Bhd. in this research.
NMF: Writing—original draft, Data curation. RYMN: Writing—review & editing, Formal analysis. LJS: Writing—review & editing, Validation, Software, Methodology. MA: Writing—review & editing, Formal analysis. NAAR: Methodology, Conceptualization. EKS: Writing—review & editing, Validation, Supervision, Project administration, Methodology, Formal analysis, Conceptualization. All authors read and approved the submitted version.
The authors declare that they have no conflicts of interest.
The sensory evaluation involved adult human participants and was conducted in accordance with standard ethical principles for minimal-risk sensory studies. Formal ethical approval was exempted according to the Faculty Ethics Review Committee (FERC), Faculty of Applied Sciences, Universiti Teknologi MARA (UiTM) as the study was conducted during the COVID-19 period when institutional ethics committee review was not mandatory for this type of sensory evaluation.
Informed consent to participation in the study was obtained from all participants.
Not applicable.
The data that support the findings of this study are available from the corresponding author upon reasonable request.
Not applicable.
© The Author(s) 2026.
Open Exploration maintains a neutral stance on jurisdictional claims in published institutional affiliations and maps. All opinions expressed in this article are the personal views of the author(s) and do not represent the stance of the editorial team or the publisher.
Copyright: © The Author(s) 2026. This is an Open Access article licensed under a Creative Commons Attribution 4.0 International License (https://creativecommons.org/licenses/by/4.0/), which permits unrestricted use, sharing, adaptation, distribution and reproduction in any medium or format, for any purpose, even commercially, as long as you give appropriate credit to the original author(s) and the source, provide a link to the Creative Commons license, and indicate if changes were made.

View: 3253
Download: 104
Times Cited: 0