 Systematic Review

Affiliation:
1Department of Cardiovascular Medicine, University of Iowa Hospitals and Clinics, Iowa City, IA 52242, USA
Email: mubariz-hassan@uiowa.edu; mubariz07@gmail.com
ORCID: https://orcid.org/0009-0005-5996-8045
Affiliation:
1Department of Cardiovascular Medicine, University of Iowa Hospitals and Clinics, Iowa City, IA 52242, USA
Affiliation:
1Department of Cardiovascular Medicine, University of Iowa Hospitals and Clinics, Iowa City, IA 52242, USA
ORCID: https://orcid.org/0009-0007-7335-6349
Affiliation:
2Department of Cardiology, St. Joseph Medical University Center, Paterson, NJ 07503, USA
Affiliation:
1Department of Cardiovascular Medicine, University of Iowa Hospitals and Clinics, Iowa City, IA 52242, USA
ORCID: https://orcid.org/0000-0001-6405-3820
Affiliation:
3Department of Cardiothoracic Radiology, University of Iowa Hospitals and Clinics, Iowa City, IA 52242, USA
ORCID: https://orcid.org/0000-0001-8871-7476
Affiliation:
3Department of Cardiothoracic Radiology, University of Iowa Hospitals and Clinics, Iowa City, IA 52242, USA
ORCID: https://orcid.org/0000-0002-0983-1930
Affiliation:
1Department of Cardiovascular Medicine, University of Iowa Hospitals and Clinics, Iowa City, IA 52242, USA
ORCID: https://orcid.org/0000-0003-4674-6337
Affiliation:
4Cardiology Division, Department of Medicine, Johns Hopkins Hospital, Baltimore, MD 21287, USA
Affiliation:
1Department of Cardiovascular Medicine, University of Iowa Hospitals and Clinics, Iowa City, IA 52242, USA
ORCID: https://orcid.org/0000-0002-7996-3584
Explor Cardiol. 2025;3:101278 DOI: https://doi.org/10.37349/ec.2025.101278
Received: August 13, 2025 Accepted: September 29, 2025 Published: October 23, 2025
Academic Editor: Gaetano Nucifora, University Hospital of South Manchester NHS Foundation Trust, United Kingdom
Background: Cardiac computed tomography (CT) has evolved from an anatomic test to a platform that quantifies functional, inflammatory, and tissue-characterization biomarkers. We synthesized evidence on the diagnostic and prognostic value of CT-based biomarkers.
Methods: Systematic review of 29 human studies (2015–2025) appraising low-attenuation plaque (LAP), perivascular fat attenuation index (FAI/PCAT), total/non-calcified plaque burden, epicardial adipose tissue, CT-derived fractional flow reserve (FFR-CT), and CT myocardial perfusion. Study quality was assessed with risk of bias (RoB) 2.0, Newcastle-Ottawa Scale (NOS), and AMSTAR 2.
Results: CT biomarkers extended risk assessment beyond stenosis severity. LAP burden > 4% predicted myocardial infarction (MI) [hazard ratio (HR) 4.65; 95% CI 2.06–10.5] and per-doubling LAP predicted MI (HR 1.60; 95% CI 1.10–2.34). Perivascular FAI/PCAT showed independent prognostic value: high FAI was associated with ~2-fold higher cardiac mortality (derivation HR 2.15, validation HR 2.06), and RCA PCAT ≥ −70.5 Hounsfield unit (HU) predicted MI (HR 2.45) with additive risk when combined with high-risk plaque (HRP) features (reported up to ~6-fold vs. reference). FFR-CT achieved up to 81% diagnostic accuracy (sensitivity ~86%, specificity ~79%) vs. invasive FFR, improving specificity over CTA alone. Emerging metrics (e.g., total plaque volume, CT perfusion) demonstrated incremental discrimination in selected cohorts, though standardization remains variable.
Discussion: CT-based biomarkers provide measurable diagnostic and prognostic information on coronary anatomy, function, inflammation, and tissue health. Priorities include standardized acquisition/analysis, multicenter validation, and integration into decision pathways to optimize individualized risk stratification and therapy.
Cardiovascular disease (CVD) remains the leading global cause of morbidity and mortality, with coronary artery disease (CAD) as its most prevalent and clinically impactful manifestation [1]. While conventional coronary angiography and stress testing have long focused on detecting flow-limiting stenoses, it is now recognized that a substantial proportion of adverse cardiovascular events, including myocardial infarction (MI) and sudden cardiac death (SCD), arise from non-obstructive or biologically vulnerable plaques [2, 3]. This shift in understanding has intensified interest in imaging biomarkers capable of capturing the functional, inflammatory, and biological dimensions of atherosclerosis, beyond the limitations of anatomic narrowing alone [4].
Cardiac computed tomography (CT), particularly coronary CT angiography (CCTA), has rapidly advanced as a multiparametric tool for the noninvasive evaluation of CAD [5]. Recent innovations in spatial resolution, image reconstruction, and computational modeling now allow for the identification of high-risk plaque (HRP) features, quantification of total and non-calcified plaque burden (NCPB), assessment of vascular inflammation via perivascular fat attenuation index (FAI), and functional evaluation using CT-derived fractional flow reserve (FFR-CT) and CT myocardial perfusion (CTP) [6]. Notably, CT perfusion has also emerged as a valuable modality for the assessment of microvascular dysfunction, further broadening the scope of cardiac CT beyond large-vessel stenosis [7].
Emerging approaches such as tissue characterization and delayed enhancement imaging by CT, while not yet standard in clinical practice, offer additional promise for the identification of myocardial scar and fibrosis, reflecting the field’s rapid evolution toward comprehensive cardiovascular phenotyping [6]. Despite accumulating evidence and expanding applications, clinical adoption of many advanced CT biomarkers remains limited due to heterogeneity in study design, variability in biomarker definitions, and the lack of standardized protocols or guideline integration.
In this review, we systematically evaluate the current landscape of cardiac CT biomarkers, incorporating twenty-nine high-quality studies published between 2015 and 2025 [1–29]. We examine their diagnostic and prognostic value, methodological strengths and limitations, and the potential for integration into modern clinical workflows. Particular attention is paid to advances in functional, inflammatory, and tissue-based imaging, as well as the ongoing challenges and future directions required for widespread adoption.
We conducted a systematic review in accordance with the Preferred Reporting Items for Systematic Reviews and Meta-Analyses (PRISMA) guidelines, searching PubMed (MEDLINE) and Scopus for studies published from January 1, 2015, to April 15, 2025. The search strategy included controlled vocabulary and free-text terms related to CVD, cardiac CT, imaging biomarkers, plaque characteristics, perivascular fat, CT perfusion, and clinical outcomes. All records were exported and de-duplicated in EndNote 20.x using automated duplicate detection (Author, Year, Title) followed by manual confirmation. A second pass for duplicates was performed within Rayyan before screening. In total, 75 duplicates were removed. Our search strategy was designed following the PRISMA guidelines [30].
What emerging cardiac CT imaging biomarkers are associated with CVD assessment and prognosis?
What is the diagnostic and prognostic utility of these biomarkers?
What are the current gaps and future directions for clinical application?
Studies were eligible if they were:
Original human research evaluating cardiac CT imaging biomarkers, review articles, or editorials providing significant methodological frameworks or consensus recommendations relevant to cardiac CT biomarkers.
Assessed diagnostic or prognostic cardiovascular outcomes.
Published in English from 2015 to 2025.
Exclusion criteria were:
Animal studies, case reports, and opinion pieces.
Studies not focused on cardiac CT biomarkers.
Articles without original data or methodological/conceptual relevance.
For each included study, two reviewers independently extracted study design, population characteristics, imaging biomarkers, cardiovascular endpoints, effect measures [e.g., hazard ratios (HRs), odds ratios (ORs), area under the curve (AUC), sensitivity, specificity], follow-up duration, and key findings. Effect measures were extracted as reported by the original studies, with no statistical transformation. For review articles and editorials, methodological or conceptual contributions were recorded; these articles were not subject to a formal risk of bias (RoB) assessment but were noted separately in the synthesis.
The quality of original research was assessed using Cochrane RoB 2.0 for randomized controlled trials (RCTs), Newcastle-Ottawa Scale (NOS) for cohort studies and AMSTAR 2 for systematic reviews/meta-analyses. Only studies with a low RoB or NOS ≥ 5 were included. Because the cardiac CT biomarker literature is nascent and heterogeneous across designs and analytic methods, we a priori set an inclusion threshold of NOS ≥ 5 to avoid excluding informative moderate-quality studies [e.g., early reports on FAI, low-attenuation plaque (LAP), FFR-CT/CTP, radiomics]. To mitigate potential bias from including NOS 5–6 studies, we:
graded quality transparently (NOS 5–6 = moderate, 7–9 = high);
conducted sensitivity analyses restricted to NOS ≥ 7;
used random-effects models and explored study quality as a moderator;
interpreted effects conservatively where the RoB could not be excluded.
Full results are mentioned in Table S1.
Given the heterogeneity of study designs and outcomes, a narrative synthesis was performed. Where possible, commonly reported effect measures were summarized in tabular form. Certainty of evidence for key clinical outcomes [major adverse cardiac events (MACE), MI, mortality, ischemia detection] was evaluated using the GRADE approach (see Table S2).
Data harmonization was performed to address variability in biomarker definitions and missing data across studies. Due to significant heterogeneity in study designs and outcomes, no meta-analysis, subgroup analyses, or sensitivity analyses were conducted. A formal assessment of publication bias was not performed. Additionally, this review was not prospectively registered.
A total of 2,452 records were initially identified. After applying automated filters to limit studies to human subjects, English-language publications, and years 2015–2025, 1,880 records remained. Following removal of 75 duplicates, 1,805 unique articles were screened by title and abstract, with 1,600 excluded for not meeting inclusion criteria based on population, imaging modality, or relevance to cardiac CT biomarkers.
The remaining 205 full-text articles were reviewed for eligibility. Of these, 176 articles were excluded due to ineligible population (n = 95), inappropriate imaging modality (n = 65), expert opinions or narrative reviews (n = 7), and absence of cardiac CT biomarker focus (n = 9). Ultimately, 29 studies were included in the final systematic review. The study selection process is illustrated in the PRISMA flow diagram (Figure 1).
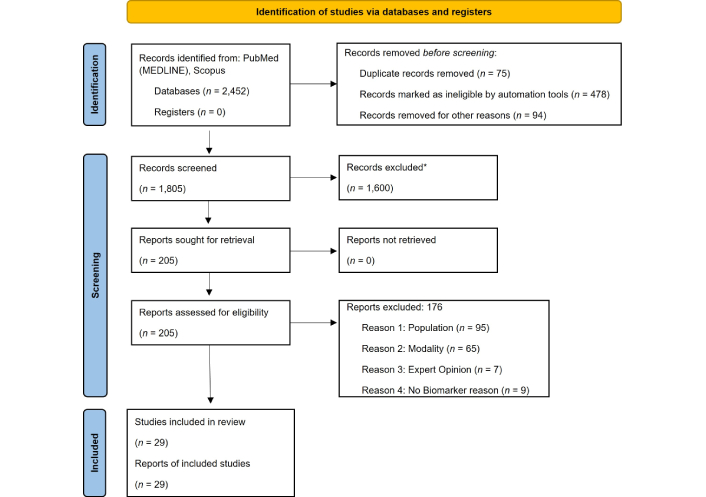
PRISMA flow diagram of selected studies. * Rayyan was used to organize references; all screening decisions were made manually. Adapted from [30]. © Author(s) (or their employer(s)) 2019. CC BY. PRISMA: Preferred Reporting Items for Systematic Reviews and Meta-Analyses.
To enhance interpretability, we present findings by biomarker and outcome (diagnostic accuracy vs. prognostic value), using representative quantitative anchors and directing detailed estimates to Table 1 (summary), Table S3 (study-level data) and Table S4 (definitions/cut-offs).
Summary of biomarkers, outcomes, and effect measures.
| Author | Year | Biomarker(s) assessed | Outcomes evaluated | Included in systematic review | Effective measures reported |
|---|---|---|---|---|---|
| Nakahara et al. [1] | 2017 | Coronary artery calcification (CAC) | Cardiovascular events, risk stratification | Yes | CAC (Agatston score): independent predictor of future cardiac events; reclassified risk beyond Framingham; significant utility in asymptomatic intermediate-risk individuals. |
| Budoff et al. [2] | 2016 | CT plaque metrics | Hemodynamic lesion significance | Yes | Sensitivity 79–88%, specificity 55–63%AUC 0.75–0.77 for CTA vs. invasive FFR |
| Faulder et al. [3] | 2024 | CT-derived fractional flow reserve (FFR-CT) | Agreement with invasive FFR | Yes | Spearman r = 0.67; diagnostic accuracy 82.2% (sensitivity 80.9%, specificity 83.1%); accuracy ≥ 90% when FFR-CT > 0.90 or < 0.49, but drops to 54–87% in the intermediate range (0.74–0.82). |
| Channon et al. [4] | 2022 | Perivascular fat attenuation, plaque features | CAD risk stratification | No | Narrative review: no quantitative effect size reported; describes qualitative associations between perivascular fat attenuation, plaque characteristics, and CAD risk stratification. |
| Cundari et al. [5] | 2024 | EAT, FAI, LAP, FFR-CT | MACE, ischemia, mortality | Yes | OR 1.5–2.3; AUC 0.76–0.88 |
| Schuijf et al. [6] | 2020 | CT perfusion, plaque features | INOCA diagnosis | Yes | Prevalence: 8% (31/381) had CT-defined INOCA; compared to those without ischemia, INOCA patients had higher total atheroma volume (118 mm³ vs. 60 mm³, P = 0.008), more positive remodeling (13% vs. 1%, P = 0.006), and increased LAP volume (20 mm³ vs. 10 mm³, P = 0.007). |
| Lima and Schuijf [7] | 2020 | CT perfusion, scar imaging | CAD risk phenotyping | No | Expert narrative: no quantitative effect size reported; highlights potential prognostic value of combining CT perfusion and scar imaging for CAD risk assessment. |
| Williams et al. [8] | 2020 | LAP | MI | Yes | Adjusted HR 1.60 (1.10–2.34) per doubling of LAP burden; > 4% burden → HR 4.65 (2.06–10.50); strongest predictor of MI. |
| Klüner et al. [9] | 2021 | FAI | CV risk stratification | Yes | Reported HRs for elevated FAI vs. low FAI/no HRP (e.g., HR ~6.26 for adjusted cardiac risk in FAI-high/HRP group vs. FAI-low/HRP-negative); also described improvements in risk discrimination (e.g., AUC gains) when adding FAI beyond standard risk markers. |
| Rajiah et al. [10] | 2022 | FFR-CT | Clinical integration/interpretation | Yes | Reports diagnostic thresholds (FFR-CT > 0.80 normal; 0.76–0.80 borderline; ≤ 0.75 abnormal), discusses increased specificity of CTA when FFR-CT is used, and clinical decision-making implications (ICA vs. medical management). |
| Nørgaard et al. [11] | 2019 | FFR-CT | Diagnostic workflow | Yes | Consensus-based diagnostic algorithms and reporting standards for FFR-CT interpretation. |
| Manubolu et al. [12] | 2024 | EAT | Plaque burden | Yes | Mean density: 77.2 ± 4.6 HU & volume 118.5 ± 41.2 cm³; each +1 HU in EAT density → +7% fibrous-fatty plaque (P < 0.03); no association with EAT volume. |
| Gallone et al. [13] | 2023 | HRP features | MACE | Yes | OR 1.6–2.5; AUC up to 0.83 |
| Nørgaard et al. [14] | 2022 | FFR-CT | MACE prognosis | Yes | Meta-analysis of 5 studies (5,460 patients): FFR-CT ≤ 0.80 vs. > 0.80 RR = 2.31 (95% CI 1.29–4.13, P = 0.005); every −0.10-unit FFR-CT → RR = 1.67 (95% CI 1.47–1.87, P < 0.001). |
| Mathew et al. [15] | 2018 | FFR-CT | Guidance in angiography | Yes | Reports increased specificity of FFR-CT vs. CTA for detecting hemodynamically significant lesions; FFR-CT considered cost-effective as a gatekeeper to invasive angiography. |
| Schuijf et al. [16] | 2018 | FFR-CT, perfusion | Clinical utility of cardiac FFR-CT | Yes | Diagnostic accuracy of FFR-CT and CTP imaging (sensitivity, specificity) compared to invasive FFR; describes thresholds for functional ischemia; discusses incremental benefit beyond CTA. |
| Kimura et al. [17] | 2015 | FFR-CT cost metrics | Cost analysis | No | Cost per patient; no OR/HR. Economical Model on cost effectiveness. |
| Yu et al. [18] | 2025 | FAI | MACE in young patients | Yes | HR 2.37 (95% CI 1.38–4.07) |
| van der Bijl et al. [19] | 2022 | PAT attenuation | Diagnostic/prognostic roles | No | Describes how PCAT attenuation has shown associations with CAD risk and outcomes and emphasizes its potential prognostic implications. |
| Deseive et al. [20] | 2018 | LAP volume | Cardiac events | Yes | HR 2.3 (95% CI 1.4–3.7) |
| Yamaura et al. [21] | 2022 | LAP burden | Predictors in asymptomatic patients | Yes | Percent LAP independently predicted cardiac events: HR 3.05 (95% CI 1.09–8.54, P = 0.033); AUC improved from 0.637 (CACS) to 0.728 with CACS + EAT (P = 0.013). |
| Antoniades and Shirodaria [22] | 2019 | Perivascular fat maps | Coronary inflammation | No | Diagnostic performance (sensitivity, specificity) of FAI in detecting coronary inflammation. |
| Abdulkareem et al. [23] | 2022 | EAT via AI | Imaging quantification | Yes | Reports high accuracy for CT slice classification (~98%) and segmentation (Dice ~0.84), with strong correlation (r ≈ 0.97) between automated and manual measures for both EAT volume and attenuation. |
| Oikonomou et al. [24] | 2019 | CT inflammation markers | Plaque prognosis | No | Describes diagnostic accuracy metrics for plaque morphology; prognostic associations (mortality) for FAI in cited cohorts; improved model discrimination when CT biomarkers are added. |
| Vecsey-Nagy et al. [25] | 2024 | LAP burden | CAD risk evaluation | Yes | OR 1.62 per doubling of LAP burden for hscTnI ≥ 5 ng/L (95% CI 1.17–2.32, P = 0.005); adjusted OR 1.57 (1.07–2.37, P = 0.026). Mediation analysis linking LAP to troponin elevation via plaque rupture processes. |
| Alyami et al. [26] | 2023 | Non-calcified plaque (NCP) | Prevalence in asymptomatic adults | Yes | Systematic review (14 studies, n = 37,808): overall NCP prevalence 10% (95% CI 6–13%); obstructive NCP 1.1% (0.7–1.5%). |
| Alfakih et al. [27] | 2018 | CTA biomarkers | CAD evaluation | Yes | Summarizes diagnostic accuracy (sensitivity, specificity, overall performance) of FFR-CT compared with invasive FFR from cited trials and highlights associated health-economic benefits and reductions in unnecessary invasive angiography. |
| Coerkamp et al. [28] | 2025 | FAI | CV risk reclassification | Yes | Retrospective cohort of high-risk patients, FAI led to 62% reclassification in ASCVD risk categories, 22% up-classified, 40% down-classified; no HR/OR reported. |
| Cai et al. [29] | 2023 | FFR-CT | Ischemia detection | Yes | Correlation r = 0.80–0.82 (95% CI 0.70–0.88); AUC = 0.768–0.857 for ischemia detection by FFR-CT, highest at 2 cm distal to stenosis (AUC 0.857). |
| Yu et al. [31] | 2020 | FAI | Predict ischemia severity | Yes | OR = 1.028 per 1 HU (%), P = 0.01; combined model (DS + PVAT + plaque): AUC = 0.821; integrated DS + FAI + FFR-CT model: AUC = 0.917. |
| Pontone et al. [32] | 2021 | CT perfusion | Diagnostic value | No | Summarize diagnostic performance improvements of dynamic perfusion CT over anatomical CTA; mentions the ability to detect ischemia more reliably and reduce overestimation of disease severity. |
| Imai et al. [33] | 2019 | FFR-CT, plaque features | Non-obstructive CAD ischemia | Yes | Area remodeling index: AUC = 0.921; percent plaque area: AUC = 0.681; myocardial mass: AUC = 0.641. |
| Min et al. [34] | 2022 | Plaque volume vs. FFR | Diagnostic accuracy | Yes | ischemic (PAV 15.2 ± 9.5%, TPV 694.6 ± 485.1 mm3); non-ischemic (PAV 9.2 ± 7.3%, TPV 422.9 ± 387.9 mm3). No AUC or correlation values reported. |
| Simantiris et al. [35] | 2024 | Perivascular fat (FAI) | CAD risk | Yes | Reports higher PCAT attenuation in plaque vs. healthy segments (~–34 HU vs. –56 HU); elevated FAI linked to impaired coronary flow reserve; in type 2 diabetes, LAD PCAT attenuation independently predicted CV events, and adding it to adverse CCTA features improved discrimination (ΔAUC ≈ 0.05). |
| Oikonomou et al. [36] | 2018 | FAI | Cardiac mortality | Yes | HR 2.06–2.15 per 1SD increase in FAI; ΔAUC +0.049 (cardiac), +0.075 (all-cause) over models including RCA calcium, HRP, and clinical risk factors. |
| Khan et al. [37] | 2023 | EAT volume | Plaque vulnerability and ischemia | Yes | High EAT (> 125 mL) independently associated with positive remodeling (P = 0.038); no difference in ischemia (P ≥ 0.34). |
AUC: area under the curve; CAD: coronary artery disease; CCTA: coronary CT angiography; CT: computed tomography; CTP: CT myocardial perfusion; EAT: epicardial adipose tissue; HR: hazard ratio; HU: Hounsfield unit; MACE: major adverse cardiac events; MI: myocardial infarction; OR: odds ratio; PVAT: perivascular adipose tissue; TPV: total plaque volume; HRP: high-risk plaque; DS: diameter stenosis; INOCA: Ischemia with No Obstructive Coronary Artery Disease; FAI: fat attenuation index; LAP: low-attenuation plaque.
On the diagnostic side, FFR-CT consistently improves specificity over CTA alone and shows good agreement with invasive FFR; typical per-patient accuracy ~81%, sensitivity ~86% and specificity ~79%. Performance is best at clear normal or clearly abnormal values (≥ 90% accuracy when FFR-CT is > 0.90 or < 0.49), with expected uncertainty in the borderline zone (~0.74–0.82) [3, 8, 11]. Dynamic CTP generally demonstrates high sensitivity (~90%+) with specificity around ~80% for ischemia and adds value when anatomic stenosis is intermediate/discordant; performance varies by acquisition/vendor protocol, and absolute MBF cut-offs are not standardized. Anatomic plaque metrics alone provide moderate discrimination for ischemia (AUC ~0.75–0.77; sensitivity ~79–88%; specificity ~55–63%). In selected lesion-level analyses, morphometrics such as the Area Remodeling Index can perform strongly (AUC ~0.92), and combining anatomy with FFR-CT or CT-MPI improves rule-in or rule-out decisions [7, 12, 15, 21].
For prognosis, LAP shows a consistent association with future MI: LAP burden > 4% confers ~4.6-fold higher MI risk (adjusted) and each doubling of LAP is associated with a ~60% higher risk. Additional cohorts report similar directions of effect (often 2–3-fold). Perivascular fat attenuation/FAI (PCAT) is independently associated with adverse outcomes; cardiac mortality HR ~2.1 in derivation/validation and relates to MI risk [e.g., RCA PCAT around −70 Hounsfield unit (HU) linked to ~2.5-fold higher MI risk] [23, 25, 27]. Risk appears additive when FAI is considered alongside HRP features, and adding FAI to adverse CCTA findings typically provides modest discrimination gains (ΔAUC ~0.05). HRP features (napkin-ring sign, positive remodeling, LAP) track with events across studies (typical OR ~1.6–2.5; AUC up to ~0.83). For epicardial adipose tissue (EAT), higher attenuation correlates with more adverse plaque composition (~+7% fibrofatty plaque per +1 HU), whereas EAT volume shows mixed associations with ischemia/vulnerability across cohorts [2, 5, 13, 20].
Beyond single markers, several studies report improvements in risk discrimination and reclassification when imaging biomarkers are added to clinical factors and standard CCTA features (e.g., ΔAUC on the order of ~0.05 and meaningful category shifts in high-risk populations). Definitions and operational thresholds varied across the literature, particularly for LAP HU windows, FAI sampling segments, and CT-MPI MBF cut-offs, and are cataloged in Table S4 to support standardization. Sensitivity analyses restricted to higher-quality observational studies (e.g., NOS ≥ 7) yielded directly similar conclusions, with wider intervals reflecting smaller sample sizes.
The 29 included studies represented a broad spectrum of designs and methodologies. These consisted of 9 retrospective cohort studies, 6 prospective cohort studies, 3 cross-sectional studies, 5 prospective multicenter trials, and 6 systematic or meta-analyses. Our discussion also included 7 additional studies that involve expert opinions, including commentary on the relevant topics. Collectively, these studies involved over 45,000 participants, with individual sample sizes ranging from less than 100 to over 4,500 participants, offering diverse insights into the diagnostic and prognostic utility of cardiac CT biomarkers in CVD.
The most frequently evaluated cardiac CT biomarkers were LAP, perivascular FAI, FFR-CT, total plaque burden (TPB), NCPB, and EAT volume. Several studies have also examined CTP imaging, including both static and dynamic perfusion protocols, particularly in the assessment of microvascular dysfunction. Emerging applications such as delayed enhancement and tissue characterization by CT were also represented in select studies (Figure 2).
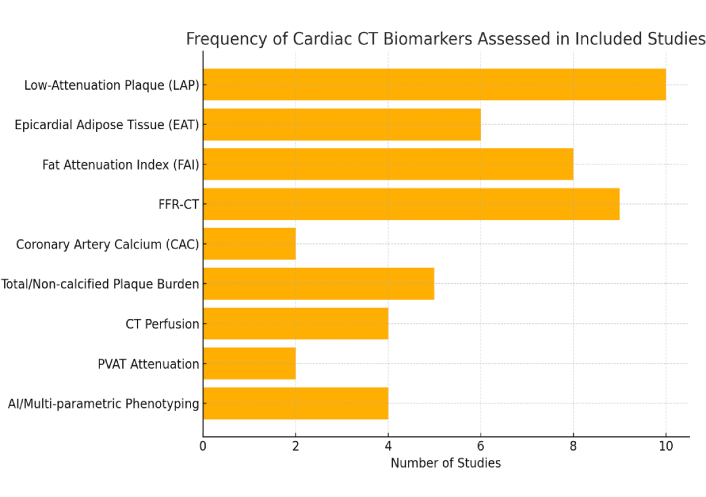
Bar graph illustrating the Frequency of Different CT Biomarkers Investigated Across Included Studies. FFR-CT: CT-derived fractional flow reserve; PVAT: perivascular adipose tissue; CT: computed tomography.
Primary clinical outcomes evaluated across the included studies were MACE, MI, cardiovascular mortality, ischemia detection, plaque progression, and plaque vulnerability. Among the biomarkers, LAP and FAI were most consistently associated with MACE, MI, and long-term cardiovascular mortality. FFR-CT demonstrated strong diagnostic accuracy for detecting hemodynamically significant ischemia, frequently correlating with invasive FFR and guiding revascularization decisions. Studies incorporating CTP imaging highlighted its additive value in detecting ischemia. The integration of functional, anatomical, and inflammatory biomarkers is enhancing the precision of cardiovascular risk stratification across both stable and high-risk populations. The literature search was guided by the PCC (Population, Concept, Context) framework, with keywords summarized in Table 2.
Population, concept, and context keywords used in the literature search.
| Main keyword | Alternate keywords |
|---|---|
| Population | Cardiovascular disease, coronary artery disease, atherosclerosis, myocardial infarction, heart failure |
| Concept | Cardiac CT, coronary CT angiography (CCTA), CT biomarkers, imaging biomarkers, coronary plaque characterization, perivascular fat attenuation index, low-attenuation plaque, CT-derived fractional flow reserve (FFR-CT), CT perfusion |
| Context | Diagnostic accuracy, prognostic value, cardiovascular events, mortality, risk stratification |
CT: computed tomography.
(“cardiac computed tomography”[MeSH] OR “coronary computed tomography angiography”[MeSH] OR “cardiac CT”[tiab] OR “coronary CT angiography”[tiab] OR CCTA[tiab]) AND (“biomarker”[tiab] OR “imaging biomarker”[tiab] OR “low attenuation plaque”[tiab] OR LAP[tiab] OR “perivascular fat attenuation”[tiab] OR “fat attenuation index”[tiab] OR FAI[tiab] OR PCAT[tiab] OR “epicardial adipose tissue”[tiab] OR “fractional flow reserve”[tiab] OR “FFR-CT”[tiab] OR “CT myocardial perfusion”[tiab] OR “CT perfusion”[tiab] OR radiomics[tiab] OR “texture analysis”[tiab] OR “delayed enhancement”[tiab] OR “myocardial fibrosis”[tiab]) AND (“diagnosis”[MeSH] OR “prognosis”[MeSH] OR “risk stratification”[tiab] OR “myocardial infarction”[tiab] OR “major adverse cardiac events”[tiab] OR mortality[tiab]). Filters: Humans, English, 2015–2025.
TITLE-ABS-KEY(“cardiac computed tomography” OR “coronary CT angiography” OR CCTA OR “cardiac CT”) AND TITLE-ABS-KEY(“biomarker” OR “imaging biomarker” OR “low attenuation plaque” OR LAP OR “perivascular fat attenuation” OR “fat attenuation index” OR FAI OR PCAT OR “epicardial adipose tissue” OR “fractional flow reserve” OR “FFR-CT” OR “CT myocardial perfusion” OR “CT perfusion” OR radiomics OR “texture analysis” OR “delayed enhancement” OR “myocardial fibrosis”) AND TITLE-ABS-KEY(“diagnostic accuracy” OR prognosis OR “risk stratification” OR “myocardial infarction” OR “major adverse cardiac events” OR mortality) AND (PUBYEAR > 2014 AND PUBYEAR < 2026) LIMIT-TO (LANGUAGE, “English”).
The included studies collectively evaluated over 43,000 participants across diverse cardiovascular populations with varying risk profiles. The majority of studies have focused on adults with suspected or known CAD, including both stable outpatients and individuals presenting with acute coronary syndromes (ACS). Mean participant ages ranged from the mid-50s to early 70s, with a male predominance consistently observed across most cohorts. Several randomized trials and cohort studies specifically enrolled intermediate-risk patients undergoing CCTA for anatomical and functional evaluation, while others targeted higher-risk groups with prior MI, complex atherosclerosis, or advanced plaque burden. Comorbid conditions were variably reported but frequently included hypertension, hyperlipidemia, diabetes mellitus, and smoking history. Geographic representation spanned multicenter cohorts from North America, Europe, and Asia, supporting broad generalizability of findings. Due to heterogeneity in study design and data reporting, detailed pooled analysis of baseline characteristics was limited. Nevertheless, the aggregate evidence reflects a comprehensive cross-section of contemporary cardiovascular imaging populations across varying risk strata (Table S3).
The majority of included studies evaluated CAD and its clinical manifestations, including stable angina, ACS, and MI. Several studies additionally assessed associations with heart failure (HF), particularly through markers such as EAT volume, TPB, and perivascular FAI. A subset of studies explored prognostic endpoints such as MACE, SCD, plaque progression, and need for coronary revascularization. No studies in this review evaluated valvular heart disease, non-ischemic cardiomyopathies, arrhythmias, or congenital cardiac conditions.
Effect measures were extracted as reported by each included study. For prognostic studies, HRs and ORs were recorded for associations between CT biomarkers and clinical outcomes such as MI, MACE, and mortality. For diagnostic studies, performance metrics including area under the receiver operating characteristic curve (AUC), sensitivity and specificity were extracted where available. No recalculation or transformation of effect estimates was performed. A comprehensive summary of extracted effect measures across all included studies is provided in Table 1. More details about the biomarker outcomes in terms of diagnostic and prognostic performance have been summarized in Table S5.
Substantial variation was observed in the quantification and definition of cardiac CT imaging biomarkers across studies. LAP was most commonly defined using a HU threshold of < 30 HU, although some studies used alternative cutoffs (e.g., < 60 HU for low-attenuation zones) [26]. The perivascular FAI was assessed with differing HU cutoffs, measurement ranges, and segmentation protocols across studies. Quantification of total plaque volume (TPV), NCPB, and EAT volume relied on proprietary or semi-automated post-processing software, with notable variability in segmentation algorithms, coronary segment definitions, and interobserver reproducibility [27]. Functional biomarkers such as FFR-CT were computed using computational fluid dynamics or machine learning-based algorithms, with ischemic thresholds consistently defined at ≤ 0.80 across studies. Several studies have also incorporated CTP imaging to assess myocardial ischemia, including both static and dynamic perfusion protocols [7]. The observed heterogeneity in biomarker quantification underscores the urgent need for standardized definitions, uniform acquisition protocols, and validated thresholds to ensure consistency in future research and clinical application. Definitions and cut-offs used across studies are detailed in Table S4.
Most studies assessed both diagnostic and prognostic endpoints. Prognostic studies primarily examined incident MACE, MI, cardiovascular mortality, plaque progression, and composite ischemic events. Diagnostic studies commonly compared CT-based biomarkers, particularly FFR-CT and CTP, against invasive coronary angiography, invasive FFR, or SPECT as reference standards. Follow-up durations ranged from 6 months to 5 years, though long-term outcome data were limited, particularly among retrospective observational studies. Few studies incorporated serial imaging, treatment modification, or longitudinal evaluation of biomarker-guided interventions. Real-world clinical integration of biomarker-guided management strategies remains underexplored in the existing literature.
This systematic and narrative review underscores the evolving role of cardiac CT biomarkers in transforming the assessment and management of CAD. Moving beyond the traditional focus on anatomic stenosis, advanced CT biomarkers now provide noninvasive insights into plaque vulnerability, vascular inflammation, and functional lesion severity, domains previously assessed primarily through invasive or multimodal techniques [17].
Cardiac CT has matured into a true multiparametric platform capable of simultaneously evaluating plaque morphology, perivascular inflammation, and ischemia within a single examination. Key biomarkers such as LAP, perivascular FAI, quantitative plaque burden, EAT volume, and FFR-CT consistently demonstrate incremental diagnostic and prognostic value beyond luminal narrowing alone [18]. Incorporating these biomarkers into clinical care enhances individualized risk stratification, guides targeted therapy, and addresses the biological drivers of coronary events, including plaque instability and inflammation [19].
Advanced CT biomarkers enable assessment of not only coronary anatomy but also functional and biological lesion characteristics. Among these, FFR-CT, CTP, and HRP features significantly improve identification of ischemia-producing stenoses and inform revascularization decisions, particularly in intermediate lesions [20].
FFR-CT, derived from standard CCTA datasets using computational fluid dynamics or machine learning algorithms, provides lesion-specific ischemia estimates without additional imaging or radiation exposure. Multiple studies demonstrate a strong correlation between FFR-CT and invasive FFR, with AUC values consistently exceeding 0.80 for detecting functionally significant lesions [21, 22]. Prospective trials further highlight FFR-CT’s clinical utility in reducing unnecessary invasive angiography and optimizing PCI decision-making [23].
CTP, though less widely implemented, adds complementary diagnostic power, particularly in multivessel disease, high coronary calcium burden, or discordant FFR-CT cases. Studies show that combining CTP with CCTA enhances ischemia detection, especially in patients with balanced ischemia or microvascular dysfunction [7].
The integration of anatomical, functional, and biological data within cardiac CT allows for a uniquely comprehensive evaluation of CAD, surpassing prior limitations of purely anatomic imaging. HRP morphology further augments diagnostic assessment by identifying vulnerable lesions prone to ischemia and adverse events. Features such as LAP, the napkin-ring sign, and positive remodeling are strongly associated with lesion vulnerability and frequently co-localize with physiologically significant stenoses. Multiple studies demonstrated that plaques exhibiting LAP (< 30 HU) or napkin-ring features correlate with abnormal FFR or perfusion defects, even in lesions with only moderate angiographic stenosis [22, 25]. Thus, CT plaque characterization flags lesions that may warrant more aggressive therapy despite sub-threshold luminal narrowing.
Beyond their diagnostic contribution, cardiac CT biomarkers offer powerful prognostic information by reflecting disease biology rather than simply anatomic severity. Across studies, LAP, FAI, quantitative plaque burden, and EAT consistently emerged as independent predictors of MACE, MI, and mortality [21, 28, 29].
LAP, in particular, has demonstrated one of the strongest predictive associations with future events. Both retrospective and prospective studies confirm that LAP presence significantly increases the risk for spontaneous MI, MACE, and even plaque rupture, often independent of stenosis severity [25, 32]. Furthermore, LAP burden may serve as a dynamic marker of treatment response, with serial CCTA capable of tracking regression following lipid-lowering or anti-inflammatory therapy.
Similarly, the perivascular FAI, reflecting coronary inflammation, has shown robust prognostic significance. Elevated FAI values surrounding proximal coronary arteries are linked with increased cardiac events independent of calcium score, stenosis, or traditional risk factors [28, 33]. Longitudinal studies included in this review reveal that patients in the highest tertiles of FAI carry significantly greater risks of MACE and cardiac death.
Quantitative plaque burden measures, including TPV and NCPB, offer further incremental risk stratification beyond stenosis grading alone. Studies demonstrated that increasing plaque burden strongly predicts both near-term and long-term adverse cardiovascular outcomes, even in patients with non-obstructive CAD [34]. These metrics are particularly valuable for diffuse disease, where percent stenosis may underestimate risk.
EAT, while a less specific marker, has also been linked to increased risk of MI, HF, and SCD, particularly in high-risk cohorts [20, 23]. However, variability in EAT quantification methods limits its current clinical application.
Collectively, these data demonstrate that CT biomarkers enable refined risk stratification well beyond conventional stenosis evaluation. Patients with HRP features, active coronary inflammation, or extensive plaque burden face elevated event risk even in the absence of severe stenoses. This provides critical clinical implications: for example, a patient with non-obstructive CAD but extensive LAP and elevated FAI may warrant aggressive preventive therapy and closer surveillance comparable to those with obstructive lesions. Importantly, many MIs arise from lesions previously categorized as “non-obstructive” and CT biomarkers offer a tool to identify these high-risk patients earlier [9, 10].
Figure 3 summarizes the strength of evidence linking each CT biomarker to clinical outcomes. LAP and FAI demonstrate the most consistent prognostic associations, while functional markers such as FFR-CT primarily guide downstream management decisions.
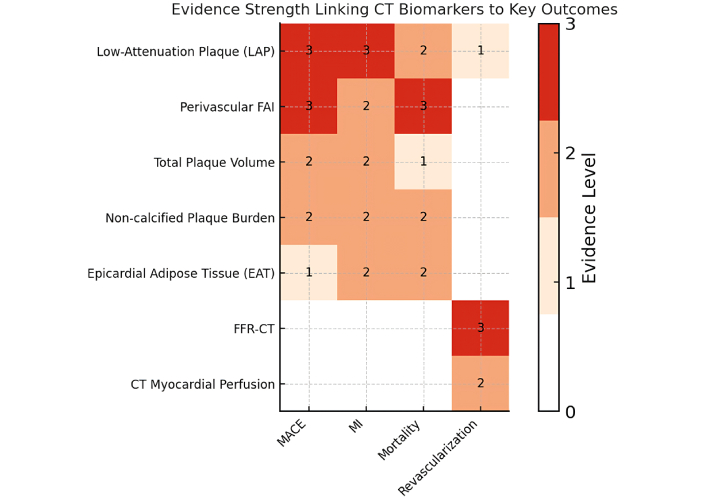
Heatmap illustrating the qualitative strength of evidence (scale 0 to 3) linking key CT biomarkers to clinical outcomes [major adverse cardiac events (MACE), myocardial infarction (MI), mortality, and need for revascularization]. Darker shades (higher scores) indicate stronger evidence. Notably, low-attenuation plaque (LAP) and perivascular FAI show the strongest associations with MACE, MI, and mortality (score 3), whereas functional measures like FFR-CT predominantly influence revascularization decisions (score 3 for guiding revascularization). CT: computed tomography; FAI: fat attenuation index; FFR-CT: CT-derived fractional flow reserve.
For each biomarker (rows) and outcome (columns: MACE, MI, mortality, revascularization), we graded the strength of evidence on a 0–3 scale using prespecified criteria that combine study quantity, quality, consistency, and effect robustness:
Level 3 (High): ≥ 3 high-quality studies (NOS ≥ 7 or low RoB RCT/registry) or a meta-analysis, with directionally consistent adjusted associations (e.g., HR/OR significant in ≥ 75% of studies), plus evidence of incremental prognostic value and relatively larger total sample size across studies.
Level 2 (Moderate): ≥ 2 studies with at least one high-quality (NOS ≥ 7) analysis; results largely consistent but with some imprecision/heterogeneity and adjusted effect reported in ≥ 1 study; incremental value not uniformly shown.
Level 1 (Low): Preliminary or limited evidence (1–2 moderate-quality studies, NOS 5–6), small samples, unadjusted or minimally adjusted effects, or inconsistent directionality; no demonstrated incremental prognostic value.
Level 0: No eligible data.
Across studies, effect sizes were shaped by nonuniform definitions, software choices, and acquisition or reconstruction parameters. For LAP, most defined LAP as voxels < 30 HU, but some used < 60 HU or tool-specific bins; differences in kVp, kernel, slice thickness, and iterative reconstruction shift absolute HU and inflate/deflate LAP burden. For HRP features, the remodeling index threshold (typically > 1.10) is consistent, but reference-segment selection varies, and the napkin-ring sign remains reader-dependent [12, 16, 22]. For perivascular fat/FAI (PCAT), adipose HU windows are consistent (−190 HU to −30 HU), yet segment length (often proximal RCA 10–50 mm), ring geometry, and kVp/kernel differ, which affects absolute values; proposed “high-risk” cut-offs cluster near ~−70 HU but are not vendor-neutral [16, 18]. EAT metrics depend on pericardial segmentation and contrast phase; quantitative plaque burden differs by software because HU bins and smoothing rules are not harmonized. FFR-CT generally uses ≤ 0.80 for ischemia but varies in per-vessel vs. per-patient reporting and handling of the borderline 0.76–0.80 range. For CT-MPI, dynamic protocols estimate absolute MBF, yet vendor models and stress protocols yield non-interchangeable thresholds [7, 11, 28]. To make studies comparable and reproducible, authors should report scan settings, precise biomarker definitions, and the software/version used and specify how results are expressed (lesion, vessel, or patient-level).
Growing evidence for plaque characterization is redefining the longstanding “stenosis-centric” paradigm of CAD. While traditional diagnostic and therapeutic approaches have focused on flow-limiting stenoses, accumulating data reveal that many adverse events, including MI, SCD, and ACS, arise from non-obstructive but biologically HRPs [1, 2, 26]. This review reinforces that patients experiencing major events often harbor plaques with high-risk features such as LAP or napkin-ring sign despite only mild or moderate stenosis on CCTA.
Histologically, LAP corresponds to lipid-rich, necrotic core lesions prone to rupture even in the absence of severe luminal narrowing. Multiple studies demonstrated that LAP burden (typically defined as < 30 HU) independently predicts future MACE and MI, including in non-obstructive lesions [21, 35, 36]. Serial imaging studies suggest that LAP may serve as a dynamic imaging biomarker, with reductions in plaque lipid content and stabilization reflected by decreasing LAP volume following intensive lipid-lowering or anti-inflammatory therapy, though large-scale validation is ongoing [8].
Additional plaque features, such as napkin-ring sign and positive remodeling, further contribute to identifying vulnerable lesions. While observed less frequently, their presence strongly correlates with high-risk lesion behavior and ischemia on functional assessment [31]. The ability of CCTA to noninvasively capture these high-risk morphological features represents a paradigm shift, enabling identification of patients who may benefit from more aggressive preventive strategies despite sub-threshold stenoses.
Inflammation is a central driver of plaque destabilization, yet it has remained difficult to visualize noninvasively. Perivascular FAI mapping via CCTA offers a novel approach to infer localized coronary inflammation, with elevated FAI reflecting cytokine-mediated changes in perivascular fat composition. Multiple studies have confirmed that higher FAI values, particularly around proximal coronary segments, predict increased risk of cardiac events independent of plaque burden and conventional risk factors [32, 37]. Notably, elevated FAI is associated with higher 1–2 year MACE incidence and increased cardiac mortality [28].
EAT volume, another CT-derived marker, reflects broader cardiometabolic and inflammatory risk. Although less plaque-specific than FAI, elevated EAT has been associated with increased risk of MI, HF, and SCD across several studies [20, 28, 37]. Variability in EAT measurement techniques and the lack of standardized cutoffs limit its immediate clinical utility, though markedly elevated EAT may prompt more aggressive metabolic risk factor evaluation. Together, these inflammation-related biomarkers (FAI and EAT) extend cardiac CT’s ability to assess biological risk dimensions beyond stenosis severity, particularly relevant as anti-inflammatory therapies increasingly enter cardiovascular practice [12, 13].
In addition to anatomical and inflammatory insights, cardiac CT now offers robust functional assessment of coronary lesions, bridging the gap between plaque morphology and ischemic significance. Both FFR-CT and CTP provide lesion-specific hemodynamic data, enhancing risk stratification and guiding revascularization decisions [6].
FFR-CT, derived from computational modeling of standard CCTA datasets, consistently demonstrates high concordance with invasive FFR, with diagnostic accuracy frequently exceeding 80–85% [14, 16, 17]. Importantly, several trials confirm that FFR-CT-guided care pathways safely reduce unnecessary invasive angiography while improving procedural yield for revascularization [9, 15].
CTP offers complementary functional assessment, particularly valuable in multivessel disease, heavy coronary calcification, or prior revascularization, where anatomical assessment alone may be limited. Meta-analysis supports CTP’s diagnostic performance for ischemia, especially when used alongside CCTA [7]. In clinical practice, CTP may clarify ischemia burden when FFR-CT is equivocal or technically limited. This multiparametric framework supports a comprehensive, biologically informed approach to CAD evaluation (Figure 4).
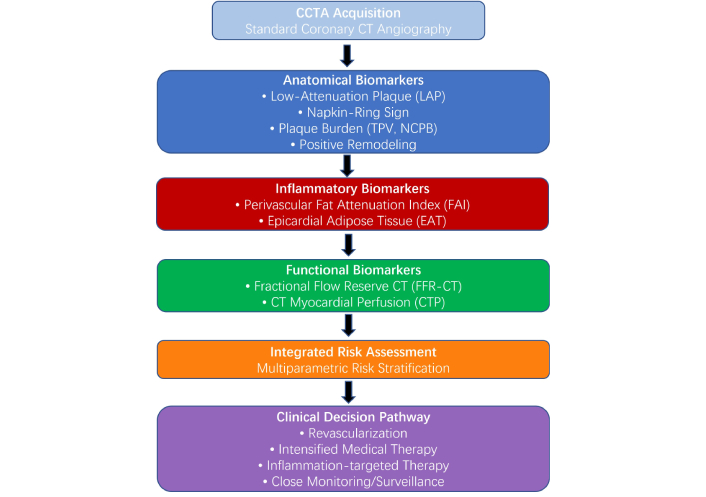
Central illustration: provides a conceptual framework categorizing CT biomarkers by their mechanisms. Anatomical markers (blue: LAP, plaque burden) identify vulnerability and predict MACE and MI; inflammatory markers (red: FAI, EAT) reflect vascular inflammation associated with mortality and recurrent events; functional markers (green: FFR-CT, CTP) guide revascularization decisions based on ischemia presence. This multiparametric framework supports a comprehensive, biologically informed approach to CAD evaluation. CT: computed tomography; CCTA: coronary CT angiography; TPV: total plaque volume; NCPB: non-calcified plaque burden; CAD: coronary artery disease; CTP: CT myocardial perfusion; EAT: epicardial adipose tissue; FAI: fat attenuation index; FFR-CT: CT-derived fractional flow reserve; LAP: low-attenuation plaque; MACE: major adverse cardiac events; MI: myocardial infarction.
The integration of anatomical, inflammatory, and functional biomarkers enables a personalized risk profile far beyond simple stenosis grading. For instance, a patient with intermediate stenosis but concomitant LAP, positive remodeling, and elevated FAI carries substantially higher risk than suggested by luminal narrowing alone [9, 10, 27]. Conversely, patients with intermediate stenosis but low-risk plaque features and minimal inflammation may be safely managed conservatively.
Such multiparametric integration resolves common diagnostic ambiguity, particularly in patients with discordant clinical and anatomical findings. Patients with minimal stenosis yet high inflammatory or vulnerable plaque burden may benefit from intensive therapy, while high-grade stenosis without functional or high-risk features may avoid overtreatment if functional ischemia is excluded [3, 4, 7].
Fully realizing this multiparametric paradigm will require streamlined acquisition, post-processing and reporting. Currently, comprehensive biomarker quantification remains time-intensive and software-dependent. However, AI-driven plaque analysis, automated FAI mapping, and machine learning-based FFR-CT algorithms are rapidly advancing [22, 23]. In the near future, routine CCTA reports may incorporate standardized “CT biomarker panels” generated with minimal manual input, supporting wider clinical adoption of biology-informed CAD management.
In addition to plaque characterization and functional assessment, recent advances have extended cardiac CT capabilities toward myocardial tissue characterization. Dynamic perfusion and delayed enhancement techniques enable visualization of myocardial fibrosis and scarring, previously assessed predominantly by cardiac magnetic resonance (CMR) imaging. Several studies included in this review demonstrate the feasibility of CT-based delayed enhancement imaging to detect MI, subendocardial scar, and viability [6, 7, 11].
The CORE320 study demonstrated that integrating CT perfusion and delayed enhancement with CCTA provided incremental diagnostic value for detecting ischemia and infarct compared to anatomical imaging alone [6]. Subsequent analyses suggest that comprehensive CT phenotyping, combining angiography, perfusion and scar assessment, may enhance risk stratification by capturing both ischemic burden and irreversible myocardial injury. Additional work has refined delayed enhancement CT protocols, highlighting its potential for accurately quantifying myocardial fibrosis with high spatial resolution [6, 7].
While these techniques remain investigational and not yet incorporated into routine clinical practice, their integration alongside plaque vulnerability, inflammation and functional assessment may ultimately allow CT to deliver a comprehensive biological evaluation of CAD and myocardial damage. Further prospective validation and technical standardization will be essential for widespread adoption.
Translating cardiac CT biomarkers into routine practice offers an opportunity to improve CAD management by providing actionable insights beyond anatomical stenosis. Several studies included in this review demonstrate that combining anatomical, functional, and inflammatory data alters clinical decision-making. FFR-CT-guided strategies reduce unnecessary invasive angiography by 30–50% while improving PCI selection [27, 29].
Integration into multidisciplinary Heart Team discussions is increasingly utilized, where CT biomarker findings are incorporated into comprehensive management plans. Serial assessment of biomarkers may also facilitate monitoring of disease regression, particularly for LAP, though prospective validation of this approach remains needed [25, 28, 35].
Current guidelines are evolving. The 2021 ACC/AHA Chest Pain Guideline and NICE recommendations endorse CCTA as a first-line diagnostic test for stable chest pain. Both guidelines also support the use of FFR-CT for evaluating intermediate coronary stenoses to assess lesion-specific ischemia and guide management decisions [38]. However, plaque characterization and inflammatory biomarkers such as FAI remain absent from major guidelines, largely due to the need for further standardization and prospective outcome trials. The 2024 ESC Chronic Coronary Syndromes Guideline likewise places CCTA up front within a risk-factor-weighted likelihood framework and recognizes FFR-CT as a complementary functional assessment when anatomy is equivocal.
Beyond stenosis grading, reporting frameworks (e.g., CAD-RADS 2.0) encourage standardized documentation of plaque burden and HRP features to aid risk stratification, but current ACC/AHA and ESC guidelines do not yet endorse routine clinical use of perivascular fat/FAI, EAT metrics, or radiomics currently. This remains investigational pending further validation and harmonized protocols. CT perfusion is acknowledged as a useful adjunct in selected contexts, but not a universal first-line alternative to CCTA. Specialty consensus documents increasingly recognize the clinical relevance of HRP features, and future incorporation into reporting standards and risk scores is anticipated as evidence accumulates.
Despite strong observational evidence, several barriers limit the widespread adoption of cardiac CT biomarkers. First, variability in biomarker definitions, acquisition protocols, and software platforms generates inter-study heterogeneity. Standardized thresholds for LAP (e.g., HU cutoffs), FAI calibration and plaque burden quantification are urgently needed to enhance reproducibility [22, 28].
Second, while prognostic associations are robust, most current studies are observational. Large randomized trials are needed to establish that biomarker-guided interventions directly improve clinical outcomes.
Third, clinical familiarity with these biomarkers is limited. Many providers still view cardiac CT primarily as a tool to exclude obstructive disease. Broader education and adoption of standardized reporting templates, including routine reporting of HRP features and FAI, will be essential to drive clinical translation [32, 36].
Finally, reimbursement and workflow integration remain practical challenges. FFR-CT, for example, may require external processing and additional cost. However, studies suggest that FFR-CT-guided care can be cost-effective by reducing invasive procedures [11, 17]. The eventual automation of plaque quantification, FAI and FFR-CT via AI-driven algorithms may significantly streamline adoption without substantial added cost or complexity.
The integration of advanced cardiac CT biomarkers marks a pivotal advance in CAD management. Beyond traditional lumen-focused assessment, cardiac CT now offers simultaneous evaluation of plaque characteristics, vascular inflammation and lesion-specific ischemia, enabling more biologically grounded and personalized risk stratification [36, 37].
This evolution supports a shift from reactive to proactive cardiovascular care, where imaging not only diagnoses but also informs prognosis, guides targeted therapy and enables serial monitoring of disease progression or regression. As analytic tools such as FFR-CT, perivascular adipose tissue (PVAT) attenuation, and radiomics continue to develop, cardiac CT is positioned to function as a comprehensive platform that bridges diagnostics with preventive and therapeutic strategies.
However, real-world adoption depends on multiple factors, including integration into clinical workflows, cost-effectiveness, availability of expertise and software, and validation across diverse populations. Future studies should focus on prospective implementation frameworks, health outcomes, and reimbursement strategies to ensure these innovations lead to tangible patient benefits.
While this review consolidates an expanding and promising body of evidence, several important limitations must be acknowledged. First, substantial heterogeneity in study design, patient populations, imaging acquisition protocols, and biomarker definitions limited the feasibility of pooled quantitative analyses or direct head-to-head comparisons. Second, the majority of included studies were observational and retrospective in nature. While these designs are valuable for exploratory analysis and hypothesis generation, they inherently restrict the ability to draw causal inferences and are prone to selection bias, unmeasured confounding, and variability in adjustment for clinical covariates. Limiting inclusion to English may have omitted relevant non-English studies, potentially affecting completeness and the generalizability of findings, particularly to regions with different practice patterns or patient characteristics. While we do not expect this restriction to alter the directionality of conclusions, it may influence precision (wider uncertainty) and underestimate geographic diversity. We partially mitigated this risk by hand-searching references and cross-checking recent reviews; nonetheless, language bias remains a limitation.
Third, reliance on proprietary, vendor-specific software for quantifying imaging biomarkers such as perivascular fat attenuation, extracellular volume, or CT-derived FFR introduces concerns about standardization and reproducibility across institutions and platforms. Lastly, relatively few studies assessed the additive prognostic value of biomarkers beyond traditional risk factors in diverse clinical settings or across different ethnic and sex-based subgroups. These gaps highlight the urgent need for prospective, multicenter studies that incorporate standardized imaging methodologies, uniform outcome definitions, and robust statistical adjustments to validate emerging cardiac CT biomarkers and facilitate their integration into routine clinical care.
Cardiac CT has emerged as a powerful, multi-parametric imaging platform capable of delivering comprehensive insights into CAD far beyond luminal stenosis. By combining anatomical characterization of atherosclerotic plaque, functional assessment of lesion-specific ischemia, and visualization of vascular inflammation, cardiac CT now occupies a unique position at the intersection of diagnosis, risk stratification, and precision-guided therapy. This integrative approach allows for earlier identification of vulnerable patients, more nuanced clinical decision-making, and tailored preventive strategies, even among individuals without obstructive disease.
As machine-learning-based automation, quantitative analytics, and AI-driven tools become more widely available, the interpretation of complex biomarkers such as FAI, EAT, and LAP is becoming faster, more reproducible, and more clinically actionable. To translate this into routine care, we should develop fully automated, quality-controlled pipelines for LAP, total and NCPB, EAT, FAI, and CT-MPI, coupled with multi-vendor external validation, systematic bias assessment, continuous model calibration, and drift surveillance, along with expert human oversight. In the near term, the field should finalize consensus definitions and acquisition standards and adopt a simple minimum reporting set. In parallel, a multicenter, vendor-agnostic registry using a common data model should capture scan parameters, biomarker values, treatments, and outcomes, while pragmatic randomized trials test biomarker-guided therapy and CT-physiology-guided pathways against usual care. With ongoing validation through large-scale, prospective trials, these emerging CT-derived biomarkers have the potential to redefine how we assess and manage CAD, from a static, stenosis-centric framework to a dynamic, biologically informed, and truly personalized model of preventive cardiology. This paradigm shift aligns with the broader goals of precision medicine and holds promise for significantly improving cardiovascular outcomes on both individual and population levels.
ACS: acute coronary syndromes
AUC: area under the curve
CAD: coronary artery disease
CCTA: coronary computed tomography angiography
CT: computed tomography
CTP: computed tomography myocardial perfusion
CVD: cardiovascular disease
DS: diameter stenosis
EAT: epicardial adipose tissue
FAI: fat attenuation index
FFR-CT: computed tomography-derived fractional flow reserve
HF: heart failure
HR: hazard ratio
HRP: high-risk plaque
HU: Hounsfield unit
INOCA: Ischemia with No Obstructive Coronary Artery Disease
LAP: low-attenuation plaque
MACE: major adverse cardiac events
MI: myocardial infarction
NCPB: non-calcified plaque burden
NOS: Newcastle-Ottawa Scale
ORs: odds ratios
PRISMA: Preferred Reporting Items for Systematic Reviews and Meta-Analyses
PVAT: perivascular adipose tissue
RCTs: randomized controlled trials
RoB: risk of bias
SCD: sudden cardiac death
TPB: total plaque burden
TPV: total plaque volume
The supplementary materials for this article are available at: https://www.explorationpub.com/uploads/Article/file/101278_sup_1.pdf.
MAH: Conceptualization, Methodology, Investigation, Writing—original draft. MM, AA, MAA: Data curation, Investigation, Writing—review & editing. OA, RB, P Savoia, P Suksaranjit, JACL: Validation, Writing—review & editing, Visualization. KD: Conceptualization, Methodology, Supervision, Writing—review & editing. All authors read and approved the submitted version.
The authors declare that there are no conflicts of interest or financial disclosures related to this work.
Not applicable.
Not applicable.
Not applicable.
The datasets that support the findings of this study are available from the corresponding author upon reasonable request.
Not applicable.
© The Author(s) 2025.
Open Exploration maintains a neutral stance on jurisdictional claims in published institutional affiliations and maps. All opinions expressed in this article are the personal views of the author(s) and do not represent the stance of the editorial team or the publisher.
Copyright: © The Author(s) 2025. This is an Open Access article licensed under a Creative Commons Attribution 4.0 International License (https://creativecommons.org/licenses/by/4.0/), which permits unrestricted use, sharing, adaptation, distribution and reproduction in any medium or format, for any purpose, even commercially, as long as you give appropriate credit to the original author(s) and the source, provide a link to the Creative Commons license, and indicate if changes were made.

View: 6657
Download: 118
Times Cited: 0
