 Original Article


Affiliation:
1School of Basic Medicine and Clinical Pharmacy, China Pharmaceutical University, Nanjing 211198, Jiangsu, China
2Department of Pharmacy, Nanjing First Hospital, Nanjing Medical University, Nanjing 211166, Jiangsu, China
ORCID: https://orcid.org/0009-0007-2074-6845

 ,
Affiliation:
1School of Basic Medicine and Clinical Pharmacy, China Pharmaceutical University, Nanjing 211198, Jiangsu, China
2Department of Pharmacy, Nanjing First Hospital, Nanjing Medical University, Nanjing 211166, Jiangsu, China
ORCID: https://orcid.org/0000-0001-7520-5105
,
Affiliation:
1School of Basic Medicine and Clinical Pharmacy, China Pharmaceutical University, Nanjing 211198, Jiangsu, China
2Department of Pharmacy, Nanjing First Hospital, Nanjing Medical University, Nanjing 211166, Jiangsu, China
ORCID: https://orcid.org/0009-0005-8171-800X
,
Affiliation:
1School of Basic Medicine and Clinical Pharmacy, China Pharmaceutical University, Nanjing 211198, Jiangsu, China
2Department of Pharmacy, Nanjing First Hospital, Nanjing Medical University, Nanjing 211166, Jiangsu, China
ORCID: https://orcid.org/0009-0008-2031-9816
,
Affiliation:
1School of Basic Medicine and Clinical Pharmacy, China Pharmaceutical University, Nanjing 211198, Jiangsu, China
2Department of Pharmacy, Nanjing First Hospital, Nanjing Medical University, Nanjing 211166, Jiangsu, China
ORCID: https://orcid.org/0009-0000-3471-4798
,
Affiliation:
2Department of Pharmacy, Nanjing First Hospital, Nanjing Medical University, Nanjing 211166, Jiangsu, China
Email: zoujianjun100@126.com
ORCID: https://orcid.org/0000-0003-0886-3153

Explor Cardiol. 2026;4:1012126 DOI: https://doi.org/10.37349/ec.2026.1012126
Received: June 17, 2026 Accepted: August 26, 2026 Published: October 19, 2026
Academic Editor: Karina Wierzbowska-Drabik, Medical University of Lodz, Poland
Aim: Cardiovascular disease (CVD) is the most common non-cancer cause of death in breast cancer (BC) survivors, yet the age-specific point at which CVD deaths overtake BC deaths, and its early indicators, remain unknown. This study aimed to establish this time point and identify factors associated with cardiovascular-specific mortality (CSM) in early-stage BC.
Methods: We analyzed 255,731 women diagnosed with stage I–III BC (2010–2020) from the Surveillance, Epidemiology, and End Results (SEER) 17 registries. CSM was compared with the general United States (US) female population using standardized mortality ratio (SMR) via Centers for Disease Control and Prevention’s Wide-ranging Online Data for Epidemiologic Research (CDC WONDER). Competing-risk methods estimated cumulative incidence, and Fine-Gray regression identified factors associated with CSM after adjustment for measured covariates.
Results: Upon age standardization, the overall risk of CSM was modestly higher among BC patients than in the general female population [SMR = 1.16, 95% confidence intervals (CI): 1.13–1.19, P < 0.001], with marked heterogeneity by age; the relative excess was greatest in women aged < 50 (SMR = 2.894) and attenuated in older strata (50–59, SMR = 1.138; 60–69, SMR = 1.208; 70–85, SMR = 1.128). Cumulative CSM reached 2.53% at 84 months (7 years). Within the oldest cohort (70–85 years), cumulative CSM crossed above BC-specific mortality later, at approximately 8 years (97 months; 95% CI 91–101) [sub-distribution hazard ratio (SHR) = 19.37; 70–85 vs. 18–49], followed by unmarried status (1.59), Black race (1.37), advanced tumor (T4, 1.60) and nodal stage (N3, 1.34). Chemotherapy and radiotherapy were associated with lower CSM (SHR = 0.59 and 0.64); given SEER’s lack of treatment data, these likely reflect selection bias and residual confounding rather than protection.
Conclusions: This is one of the first studies to identify an approximate mortality crossover point between CSM and BC-specific mortality at about 8 years (97 months) in women aged 70–85, providing a clinically relevant, exploratory time point for increased cardiovascular monitoring in this high-risk population.
Globally, breast cancer (BC) is the most commonly diagnosed malignancy in women and a leading cause of cancer-associated mortality [1, 2]. Over the past decades, there has been significant increase in survival rates in the United States (US), with diagnosis largely at stage I–III disease [3]. With the growing trend of survivals, non-cancer-associated mortality increasingly accounts for a significant share of long-term outcomes [4, 5].
Cardiovascular disease (CVD) is a major cause of death among the general US population [6], with CVD associated mortality representing a predominant non-cancer related mortality, especially among older patients, with BC survivors aged ≥ 50 years associated with an estimated 35% incidence of non-BC mortality [7]. However, currently, there is limited understanding of the etiology of CVD among BC survivors [8]. Age, obesity, smoking, and metabolic disorders are common risk factors for both CVD and BC [8, 9]. Additionally, cardiac damage may result from treatment modalities employed in the management of early-stage BC, including chemotherapy, radiotherapy, endocrine therapy, targeted therapy, and vascular inhibitors, with the trend of cardiovascular related deaths in the long term likely to be altered by the combined impact of baseline risk and treatment exposure [10–14].
Previous studies have examined risk factors for CVD-related mortality within cohorts of cancer survivors, mostly focusing on BC treatment [8, 11]. Although an increased risk of CVD has been reported by previous clinical studies, there is limited insight on the magnitude of this comorbidity in population-based cohorts of BC survivors [15, 16]. Furthermore, there is a dearth of studies exploring the extent to which BC survivors experience CVD related outcomes relative to non-BC women, as well as the time when any excess risk of CVD becomes manifest. This limitation challenges the ability of clinicians to identify and provide accurate recommendations for CVD risk reduction strategies specific to BC survivors, particularly regarding timely interventions [8, 11, 16]. Consequently, studies presenting up-to-date population-based estimations are necessary, especially due to improvements in survival rates and changes in treatment trends.
Thus, the study aimed at assessing the precise post-diagnosis time point at which the risk of CVD death crosses over to become higher than BC-specific death across age groups in early-stage BC survivors, and the associated independent early demographic and clinico-pathological predictors, with the ultimate goal of providing valuable insight into the identification of critical time point necessary to help prioritize interventions towards ensuring improved cardioprotective care among BC survivors. Specifically, the study hypothesized that cardiovascular-specific mortality (CSM) risk in early-stage BC survivors exceeds that of the age-matched general female population, with the excess most pronounced in older survivors; and that a definable post-diagnosis time point exists at which cumulative CSM overtakes cumulative BC-specific mortality (BCSM) in older survivors.
The Surveillance, Epidemiology, and End Results (SEER) database (https://seer.cancer.gov) collects cancer incidence data from 17 regional registries, representing an estimated one-quarter of the US population, and is considered the gold standard for data quality among cancer registries in the US as well as globally. We gained access to the SEER database via a standard request and used SEER*Stat 9.0.42.2 software (https://seer.cancer.gov/seerstat) to access the SEER 17 registries research data (2023 submission), in October 2025 [17].
The SEER database regularly collects and updates patient data including demographic characteristics, clinico-pathological characteristics, and patient follow-up information. Researchers need to submit a data access permission application form and download the required data through SEER*Stat software. The SEER database is publicly accessible and comprises of de-identified secondary data. Therefore, patients’ informed consent was not required, and the study was also exempt from review by an ethics committee.
Concurrently, to facilitate comparative assessment with the BC patient population in the SEER database in this study, data were sourced from the Centers for Disease Control and Prevention’s Wide-ranging Online Data for Epidemiologic Research (CDC WONDER) for a standard cohort that represented the US general population [18]. For the standardized mortality ratio (SMR) analysis, the CDC WONDER reference mortality rates were obtained for the 2009–2019 period. This reference period was selected to avoid incorporating the anomalous elevation in cardiovascular mortality observed in the US general population during 2020 associated with the COVID-19 pandemic. The CDC is a government agency of the US Department of Health and Human Services. CDC WONDER publishes the Morbidity and Mortality Weekly Report (MMWR) of the general population of the US and various public health data, including scientific research data, survey supervision data, health statistics and laboratory information based on the death certificates of American residents. Therefore, patients’ informed consent was not required, and use of data was exempt from review by an ethics committee.
This retrospective cohort study employed the following inclusion criteria: (1) female patients diagnosed between 2010 and 2020; (2) the 7th edition of the American Joint Committee on Cancer (AJCC) staging clearly defined as a single primary BC stage I–III at diagnosis; (3) age between 18 and 85 years old; (4) complete follow-up information; (5) receipt of BC-related surgery.
Patients were excluded from the study based on the following criteria: (1) identification of BC diagnosis from death certificate or autopsy; and (2) incomplete information or unknown records. ‘No landmark’ exclusion was applied in the primary analysis; all eligible patients meeting the inclusion criteria were retained and followed from the date of diagnosis.
Analyses were conducted for pre-specified subgroups based on clinically meaningful characteristics, including demographic and clinical characteristics.
Patient demographic variables included age at diagnosis (categorized as 18–49, 50–59, 60–69, and 70–85 years old), race (categorized as White, Black, other races), and marital status (categorized as unmarried and married patients).
Clinical variables collected from the SEER data included AJCC stage (I–III), estrogen receptor (ER), progesterone receptor (PR), and tumor human epidermal growth factor receptor 2 (HER2) status (categorized as negative and positive), pathological grade (categorized as Ⅰ, Ⅱ, Ⅲ, and Ⅳ), and treatment forms.
Treatment variables included surgery, chemotherapy, and radiotherapy. Breast-conserving therapy [BCT; less than total mastectomy (ME): segmental ME, lumpectomy, tylectomy, wedge resection, nipple resection, excisional biopsy, or partial ME not otherwise specified (NOS)] or ME (radical or total) were required for patients to be included in this study. Data on adjuvant chemotherapy and adjuvant hormonal therapy were not available in the SEER. Therefore, the chemotherapy and radiation variables were simply classified as yes or no/unknown.
In this study, the patients were divided into four groups according to their outcomes at the end of follow-up as follows: (1) censored observations (also called “alive group”): alive till the last follow-up or lost to follow-up; (2) BCSM: the outcome of BCSM was defined if their cause of death was classified by International Classification of Diseases, tenth Revision (ICD-10) codes as death due primary malignant BC [19]; (3) CSM: the outcome of cardiovascular-specific death was similarly defined using ICD-10 codes for death due to diseases of the heart, hypertension without heart disease, cerebrovascular disease, atherosclerosis, aortic aneurysm and dissection and other diseases of arteries, arterioles and capillaries [20]; (4) other cause mortality (OCM): other cancer-related deaths or non-cancer-related deaths.
The distributions of all baseline characteristics were summarized by calculating the median and range for continuous variables and frequencies for categorical variables, respectively, and the chi-square test were applied to compare the distribution of these categorical demographic and clinical characteristics across the four outcome groups.
The relative risk of CSM was compared to general US female population obtained from CDC WONDER and presented as the SMR, and the 95% confidence intervals (CI) for all SMR were obtained using an approximation based on an assumption of a Poisson regression model [21]. The cumulative incidence curves were plotted for cause-specific deaths overall and stratified by age to show the cumulative incidence of different outcomes in all included patients. Follow-up time for the primary no-landmark analysis was calculated from the date of diagnosis to death or last follow-up. The primary analysis included all eligible patients (n = 255,731), including those who died within the first 3 or 6 months after diagnosis. For the 3-month and 6-month landmark sensitivity analyses, patients who died before the corresponding landmark were excluded, and follow-up was redefined from the respective landmark time (3 or 6 months after diagnosis) to death or last follow-up. Thus, the landmark analyses evaluated subsequent mortality among patients who remained alive at the specified landmark and were intended as sensitivity analyses to assess the robustness of the primary findings to exclusion of early deaths. The 3-month (n = 255,206) and 6-month (n = 253,945) landmark analyses are shown in Tables S1, S2 and S3.
The approximate post-diagnosis time point at which cumulative CSM overtook cumulative BCSM within the 70–85 age stratum was identified by visual and numerical comparison of the non-parametric cumulative incidence function estimates for the two outcomes, taken as the earliest follow-up month from which the CSM cumulative incidence estimate remained above the BCSM estimate through the end of follow-up. The uncertainty of this crossover time was quantified by nonparametric bootstrap resampling with 1,000 replicates.
Finally, Fine-Gray’s competing-risk regression analysis was used to identify the risk factors that significantly correlated with CVD. When treating CVD as the event of interest, death from other causes (including BC) were considered as competing events, and the sub-distribution hazard ratio (SHR) with corresponding 95% CI was acquired. Rather than univariate screening, a prespecified, clinically informed multivariable model was fitted, forcing in all pre-specified covariates, including age, race, marital status, T stage, N stage, ER, PR, HER2, histological grade, surgery type, radiation, and chemotherapy, regardless of univariate significance. This full-model approach is deliberately more inclusive than univariable screening at P < 0.10 or P < 0.15. Since every covariate was forced in irrespective of its univariable P value, no variable meeting such a threshold could have been excluded [22]. As presented in Table S4, collinearity was assessed by variance-inflation factors (all < 2.3), and the proportional-subdistribution-hazards assumption was examined by covariate-by-time interaction. Given the large sample, these interaction tests were highly powered, with marginal departures from proportionality observed. In effect, the SHRs are interpreted as time-averaged effects over the follow-up period. All statistical analyses mentioned above were performed using R software (version 4.5.2). A two-sided P < 0.05 was considered statistically significant.
Between 2010 and 2020, 255,731 (82.56%) female BC patients out of 309,750 diagnosed cases qualified for inclusion in our study. There were 216,895 (84.81%) patients who were alive at last follow-up, 17,210 (6.73%) who died of BCSM, 6,250 (2.44%) who died of CSM, and 15,376 (6.01%) who died of OCM. The median follow-up period was 50 months [interquartile range (IQR): 29–72] for patients in the CSM group and 49 months (IQR: 29–70) for those in the OCM group, respectively. The median follow-up period was shorter for BCSM group patients [40 months (IQR: 24–59)].
As Table 1 shows, a majority of patients were White (n = 5,127, 82.03%), unmarried (n = 3,808, 60.93%), diagnosed with BC at age 70–85 (n = 4,401, 70.42%), ER positive (n = 5,371, 85.94%), PR positive (n = 4,654, 74.46%), HER2 negative (n = 5,589, 89.42%), grade Ⅱ (n = 2,894, 46.30%), stage Ⅰ (n = 3,309, 52.94%), T1 status (n = 3,828, 61.25%), N0 status (n = 4,637, 74.19%) in the CSM group. In terms of treatment, most patients underwent BCT (n = 3,516, 56.26%), but did not receive radiotherapy (n = 3,767, 60.27%) or chemotherapy (n = 5,031, 80.50%). Patient characteristics in the OCM group were similar to those in the CSM group.
Characteristics of all included female BC patients.
| Characteristics | Overall, n (% of total cohort) | Group 1 (alive), n (col %; row %) | Group 2 (BCSM), n (col %; row %) | Group 3 (CSM), n (col %; row %) | Group 4 (OCM), n (col %; row %) | P value* |
|---|---|---|---|---|---|---|
| 255,731 (100%) | 216,895 (100%; 84.81%) | 17,210 (100%; 6.73%) | 6,250 (100%; 2.44%) | 15,376 (100%; 6.01%) | ||
| Age (%) | ||||||
| 18–49 | 53,625 (20.97%) | 48,472 (22.35%; 90.39%) | 4,169 (24.22%; 7.77%) | 146 (2.34%; 0.27%) | 838 (5.45%; 1.56%) | < 0.001 |
| 50–59 | 63,651 (24.89%) | 57,324 (26.43%; 90.06%) | 4,172 (24.24%; 6.55%) | 423 (6.77%; 0.66%) | 1,732 (11.26%; 2.72%) | |
| 60–69 | 73,270 (28.65%) | 64,035 (29.52%; 87.40%) | 4,076 (23.68%; 5.56%) | 1,280 (20.48%; 1.75%) | 3,879 (25.23%; 5.29%) | |
| 70–85 | 65,185 (25.49%) | 47,064 (21.70%; 72.20%) | 4,793 (27.85%; 7.35%) | 4,401 (70.42%; 6.75%) | 8,927 (58.06%; 13.69%) | |
| Race (%) | ||||||
| White | 205,689 (80.43) | 174,811 (80.60%; 84.99%) | 12,973 (75.38%; 6.31%) | 5,127 (82.03%; 2.49%) | 12,778 (83.10%; 6.21%) | < 0.001 |
| Black | 25,221 (9.86) | 19,860 (9.16%; 78.74%) | 2,918 (16.96%; 11.57%) | 786 (12.58%; 3.12%) | 1,657 (10.78%; 6.57%) | |
| Other | 24,821 (9.71) | 22,224 (10.25%; 89.54%) | 1,319 (7.66%; 5.31%) | 337 (5.39%; 1.36%) | 941 (6.12%; 3.79%) | |
| Marital status (%) | ||||||
| Married | 153,722 (60.11) | 135,551 (62.50%; 88.18%) | 8,952 (52.02%; 5.82%) | 2,442 (39.07%; 1.59%) | 6,777 (44.08%; 4.41%) | < 0.001 |
| Unmarried | 102,009 (39.89) | 81,344 (37.50%; 79.74%) | 8,258 (47.98%; 8.10%) | 3,808 (60.93%; 3.73%) | 8,599 (55.92%; 8.43%) | |
| Stage (%) | ||||||
| I | 134,757 (52.69) | 120,518 (55.57%; 89.43%) | 3,021 (17.55%; 2.24%) | 3,309 (52.94%; 2.46%) | 7,909 (51.44%; 5.87%) | < 0.001 |
| II | 93,028 (36.38) | 77,783 (35.86%; 83.61%) | 7,365 (42.79%; 7.92%) | 2,302 (36.83%; 2.47%) | 5,578 (36.28%; 6.00%) | |
| III | 27,946 (10.93) | 18,594 (8.57%; 66.54%) | 6,824 (39.65%; 24.42%) | 639 (10.22%; 2.29%) | 1,889 (12.29%; 6.76%) | |
| T (%) | ||||||
| T1 | 162,053 (63.37) | 143,954 (66.37%; 88.83%) | 4,903 (28.49%; 3.03%) | 3,828 (61.25%; 2.36%) | 9,368 (60.93%; 5.78%) | < 0.001 |
| T2 | 75,017 (29.33) | 60,383 (27.84%; 80.49%) | 7,976 (46.35%; 10.63%) | 1,982 (31.71%; 2.64%) | 4,676 (30.41%; 6.23%) | |
| T3 | 13,547 (5.30) | 9,735 (4.49%; 71.86%) | 2,677 (15.55%; 19.76%) | 277 (4.43%; 2.04%) | 858 (5.58%; 6.33%) | |
| T4 | 5,114 (2.00) | 2,823 (1.30%; 55.20%) | 1,654 (9.61%; 32.34%) | 163 (2.61%; 3.19%) | 474 (3.08%; 9.27%) | |
| N (%) | ||||||
| N0 | 180,765 (70.69) | 158,605 (73.13%; 87.74%) | 6,503 (37.79%; 3.60%) | 4,637 (74.19%; 2.57%) | 11,020 (71.67%; 6.10%) | < 0.001 |
| N1 | 55,266 (21.61) | 45,518 (20.99%; 82.36%) | 5,561 (32.31%; 10.06%) | 1,144 (18.30%; 2.07%) | 3,043 (19.79%; 5.51%) | |
| N2 | 12,461 (4.87) | 8,695 (4.01%; 69.78%) | 2,674 (15.54%; 21.46%) | 286 (4.58%; 2.30%) | 806 (5.24%; 6.47%) | |
| N3 | 7,239 (2.83) | 4,077 (1.88%; 56.32%) | 2,472 (14.36%; 34.15%) | 183 (2.93%; 2.53%) | 507 (3.30%; 7.00%) | |
| ER (%) | ||||||
| Negative | 40,892 (15.99) | 31,528 (14.54%; 77.10%) | 6,023 (35.00%; 14.73%) | 879 (14.06%; 2.15%) | 2,462 (16.01%; 6.02%) | < 0.001 |
| Positive | 214,839 (84.01) | 185,367 (85.46%; 86.28%) | 11,187 (65.00%; 5.21%) | 5,371 (85.94%; 2.50%) | 12,914 (83.99%; 6.01%) | |
| PR (%) | ||||||
| Negative | 67,040 (26.22) | 52,736 (24.31%; 78.66%) | 8,482 (49.29%; 12.65%) | 1,596 (25.54%; 2.38%) | 4,226 (27.48%; 6.30%) | < 0.001 |
| Positive | 188,691 (73.78) | 164,159 (75.69%; 87.00%) | 8,728 (50.71%; 4.63%) | 4,654 (74.46%; 2.47%) | 11,150 (72.52%; 5.91%) | |
| HER2 (%) | ||||||
| negative | 219,558 (85.86) | 185,902 (85.71%; 84.67%) | 14,435 (83.88%; 6.57%) | 5,589 (89.42%; 2.55%) | 13,632 (88.66%; 6.21%) | < 0.001 |
| positive | 36,173 (14.14) | 30,993 (14.29%; 85.68%) | 2,775 (16.12%; 7.67%) | 661 (10.58%; 1.83%) | 1,744 (11.34%; 4.82%) | |
| Grade (%) | ||||||
| Ⅰ | 61,703 (24.13) | 55,075 (25.39%; 89.26%) | 1,189 (6.91%; 1.93%) | 1,645 (26.32%; 2.67%) | 3,794 (24.67%; 6.15%) | < 0.001 |
| Ⅱ | 114,013 (44.58) | 98,438 (45.39%; 86.34%) | 5,685 (33.03%; 4.99%) | 2,894 (46.30%; 2.54%) | 6,996 (45.50%; 6.14%) | |
| Ⅲ | 79,341 (31.03) | 62,860 (28.98%; 79.23%) | 10,245 (59.53%; 12.91%) | 1,700 (27.20%; 2.14%) | 4,536 (29.50%; 5.72%) | |
| Ⅳ | 674 (0.26) | 522 (0.24%; 77.45%) | 91 (0.53%; 13.50%) | 11 (0.18%; 1.63%) | 50 (0.33%; 7.42%) | |
| Surgery (%) | ||||||
| BCT | 146,405 (57.25) | 128,189 (59.10%; 87.56%) | 6,082 (35.34%; 4.15%) | 3,516 (56.26%; 2.40%) | 8,618 (56.05%; 5.89%) | < 0.001 |
| ME | 109,326 (42.75) | 88,706 (40.90%; 81.14%) | 11,128 (64.66%; 10.18%) | 2,734 (43.74%; 2.50%) | 6,758 (43.95%; 6.18%) | |
| Radiation (%) | ||||||
| No/Unknown | 118,710 (46.42) | 97,647 (45.02%; 82.26%) | 8,651 (50.27%; 7.29%) | 3,767 (60.27%; 3.17%) | 8,645 (56.22%; 7.28%) | < 0.001 |
| Yes | 137,021 (53.58) | 119,248 (54.98%; 87.03%) | 8,559 (49.73%; 6.25%) | 2,483 (39.73%; 1.81%) | 6,731 (43.78%; 4.91%) | |
| Chemotherapy (%) | ||||||
| No/Unknown | 150,464 (58.84) | 128,118 (59.07%; 85.15%) | 5,891 (34.23%; 3.92%) | 5,031 (80.50%; 3.34%) | 11,424 (74.30%; 7.59%) | < 0.001 |
| Yes | 105,267 (41.16) | 88,777 (40.93%; 84.34%) | 11,319 (65.77%; 10.75%) | 1,219 (19.50%; 1.16%) | 3,952 (25.70%; 3.75%) | |
Percentages in the overall column represent the percentage of the total analytic cohort (n = 255,731). Within each outcome-group column, the first percentage (before the semicolon) is the column percentage, indicating the proportion within that outcome group’s own total; the second percentage (after the semicolon) is the row percentage, indicating the proportion of each characteristic level falling into that outcome group, summing approximately to 100% across Groups 1–4 for that row. *: Chi-square tests were used to compare the distribution of all categorical variables across the four outcome groups (alive, BCSM, CSM, OCM). As age, race, marital status and all clinicopathological variables in this table are presented in categorical form, no separate test for continuous variables was required. BC: breast cancer; BCSM: breast cancer-specific mortality; BCT: breast-conserving therapy; CSM: cardiovascular-specific mortality; ER: estrogen receptor; HER2: human epidermal growth factor receptor 2; ME: mastectomy; OCM: other cause mortality; PR: progesterone receptor.
Some obvious differences can be found in the BCSM group, patients’ age at diagnosis was largely concentrated between 18–59 years old (n = 8,341, 48.46%), a majority of patients were married (n = 8,952, 52.02%), grade Ⅲ/Ⅳ (n = 10,336, 60.06%), stage Ⅱ (n = 7,365, 42.79%), T2 status (n = 7,976, 46.35%), N1 status (n = 5,561, 32.31%), underwent ME (n = 11,128, 64.66%), and received chemotherapy therapy (n = 11,319, 65.77%).
To ensure optimum comparability between the CDC and SEER databases, the analysis was limited to the US-based population. Consistency in baseline characteristics was ensured via the standardization of the selection criteria across datasets, including age, gender, year of diagnosis, and CVD-related causes of death. From 2009 to 2019, the cardiovascular-related mortality rate of the general female population aged 18–85 in the US was 146.8 (/100,000). The reference period was restricted to 2009–2019 to preclude potential distortion of baseline cardiovascular mortality rates attributable to the COVID-19 pandemic, which is well-documented to have caused anomalous elevation of cardiovascular-related deaths in the general US population in 2020 [20]. The cardiovascular-related mortality rates per 100,000 of the general American female population aged 18–49, 50–59, 60–69, and 70–85 were 14.9 (/100,000), 92.4 (/100,000), 231.2 (/100,000), and 1,035.3 (/100,000), respectively.
At the same time, using the data collected from the SEER database in this study, the corresponding patient person-years for the entire group of patients and each age subgroup can be calculated as: 1,576,158.16, 338,596.83, 402,364.08, 458,182.17, and 377,015.08, respectively. The expected numbers of cardiovascular deaths were calculated using indirect standardization: age-group-specific CDC WONDER mortality rates (per 100,000 person-years) were first converted to rates per person-year, then multiplied by the corresponding SEER cohort person-years at risk within that same age stratum; the resulting expected deaths were summed across the four age strata to obtain the total expected deaths. Standardization was performed by age group only; calendar year, attained age during follow-up, and cumulative follow-up time were not separately incorporated into the expected-death calculation.
The overall age-standardized SMR for CSM was 1.16 (95% CI: 1.13–1.19), as displayed in Figure 1 and Table 2. Although the overall excess was modest, the risk of CSM was higher in BC patients than in the general female population across all age groups, with the relative excess greatest in the youngest stratum. The risk of CSM was higher in BC patients across all age groups than it was in the general female population (< 50 years, SMR = 2.894, P < 0.001; 50–59 years, SMR = 1.138, P < 0.001; 60–69 years, SMR = 1.208, P < 0.001; 70–85 years, SMR = 1.128, P < 0.001). The fact that CVD mortality was significantly higher among patients under the age of 50 (SMR = 2.894, 95% CI: 2.461–3.404) likely reflects the low rate of CVD death in the general female population at these ages.
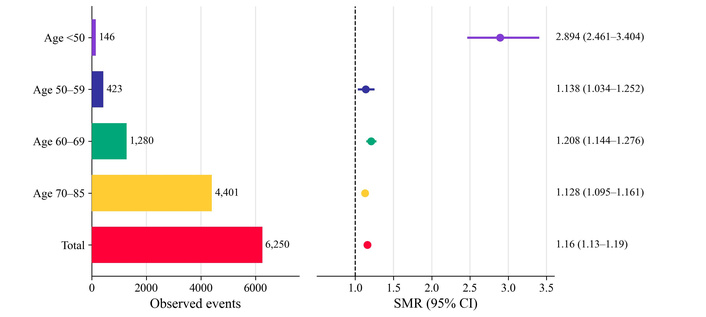
The observed event numbers and SMR for overall cohort and age subgroups. CI: confidence intervals; SMR: standardized mortality ratio.
Risk of CSM compared with the age-adjusted US female population.
| Age at diagnosis | Observed deaths | Expected deaths | Person-years at risk | SMR (95% CI) |
|---|---|---|---|---|
| Total | 6,250 | 5,384.79 | 1,576,158.16 | 1.16* (1.13–1.19) |
| < 50 | 146 | 50.45 | 338,596.83 | 2.894* (2.461–3.404) |
| 50–59 | 423 | 371.78 | 402,364.08 | 1.138* (1.034–1.252) |
| 60–69 | 1,280 | 1,059.32 | 458,182.17 | 1.208* (1.144–1.276) |
| 70–85 | 4,401 | 3,903.24 | 377,015.08 | 1.128* (1.095–1.161) |
*: SMR with P < 0.05. CI: confidence intervals; CSM: cardiovascular-specific mortality; SMR: standardized mortality ratio; US: United States.
The hazard curves demonstrated that the risk of BCSM and CSM changed over time, as illustrated in Figure 2. Given that the risk of BCSM grew significantly and peaked within the third year following surgery, it is likely that prognostic factors that contribute to BCSM will have a different effect. Similar to BCSM, the hazard of CSM has not yet peaked and has increased far more slowly. The higher risk of CSM among BC survivors does not become apparent until several years following diagnosis, according to these findings as well.
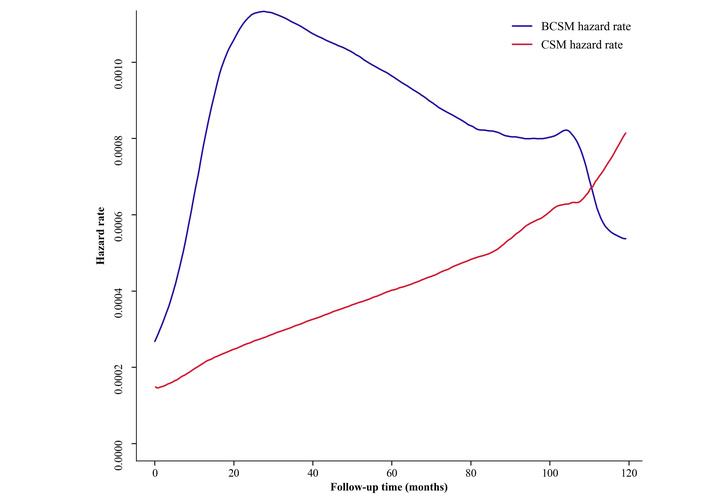
Hazard curves of cancer-specific death and heart-specific death over time. BCSM: breast cancer-specific mortality; CSM: cardiovascular-specific mortality.
The cumulative mortalities for all causes of death among BC patients included in this study are illustrated in Figure 3 and Table 3. By far the highest cumulative mortality of death was caused by BC, followed by OCM. CSM was lower than cumulative mortality due to OCM at all three time points. The cumulative incidences of BCSM, CSM and OCM were 3.09% (95% CI: 3.02–3.16%), 0.84% (95% CI: 0.80–0.87%) and 2.10% (95% CI: 2.04–2.16%), respectively, at the thirty-six months after diagnosis. At 60 months after diagnosis, the cumulative incidences were 5.35% (95% CI: 5.26–5.44%), 1.61% (95% CI: 1.57–1.67%), and 4.06% (95% CI: 3.98–4.14%), respectively. At 84 months after diagnosis, the cumulative incidences were 7.16% (95% CI: 7.05–7.27%), 2.53% (95% CI: 2.46–2.60%), and 6.28% (95% CI: 6.17–6.38%), respectively.
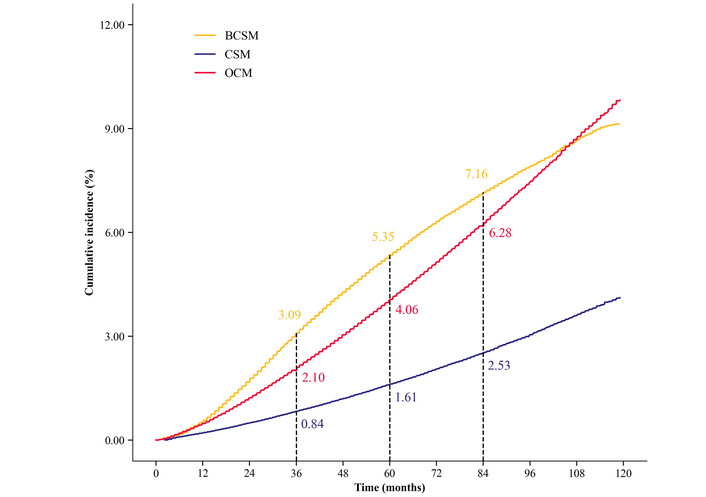
The cumulative incidence curves for BCSM, CSM, and OCM by age at diagnosis. BCSM: breast cancer-specific mortality; CSM: cardiovascular-specific mortality; OCM: other cause mortality.
Cumulative incidences and corresponding confidence intervals of different death causes.
| Characteristics | Diagnosis months | Cumulative incidences of different death causes | ||
|---|---|---|---|---|
| BCSM | CSM | OCM | ||
| Total | 36 months | 3.09% (95% CI: 3.02–3.16%) | 0.84% (95% CI: 0.80–0.87%) | 2.10% (95% CI: 2.04–2.16%) |
| 60 months | 5.35% (95% CI: 5.26–5.44%) | 1.61% (95% CI: 1.57–1.67%) | 4.06% (95% CI: 3.98–4.14%) | |
| 84 months | 7.16% (95% CI: 7.05–7.27%) | 2.53% (95% CI: 2.46–2.60%) | 6.28% (95% CI: 6.17–6.38%) | |
| Age at diagnosis | ||||
| < 50 | 36 months | 3.54% (95% CI: 3.39–3.70%) | 0.10% (95% CI: 0.07–0.13%) | 0.61% (95% CI: 0.54–0.68%) |
| 60 months | 6.17% (95% CI: 5.96–6.38%) | 0.19% (95% CI: 0.16–0.24%) | 1.14% (95% CI: 1.05–1.24%) | |
| 84 months | 8.25% (95% CI: 8.00–8.51%) | 0.29% (95% CI: 0.24–0.35%) | 1.62% (95% CI: 1.51–1.75%) | |
| 50–59 | 36 months | 2.84% (95% CI: 2.71–2.97%) | 0.22% (95% CI: 0.18–0.26%) | 1.04% (95% CI: 0.96–1.12%) |
| 60 months | 5.15% (95% CI: 4.97–5.32%) | 0.41% (95% CI: 0.36–0.46%) | 1.90% (95% CI: 1.79–2.01%) | |
| 84 months | 7.13% (95% CI: 6.91–7.35%) | 0.69% (95% CI: 0.62–0.77%) | 2.82% (95% CI: 2.69–2.97%) | |
| 60–69 | 36 months | 2.47% (95% CI: 2.36–2.58%) | 0.62% (95% CI: 0.57–0.68%) | 1.78% (95% CI: 1.69–1.88%) |
| 60 months | 4.31% (95% CI: 4.16–4.46%) | 1.18% (95% CI: 1.10–1.26%) | 3.50% (95% CI: 3.37–3.64%) | |
| 84 months | 5.86% (95% CI: 5.68–6.05%) | 1.78% (95% CI: 1.68–1.89%) | 5.42% (95% CI: 5.24–5.61%) | |
| 70–85 | 36 months | 3.68% (95% CI: 3.53–3.82%) | 2.28% (95% CI: 2.17–2.40%) | 4.69% (95% CI: 4.53–4.86%) |
| 60 months | 6.04% (95% CI: 5.86–6.23%) | 4.43% (95% CI: 4.27–4.60%) | 9.14% (95% CI: 8.92–9.37%) | |
| 84 months | 7.74% (95% CI: 7.52–7.97%) | 6.98% (95% CI: 6.76–7.20%) | 14.38% (95% CI: 14.07–14.69%) | |
BCSM: breast cancer-specific mortality; CI: confidence intervals; CSM: cardiovascular-specific mortality; OCM: other cause mortality.
Stratified by age groups, women aged younger had the highest cumulative BCSM compared with CSM and OCM. Nevertheless, it was observed that cumulative CSM steadily increased with age at diagnosis and length of follow-up. These age-stratified patterns are demonstrated in Figure 4. In the oldest age group (70–85 years), cumulative CSM had not yet overtaken cumulative BCSM at 7 years (84 months; 6.98% vs. 7.74%). The two curves crossed later, at approximately 8 years (97 months) after diagnosis. While the 95% CI for cumulative BCSM and CSM in this age cohort are clearly separated at 84 months, they converge and overlap as the crossover is approached, as shown in Table 3. The uncertainty of this crossover time was quantified by nonparametric bootstrap resampling with 1,000 replicates, which placed the crossover at approximately 97 months (95% CI: 91–101 months). This crossover time should therefore be interpreted as an approximate, exploratory landmark rather than a precisely bounded threshold.
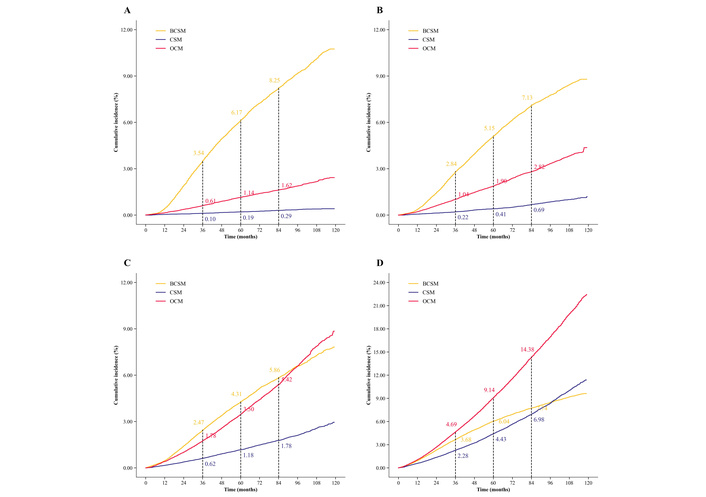
The cumulative incidence curves for BCSM, CSM and OCM stratified by age at diagnosis (A, < 50 years; B, 50–59 years; C, 60–69 years; D, 70–85 years). BCSM: breast cancer-specific mortality; CSM: cardiovascular-specific mortality; OCM: other cause mortality.
Since SEER lacks data on established cardiovascular risk factors such as hypertension, diabetes, hyperlipidemia, smoking, and body mass index, the following associations should be interpreted as factors independently associated with CSM after adjustment for the measured covariates, rather than as fully independent or causal predictors.
As shown in Table 4, in the univariate analysis, age at BC diagnosis, race, marital status, T stage, N stage, ER status, HER2 status, histological grade, radiation, and chemotherapy were substantially linked with CSM (P < 0.05). Through further multivariable analysis, age, race, marital status, T stage, N stage, radiation and chemotherapy remained associated with CSM after adjustment for the measured covariates in the pre-specified model. Progesterone-receptor status was not associated with CSM after adjustment (SHR 0.97, 95% CI 0.90–1.04), whereas surgery type showed a modest association (ME vs. BCT, SHR 0.90, 95% CI 0.85–0.96). Variance-inflation factors indicated no material collinearity (all < 2.3) (Table 4).
Univariate and multivariable Fine-Gray competing risk analysis for CSM in patients with BC.
| Characteristics | CSM | |||
|---|---|---|---|---|
| Univariate analysis | Multivariable analysis | |||
| SHR (95% CI) | P value | SHR (95% CI) | P value | |
| Age | ||||
| 18–49 | Reference | |||
| 50–59 | 2.45 (2.03–2.95) | < 0.001 | 2.37 (1.96–2.86) | < 0.001 |
| 60–69 | 6.47 (5.45–7.68) | < 0.001 | 6.01 (5.06–7.14) | < 0.001 |
| 70–85 | 25.60 (21.71–30.19) | < 0.001 | 19.37 (16.37–22.91) | < 0.001 |
| Race | ||||
| White | Reference | |||
| Black | 1.25 (1.16–1.35) | < 0.001 | 1.37 (1.27–1.48) | < 0.001 |
| Other | 0.56 (0.50–0.62) | < 0.001 | 0.73 (0.65–0.81) | < 0.001 |
| Marital status | ||||
| Married | Reference | |||
| Unmarried | 2.36 (2.24–2.48) | < 0.001 | 1.59 (1.51–1.68) | < 0.001 |
| T (%) | ||||
| T1 | Reference | |||
| T2 | 1.13 (1.07–1.19) | < 0.001 | 1.32 (1.24–1.40) | < 0.001 |
| T3 | 0.87 (0.77–0.98) | 0.003 | 1.23 (1.08–1.40) | 0.002 |
| T4 | 1.36 (1.16–1.59) | < 0.001 | 1.60 (1.35–1.89) | < 0.001 |
| N (%) | ||||
| N0 | Reference | |||
| N1 | 0.80 (0.75–0.86) | < 0.001 | 1.12 (1.04–1.20) | 0.002 |
| N2 | 0.87 (0.77–0.98) | 0.022 | 1.29 (1.14–1.47) | < 0.001 |
| N3 | 0.96 (0.83–1.12) | 0.610 | 1.34 (1.15–1.57) | < 0.001 |
| ER (%) | ||||
| Negative | Reference | |||
| Positive | 1.18 (1.09–1.26) | < 0.001 | 0.96 (0.87–1.06) | 0.386 |
| PR (%) | ||||
| Negative | Reference | |||
| Positive | 1.05 (0.99–1.11) | 0.100 | 0.97 (0.90–1.04) | 0.364 |
| HER2 (%) | ||||
| Negative | Reference | |||
| Positive | 0.73 (0.67–0.79) | < 0.001 | 1.01 (0.93–1.10) | 0.800 |
| Grade (%) | ||||
| Ⅰ | Reference | |||
| Ⅱ | 0.95 (0.90–1.01) | 0.110 | 1.01 (0.95–1.07) | 0.804 |
| Ⅲ | 0.80 (0.74–0.85) | < 0.001 | 1.08 (1.00–1.17) | 0.053 |
| Ⅳ | 0.55 (0.30–0.98) | 0.044 | 0.72 (0.40–1.31) | 0.284 |
| Surgery (%) | ||||
| BCT | Reference | |||
| ME | 1.02 (0.97–1.07) | 0.440 | 0.90 (0.85–0.96) | < 0.001 |
| Radiation (%) | ||||
| No/Unknown | Reference | |||
| Yes | 0.56 (0.54–0.59) | < 0.001 | 0.64 (0.61–0.68) | < 0.001 |
| Chemotherapy (%) | ||||
| No/Unknown | Reference | |||
| Yes | 0.34 (0.32–0.36) | < 0.001 | 0.59 (0.55–0.64) | < 0.001 |
BC: breast cancer; BCT: breast-conserving therapy; CI: confidence intervals; CSM: cardiovascular-specific mortality; ER: estrogen receptor; HER2: human epidermal growth factor receptor 2; ME: mastectomy; PR: progesterone receptor; SHR: sub-distribution hazard ratio.
In detail, CSM increased most strongly with age, with SHR (95% CI) as high as 2.37 (1.96–2.86), 6.01 (5.06–7.14), and 19.37 (16.37–22.91) for patients aged 50–59, 60–69, and 70–85 relative to patients aged 18–49, respectively. Black patients faced a higher risk [Black versus White: SHR = 1.37 (1.27–1.48)], but other racial groups had a lower risk of CSM [other races versus White: SHR = 0.73 (0.65–0.81)]. Married women have a lower risk of cardiovascular death compared to unmarried women [unmarried patients versus married patients: SHR = 1.59 (1.51–1.68)].
CSM also increased with larger tumor size and more positive lymph nodes [T4 stage: SHR = 1.60 (1.35–1.89), N3 stage: SHR = 1.34 (1.15–1.57)]. Patients receiving chemotherapy and radiation demonstrated a low risk of CSM relative to patients who did not receive chemotherapy or radiation [SHR = 0.59 (0.55–0.64), and 0.64 (0.61–0.68), respectively].
One key and actionable finding revealed in this study is the defined mortality crossover point for early-stage BC women aged 70–85, with cumulative mortality from CVD noted to have exceeded cumulative mortality specifically associated with BC at about 8 years following diagnosis of BC. This outcome addresses a knowledge gap that had not been characterized by previously reported population-based studies, particularly regarding the stage in the span of survivorship at which CVD crosses the threshold from “competing risk” to “primary cause of death”, and the cohort among which the crossover is associated earliest. The identified threshold shifts the clinical focus from considering cardiovascular surveillance as an independent and parallel concern alongside cancer recurrence surveillance, to a time-sensitive and age-stratified, escalating priority as survivors approach the 8-year mark following diagnosis.
By utilizing a large, comprehensive representative dataset retrieved from the SEER database, this study offered extensive population-based analysis of the risk of CSM among early-stage BC women in the US, comparatively assessing CSM risk relative to age-corresponding data of the general population extracted from CDC WONDER. Our study showed that women with early-stage BC are at an increased risk of CSM compared to the general US female population [SMR = 1.16 (95% CI: 1.13–1.19)], with some demographic and clinicopathological factors further identified as significant determinants of CVD-associated mortality risk in patients with early-stage BC via competing-risk regression-based modelling. Our study showed a modestly increased overall risk of CSM [age-standardized SMR = 1.16 (95% CI: 1.13–1.19)], with a pronounced age gradient in the relative excess. This overall estimate is closely comparable to the pooled figure reported by Ng et al. [23] [SMR = 1.55 (95% CI: 1.40–1.72)], while our stratified analysis additionally reveals that the relative excess is concentrated in younger survivors (SMR = 2.894 in women < 50) and is comparatively modest at older ages, even though the absolute burden is greatest in the oldest stratum [15, 23, 24]. Considering the collective burden of cardiotoxicity and commonly occurring cardiometabolic risk factors, the observed incidence of relatively increased SMR among the BC cohort of our study may be indicative of the population’s notable susceptibility. Another previous study similarly reported an increased tendency for the incidence of CVD associated death relative to women without BC, with age, race, and region being noted as accounting for persistent disparities [24]. Overall, these consistent outcomes emphasize the critical risk of CVD related mortality in BC survivors and consequently underscore the need for preventive monitoring of cardiovascular health as a key routine component of care among long-term BC survivors. In addition, a remarkable association between CSM risk and age at diagnosis was observed in this study, with the increased risk noted across all age categories. Particularly, CSM risk was found to be most prominent in patients aged 70–85 at diagnosis (SHR = 19.37, 95% CI: 16.37–22.91) relative to the age group 18–49, following the study’s multivariable competing risk analysis, which showed a sharp, increasing gradient in CSM with increasing age. Generally, age is an established single strongest determinant of CVD [25], with high baseline CVD burdens more prevalent in advanced ages, as demonstrated in our study, with worsening of comorbidity burdens further associated with exposure to treatment regimens [26]. However, consistent with a study by Vo et al. [27], which reported disproportionately increased cardiomyopathy and heart failure risk in younger BC survivors (age group 20–54 years) with anthracyclines and/or trastuzumab exposures, it is interesting to note that women aged 18–49 years, our study’s youngest age group, exhibited the highest relative SMR. This may be the result of the extremely small absolute incidence of CVD associated death among this demographic subgroup of the general population, and hence accounts for comparatively strong increase even with small absolute excess in BC survivors. This finding provides additional emphasis on the need for age-targeted CVD monitoring practices and as well underscore the demand for prompt and sustained clinical attention towards younger BC survivors as they may also be associated with equally significant relative risk even though overwhelming risk is notably associated with older women.
Furthermore, by employing cumulative incidence analysis, we provided additional context to the population’s temporal dynamics in relation to the risk of CVD. Contrary to BCSM, which was associated with steeply elevated hazard curves that peaked in the first 3 years after surgery, CSM exhibited a steady increase that had not peaked at the time of follow up. The observed disparity significantly informs considerations towards the planning of survivorship, including the need to prioritize perioperative BCSM-targeted initiatives, whereas prolonged, long-term engagement is needed to decrease risk of CVD. Despite the respective modesty of this study’s approximated cumulative CSM (0.84% and 1.61% at 36 months and 60 months, respectively), they reflect a significant clinical burden across the population, particularly considering the magnitude of BC survivals in the US. Cumulative CVD related deaths surpassed cumulative BC related deaths about 8 years post diagnosis, among the 70–85 years age group.
To the best of our knowledge, this is one of the first population-based studies to precisely ascertain, in a large cohort of surgically treated early-stage BC patients, the specific post-diagnosis time point at which cumulative CVD mortality overtakes BCSM, which is a survivorship period that has not been defined in previously reported studies identifying cumulative CVD risk alone. Considering its potential clinical significance, the observed temporal pattern may support closer consideration of cardiovascular risk assessment during the first 5 years following diagnosis in older survivors, although this interval should be regarded as exploratory and should not be interpreted as a validated threshold for initiating specific cardiovascular interventions. Ultimately, given the observational design, prospective studies are needed before specific risk-escalation algorithms or referral thresholds can be recommended. While a similar crossover was not observed in younger survivors within the study’s follow-up timeframe, the sustained elevated relative SMR demands continued, but differentiated surveillance approaches should account for age-specific surveillance and the varying absolute and relative risk patterns across various age groups. This finding is also consistent with the outcome of previous studies among older BC patients [11], further emphasizing the need to accord significant care in the long term to the management of cardiometabolic risk among this age cohort, beyond the conventional focus on recurrence of cancer.
Another clinically significant outcome identified in this study is racial disparities in CSM. A 37% increased CSM risk was noted in black patients relative to white women, with women of other races demonstrating remarkably reduced risk. This is in agreement with previously reported research that highlights CVD prognostic disparities within BC survivorship populations, including a study by Vo et al. [28] which reported racial and ethnic heterogeneity in CVD caused mortality as associated with treatment exposures. These findings underscore the multifaceted drawbacks encountered by BC survivors of the black race, including greater baseline non-isolated CVD burden, increased incidence of known CVD risk factors among black women, complications from specific treatment exposures, as well as disparities in access to healthcare due to systemic barriers such as socioeconomic challenges, subpar cardiovascular screening, and inadequate access to cardiovascular and oncology care [24, 28, 29]. Ho et al. [30] also previously reported 41% increased CVD related mortality among BC survivors in counties of the lowest socioeconomic status in comparison with counties of the highest socioeconomic status. Consequently, this reflects a clinical and equitable healthcare access challenge among black women with BC survivorship and in effect, demands initiatives that target both structural and biomedical risk concerns that challenge optimal care.
Additionally, the study’s multivariable model identified marital status as a determinant of CSM, with 60% higher CVD related death associated with unmarried women relative to married women, which aligned with previously reported studies [31]. The underlying influence of marital status on the likely incidence of CSM may be accounted for by multifaceted factors such as decreased social support, suboptimal preventive medications and lifestyle modification compliance, higher psychological stress, as well as a likely attitude of poor urgency in seeking healthcare [32]. It is vital to give particular consideration to social determinants of health such as marital status when stratifying CVD risk among BC survivors and developing personalized follow-up interventions.
Furthermore, our study highlighted tumor size and nodal involvement, being indicative of disease burden, as independently associated with CSM, with increased risk of CSM observed in patients associated with T4 stage tumors and N3 stage nodal involvement. Considering that higher incidence of death specifically linked with BC is a prominent occurrence associated with more advanced disease, this study’s observed relationship appeared paradoxical. Nonetheless, the exposure to treatment interventions such as anthracycline-based chemotherapy and extended radiotherapy, which are associated with inherent cardiotoxicity among patients with locally advanced disease, may account for the study’s observed relationship. In effect, personalized classification of risk for BC survivorship must be based on the critical consideration of the interplay between tumor burden, intensity of treatment, and CVD risk. Beyond treatment-related cardiotoxicity, biological mechanisms may also link advanced tumor burden directly to cardiovascular risk. Larger, more locally advanced tumors are associated with a heightened systemic inflammatory and prothrombotic state, characterised by elevated circulating cytokines, C-reactive protein and coagulation factors, which contribute to endothelial dysfunction and accelerated atherosclerosis. Advanced BC and CVD also share upstream metabolic drivers, including insulin resistance, chronic low-grade inflammation and dyslipidemia, such that patients presenting with more advanced disease may already carry a higher baseline cardiometabolic risk burden independent of treatment exposure.
Importantly, cautious interpretation is needed for the relationships between treatment approaches and CSM. Exposures to chemotherapy and radiotherapy were noted to be significantly linked with decreased CSM relative to non-exposed cohort. This was another counterintuitive observation in our study and may be attributed to a couple of underlying mechanisms, including the ‘healthy patient’ bias [33], the event where patients may be marked by healthier baselines prior to exposure to systemic therapy or radiotherapy in a real-world clinical setting in comparison to non-exposed patients [33]. Another underlying explanation for such paradox is that only administration of initial course chemotherapy and radiotherapy is represented as binary variables in the SEER database, with missing data on specific agents, cumulative doses, and later treatment regimens. The lack of dosimetric information represents a significant drawback, particularly because the cardiotoxicity of anthracyclines is notably characterized by a dose-response relationship, with the concomitant administration of trastuzumab significantly influencing the intensity of the risk associated with trastuzumab [27]. Also, a higher degree of oncological follow-up care received by patients who undergo treatment improves the probability of prompt detection of CVD risk factors and consequent administration of timely interventions. Therefore, it is necessary that the relationship between treatment exposures and the conferred protection observed in SEER analysis is interpreted as a reflection of bias from complex selection and underlying downsides associated with retrospective registry data, rather than regarded as a direct indication of cardioprotective effects.
In addition to the cardiotoxicity associated with direct treatment exposures, common risk factors and underlying mechanisms to both BC and CVD include overweight and obesity, insulin resistance, chronic inflammation, hypertension, dyslipidemia, and hypercoagulability, with these factors being improvable [34]. The cumulative incidence of these risk factors among BC survivors of older ages, especially in patients associated with concomitant CVD complications resulting from treatment exposures, presents limitations to models built for conventional single disease risk stratification [35]. Therefore, as recommended by the 2022 European Society of Cardiology (ESC) cardio-oncology guidelines, systematic incorporation of a multifaceted approach involving cardio-oncology specialties is vital to ensure optimum management of populations of such complex nature as this [35].
Notably, our study is associated with several strengths. The outcome of the study offers significant statistical power and generalizability, as we employed an extensive registry (SEER) that optimally represents the BC population in the US, on a national scale. Also, leveraging the general population through CDC WONDER for comparative assessment enabled robust standardization of CSM risk stratification using SMR analysis. This study further employed Fine-Gray competing risk regression, enabling the addressing of competing BC-specific risk and other-cause related deaths, which is often missed during studies involving the analysis of BC survivals, despite its significant role in ensuring unbiased assessment of CVD-specific risk among this population. We mitigated confounding from unmeasured baseline CVD comorbidities by limiting the cohort to patients who underwent surgery as an internal control. The primary analysis applied ‘no landmark’ restriction, and hence patients who died within the first months after diagnosis were retained, thus avoiding immortal-time or healthy-survivor selection. To confirm that this choice did not materially influence the findings, we repeated the analysis using 3-month and 6-month landmarks as presented in Tables S1–S3. The SMR, cumulative incidence, and CSM-BCSM crossover remained materially unchanged. Numbers at risk by age group and follow-up interval are provided beneath Figure 4. Follow-up was nonetheless shorter for patients diagnosed closer to 2020, such that estimates in the final months, including the crossover, rest on a progressively diminishing risk set and should therefore be interpreted as exploratory.
Despite the strengths noted, several limitations were identified in the study. Granular data relating to individual chemotherapeutic agents, cumulative drug doses, radiation field and dosing details, or follow-up treatments. However, these data were lacking in the SEER registry. Another noted limitation is that the SEER database lacked data on vital risk factors of CVD, such as diabetes, hypertension, hyperlipidemia, smoking, body mass index, and baseline cardiac function. The study’s findings on absolute and comparative risk estimates may be impacted by these unmeasured confounders. Additionally, the study may be limited by generalizability outside the US population, especially in cohorts characterized by varying healthcare systems, racial compositions, and BC treatment protocols. External validation in differently characterized populations is therefore recommended. Even though the incidence of competing outcomes at individual level may be accounted for by competing risk models, the study may still be associated with possible residual confounding from unmeasured patient variables. Also, careful interpretation is needed for the causal relationship between higher prevalence CVD related deaths and exposure to specific treatment modalities, particularly considering the lack of differentiation of CVD mortality directly consequent to BC treatment exposure from CVD mortality underlying or incidental CVD comorbidities. In addition, cause of death in SEER is based on death certificates coded to ICD-10. It is noteworthy that misclassification of the underlying cause of death is a known limitation of registry-based mortality studies and may have led to under- or over-estimation of the SMR and cumulative incidence estimates of CSM. Furthermore, the SMR analysis compared SEER cohort person-years accrued largely between 2010 and 2020 against CDC WONDER reference mortality rates restricted to 2009–2019. While this restriction was applied to avoid the anomalous 2020 COVID-19-related mortality spike, it introduces a partial temporal mismatch with the diagnosis window of the SEER cohort that could not be resolved through sensitivity analysis within the scope of this study. It is therefore a necessary recommendation that both should be reported in future analyses to further support the identified crossover point.
In conclusion, this large population-based analysis showed that early-stage BC women in the US, particularly those aged 70–85, experienced significantly elevated CSM relative to the age-matched general population, with an approximate, exploratory crossover between cardiovascular-specific and breast-cancer-specific mortality at about 8 years (97 months). Older age, Black race, unmarried status, and advanced T and N stage were independently associated with increased CSM after adjustment for measured covariates. The apparent association of radiotherapy and chemotherapy with lower CSM (SHR = 0.64 and 0.59) is most plausibly explained by healthy-patient selection and residual confounding rather than a cardioprotective effect, given the absence of granular treatment and cardiovascular risk-factor data in SEER. These findings suggest that age-stratified cardiovascular risk assessment may warrant increasing attention during longer-term survivorship, particularly from approximately 5 years after diagnosis and among patients with demographic or tumor characteristics associated with higher CSM in this study. However, the approximately 5-year period should be regarded as an exploratory interval rather than a prescriptive clinical threshold, and the observed associations should not be interpreted as establishing specific referral criteria. Prospective studies and external validation are needed to determine whether these findings can inform clinically actionable timing and risk-stratification strategies.
AJCC: American Joint Committee on Cancer
BC: breast cancer
BCSM: breast cancer-specific mortality
BCT: breast-conserving therapy
CDC WONDER: Centers for Disease Control and Prevention’s Wide-ranging Online Data for Epidemiologic Research
CI: confidence intervals
CSM: cardiovascular-specific mortality
CVD: cardiovascular disease
ER: estrogen receptor
HER2: human epidermal growth factor receptor 2
ICD-10: International Classification of Diseases, tenth Revision
IQR: interquartile range
ME: mastectomy
NOS: not otherwise specified
OCM: other cause mortality
PR: progesterone receptor
SEER: Surveillance, Epidemiology, and End Results
SHR: sub-distribution hazard ratio
SMR: standardized mortality ratio
US: United States
The supplementary tables for this article are available at: https://www.explorationpub.com/uploads/Article/file/1012126_sup_1.pdf.
ND: Conceptualization, Methodology, Data curation, Formal analysis, Writing—original draft, Writing—review & editing. EDKF: Conceptualization, Methodology, Data curation, Formal analysis, Visualization, Writing—original draft, Writing—review & editing. EJI: Writing—review & editing. YZ: Writing—review & editing. ZGK: Writing—review & editing. JZ: Funding acquisition, Supervision, Writing—review & editing. All authors read and approved the submitted version.
The authors declare that this study is associated with no significant financial and non-financial interests that may account for the perception of conflict of interest or its potential thereof.
This study employed publicly available, de-identified data from the National Cancer Institute’s Surveillance, Epidemiology, and End Results (SEER) Program. This study was therefore exempt from review by an institutional review board (IRB).
Not applicable.
Not applicable.
The datasets that support the findings of this study are available from the corresponding author upon reasonable request.
This work was supported by the National Natural Science Foundation of China [82173899]; the Jiangsu Pharmaceutical Association [H202108, A2021024, Q202202, JY202207, Z04JKM2023E040], Top Talent of Changzhou “The 14th Five-Year Plan” High-Level Health Talents Training Project [2022CZBJ04]. The funders had no role in study design, data collection and analysis, decision to publish, or preparation of the manuscript.
© The Author(s) 2026.
Open Exploration maintains a neutral stance on jurisdictional claims in published institutional affiliations and maps. All opinions expressed in this article are the personal views of the author(s) and do not represent the stance of the editorial team or the publisher.
Copyright: © The Author(s) 2026. This is an Open Access article licensed under a Creative Commons Attribution 4.0 International License (https://creativecommons.org/licenses/by/4.0/), which permits unrestricted use, sharing, adaptation, distribution and reproduction in any medium or format, for any purpose, even commercially, as long as you give appropriate credit to the original author(s) and the source, provide a link to the Creative Commons license, and indicate if changes were made.



View: 81
Download: 10
Times Cited: 0


