Original Article


Affiliation:
1School of Public Health, Guangdong Pharmaceutical University, Guangzhou 510632, Guangdong, China

Affiliation:
1School of Public Health, Guangdong Pharmaceutical University, Guangzhou 510632, Guangdong, China
Affiliation:
1School of Public Health, Guangdong Pharmaceutical University, Guangzhou 510632, Guangdong, China
Affiliation:
1School of Public Health, Guangdong Pharmaceutical University, Guangzhou 510632, Guangdong, China
Affiliation:
1School of Public Health, Guangdong Pharmaceutical University, Guangzhou 510632, Guangdong, China
Affiliation:
1School of Public Health, Guangdong Pharmaceutical University, Guangzhou 510632, Guangdong, China
Affiliation:
2Georgia Prevention Institute, Department of Medicine, Medical College of Georgia, Augusta University, Augusta, GA 30912, USA
ORCID: https://orcid.org/0000-0002-8384-0464
 ,
,
Affiliation:
2Georgia Prevention Institute, Department of Medicine, Medical College of Georgia, Augusta University, Augusta, GA 30912, USA
ORCID: https://orcid.org/0000-0001-7848-7160
,
Affiliation:
3Guangzhou Center for Disease Control and Prevention (Guangzhou Health Supervision Institute), Guangzhou 510440, Guangdong, China
Affiliation:
1School of Public Health, Guangdong Pharmaceutical University, Guangzhou 510632, Guangdong, China
Email: haoguang2015@hotmail.com; haoguang@gdpu.edu.cn
ORCID: https://orcid.org/0000-0003-3780-0223

Explor Cardiol. 2026;4:1012118 DOI: https://doi.org/10.37349/ec.2026.1012118
Received: April 08, 2026 Accepted: June 15, 2026 Published: August 13, 2026
Academic Editor: Tatsuya Morimoto, Toho University, Japan; Eugenio Picano, Italian National Research Council, Italy
Aim: Allostatic load (AL) is a composite measure of cumulative physiological stress, but its role in heart failure (HF) onset and prognosis remains unclear.
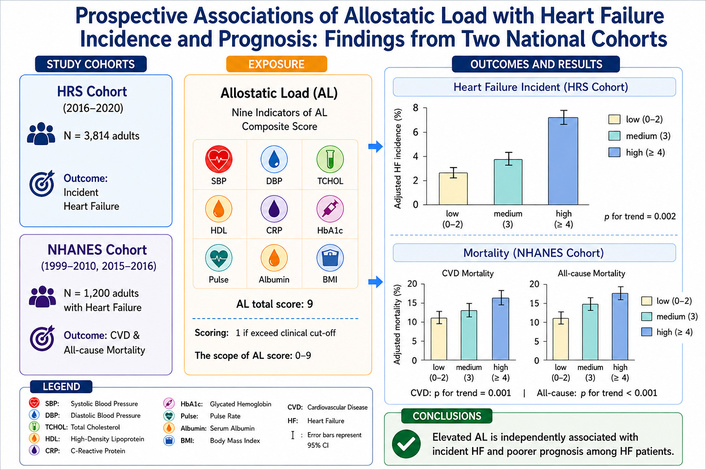
Methods: We analyzed data from two U.S. cohorts. Logistic regression assessed AL and incident HF in 3,814 adults from the Health and Retirement Study (HRS, 2016–2020). Cox regression examined AL with cardiovascular and all-cause mortality in 1,200 HF patients from the National Health and Nutrition Examination Survey (NHANES, 1999–2010 and 2015–2016). AL was derived from nine biomarkers and categorized as low (0–2), medium (3), or high (≥ 4).
Results: In HRS, after full adjustment, high AL was associated with increased incident HF risk versus low AL (OR = 2.07; 95% CI: 1.29–3.32; P = 0.002), with each 1-unit increase raising risk by 30% (P < 0.001). In NHANES, after full adjustment, high AL predicted elevated cardiovascular (HR = 2.03; 95% CI: 1.37–3.03; P < 0.001) and all-cause mortality (HR = 1.70; 95% CI: 1.30–2.22; P < 0.001). Per unit increase, AL raised cardiovascular mortality by 18% and all-cause mortality by 15%. Model performance improved modestly with AL.
Conclusions: Elevated AL is independently associated with HF incidence and poorer prognosis, supporting its potential as an integrative biomarker for HF risk stratification and prevention.
Cardiovascular disease (CVD) remains the leading cause of death, particularly among the elderly population [1]. According to World Health Organization (WHO) data from 2019, CVD accounted for approximately 17.9 million deaths, representing 32% of all global deaths. It is estimated that by 2030, the number of elderly aged 65 and above will increase by 20% [2]. Consequently, the rising prevalence of CVD among the aging population is expected to impose a substantial strain on public health systems worldwide [3, 4]. Heart failure (HF), a serious condition when the heart can’t pump blood well enough to give your body a normal supply, is increasingly regarded as a major health burden globally, with approximately 37.7 million people affected worldwide [5–9]. According to a 2014 report, compared to other forms of CVD, HF accounted for approximately 108 billion US dollars in medical expenditures in 2012, with the majority of this amount spent on direct medical costs [8]. In China, the prevalence of HF among adults aged ≥ 35 years is approximately 1.3%, translating to about 13.7 million cases nationwide [10]. The burden is projected to increase alongside the aging population, posing significant public health and economic challenges.
The allostatic load (AL) is a physiological measure of the cumulative burden of chronic stress on the body, evaluated through multi-system biomarkers of dysregulation [11]. Although AL is associated with various adverse health outcomes, including all-cause mortality and cardiovascular mortality [12–14], its role in predicting HF risk and prognosis has not been well studied. Here, we aim to explore the role of AL in the pathogenesis of HF: (1) using the longitudinal data from the Health and Retirement Study (HRS) to assess the association between AL and new-onset HF; (2) using the National Health and Nutrition Examination Survey (NHANES) data to study the impact of AL on the cardiovascular and all-cause mortality among patients with HF. Given the rising incidence of HF, and usually there’s no cure, our results could provide a new avenue in the prevention and management of HF.
The HRS data used in this study are publicly available at (https://hrs.isr.umich.edu/about). The NHANES data are accessed from the National Health and Nutritional Examination Survey (https://wwwn.cdc.gov/nchs/nhanes/) and NHANES 2019 Public-Use Linked Mortality File (https://www.cdc.gov/nchs/linked-data/mortality-files).
The HRS is a nationally representative longitudinal survey of approximately 20,000 U.S. adults aged 50 and older, initiated in 1992 and conducted biennially. Details of the multistage area probability sampling method used to recruit a nationally representative sample of noninstitutionalized U.S. adults have been reported previously [15]. For this study, we use the data from the waves 2016, 2018, and 2020 because biomarker data from the Venous Blood Study (VBS) were only available in wave 2016. Participants were eligible for inclusion if they met the following criteria: 1) no self-reported diagnosis of HF or cancer at baseline in 2016; 2) complete data to calculate AL at baseline; 3) complete information on the key covariates, including age, sex, race/ethnicity, education, family income, marital status, smoking status, drinking status, diabetes, and hypertension. A total of 3,814 eligible participants were included at baseline in the HRS cohort. After excluding participants with missing covariate data, 2,951 participants were included in the fully adjusted analyses (Figure S1).
The NHANES is an official representative survey designed to assess the health and nutritional status of the civilian and noninstitutionalized U.S. population. It uses a complex, multistage probability sampling design and is conducted in a 2-year cycle by the official institute, the National Center for Health Statistics (NCHS) [16–18]. For this analysis, we included data from seven continuous NHANES cycles: 1999–2000, 2001–2002, 2003–2004, 2005–2006, 2007–2008, 2009–2010, and 2015–2016. The waves in 2011–2012 and 2013–2014 were deleted due to missing data on C-reactive protein (CRP) for AL calculation. Participants from these cycles were linked to mortality outcomes through the data from the 2019 Linked Mortality File. The inclusion criteria were as follows: 1) age ≥ 25; 2) complete data on AL; 3) with HF; 4) complete data on key covariates, including age, sex, race/ethnicity, education, family income, marital status, smoking status, drinking status, serum creatinine, coronary heart disease, diabetes, and taking antihypertensive medication. Participants with missing figures for mortality status or survival time were excluded. A total of 1,200 individuals with HF were included in the NHANES cohort at baseline. After exclusion of participants with missing covariate data, 568 participants were included in the fully adjusted analyses (Figure S2).
HF in the HRS was identified using the self-reported responses to the survey question: “Has a doctor ever told you that you have congestive heart failure?”. In NHANES, HF was determined by the question “Ever told had congestive heart failure?”.
The AL was constructed using the same set of physiological indicators in both the HRS and NHANES cohorts. In NHANES studies and as established in the formal studies on AL, the AL was deprived from ten physiological biomarkers representing three major biological system: CRP for the immune system; systolic and diastolic BP and resting pulse for the cardiovascular system; and body mass index (BMI), total cholesterol (TC), high density lipoprotein cholesterol (HDL-C), glycosylated hemoglobin (HbA1c), albumin, and triglycerides (TG) for the metabolic system [12, 19, 20]. However, TG is a weak indicator of AL in prior studies and was therefore excluded in the present analysis [21–23]. The AL in this study included nine biomarkers: systolic BP, diastolic BP, resting pulse, BMI, TC, HDL-C, HbA1c, albumin, and CRP [24]. Each biomarker was assigned a score of 1 if the value exceeded clinical cut-off thresholds, and 0 otherwise. The total AL score ranged from 0 to 9. Participants were classified into three groups: low (0–2), medium (3), and high AL (≥ 4), based on score distribution and prior studies [23]. The clinical cut-off of AL thresholds was selected based on widely accepted standards from previous literature and applied consistently across both datasets [24]. Specifically, the following cut-off values were used: systolic BP ≥ 140 mmHg, diastolic BP ≥ 90 mmHg, TC ≥ 240 mg/dL, HDL-C < 40 mg/dL, CRP ≥ 0.3 mg/dL, HbA1c ≥ 6.4%, albumin < 3.8 mg/dL, resting pulse ≥ 90 bpm, and BMI ≥ 30 kg/m2.
Covariates included age, sex (male, female), race/ethnicity (white, others), education (< 12 years, 12 years, and > 12 years), marital status (married, separate), family income (< $14,999; $15,000–24,999; $25,000–49,999; ≥ $50,000), smoking statue (yes, no), drinking statue (yes, no), serum creatinine, coronary heart disease (yes, no), diabetes (yes, no) and taking antihypertensive medication (yes, no).
Continuous variables were expressed as means ± standard deviation or median (interquartile range), while categorical variables were expressed as counts and percentages. Normally distributed continuous variables were compared using independent t-tests or ANOVA, whereas non-normally distributed variables were compared using Mann–Whitney tests or Kruskal-Wallis tests, as appropriate. Categorical variables were compared using Chi-square tests. Logistic regression was used to evaluate the association between AL and the incidence of HF using the HRS data, and the Cox proportional hazards regression model was used to assess the association between AL and the risk of cardiovascular and all-cause mortality using the data from the NHANES and HRS.
Logistic regression results were reported as odds ratios (ORs) with 95% confidence intervals (CIs). The Cox proportional hazards regression results were reported as hazard ratios (HRs) with 95% CIs. For both datasets, three models were constructed: Model 1 was unadjusted; Model 2 adjusted for demographic characteristics (age, sex, education level, marital status, race/ethnicity, and income); Model 3 further adjusted for health behaviors and clinical factors (smoking, drinking, serum creatinine, coronary heart disease, antihypertensive medication, and diabetes). Tests for trend were performed by modeling ordered AL categories as ordinal variables in the regression analyses. Interaction analyses were conducted by including multiplicative interaction terms between AL and subgroup variables in the regression models. To evaluate the incremental predictive value of AL, we constructed a baseline line prediction model based on variables included in the American Heart Association PREVENT equation, including age, sex, systolic BP, TC, HDL-C, BMI, smoking status, diabetes, and estimated glomerular filtration rate (eGFR) [25]. AL was then added to the baseline model to assess its additional predictive contribution. Model discrimination was evaluated using the C-statistic (area under the receiver operating characteristic curve, AUC). Differences in AUCs between models were compared using DeLong’s test with bootstrap resampling. Reclassification performance was further assessed using continuous net reclassification improvement (NRI) and integrated discrimination improvement (IDI).
In a sensitivity analysis, participants who died within 2 years of follow-up were excluded. To make full use of all the information in the sample, multiple imputation (MI) methods have been performed in another sensitivity analysis. Although there were no changes to the method and laboratory for AL-related measurements, we conducted another sensitivity analysis to test the potential effects of measurement changes over time by dividing the cohort into three groups (NHANES 1999–2004, NHANES 2005–2010, NHANES 2015–2016). Additional sensitivity analyses were conducted after excluding participants with baseline coronary heart disease to further evaluate the robustness of the observed associations. Furthermore, stratified analysis was performed by selected variables: age (< 65 vs. ≥ 65 years old), sex (male vs. female), race (white vs. others), marital status (married vs. single), taking antihypertensive medication (yes vs. no), and diabetes (yes vs. no). In addition, Kaplan–Meier survival analyses stratified by AL groups were conducted for both CVD and all-cause mortality. We assessed the incremental predictive value of AL by comparing base models (containing demographic, socioeconomic, health behavior, and clinical covariates) to extended models that included AL in both cohorts. Multicollinearity among covariates was assessed using variance inflation factors (VIFs), and no significant multicollinearity was detected (all VIFs < 5). The proportional hazards assumption was evaluated using Schoenfeld residuals. Statistical analyses were performed using R 4.2.3 (R Foundation for Statistical Computing, Vienna, Austria). A two-sided P value of < 0.05 was considered statistically significant.
A total of 3,814 participants were included in the analysis. Overall, the mean age of study participants was 76.74 ± 9.17 years, and 50.3% were male. A total of 1,200 participants with HF were included in the analysis. The mean age of participants was 72.65 ± 10.56 years, and 59.3% were male (Table 1). Most of the AL components were lower in participants without HF or in those who survived (Table S1).
Characteristics of participants.
| Characteristics | Health and Retirement Study | National Health and Nutrition Examination Survey | |||||
|---|---|---|---|---|---|---|---|
| No heart failureN = 3,663 | Heart failureN = 151 | P value | SurvivedN = 427 | CVD deathN = 324 | Other-cause deathN = 449 | P value* | |
| Age, year | 72.31 ± 10.05 | 76.74 ± 9.17 | < 0.001 | 61.46 ± 12.98 | 72.65 ± 10.56 | 71.78 ± 10.60 | < 0.001 |
| Male (%) | 1,453 (39.7) | 76 (50.3) | 0.009 | 231 (54.1) | 192 (59.3) | 260 (57.9) | 0.319 |
| White (%) | 1,306 (35.7) | 49 (32.5) | 0.412 | 169 (39.6) | 199 (61.4) | 274 (61.0) | < 0.001 |
| Education level | |||||||
| < 12 years (%) | 666 (18.2) | 38 (25.2) | 0.015 | 167 (39.2) | 146 (45.2) | 212 (47.2) | 0.127 |
| 12 years (%) | 1,100 (30.0) | 52 (34.4) | 105 (24.7) | 70 (21.7) | 103 (22.9) | ||
| > 12 years (%) | 1,897 (51.8) | 61 (40.4) | 154 (36.2) | 107 (33.1) | 132 (29.4) | ||
| Married (%) | 2,425 (66.2) | 85 (56.3) | 0.012 | 222 (52.4) | 139 (56.6) | 202 (45.0) | 0.037 |
| Family income | |||||||
| < $14,999 (%) | 531 (14.5) | 30 (19.9) | 0.041 | 108 (29.1) | 102 (35.0) | 137 (30.5) | 0.003 |
| $15,000–24,999 (%) | 476 (13.0) | 27 (17.9) | 84 (22.7) | 60 (20.6) | 99 (22.0) | ||
| $25,000–49,999 (%) | 963 (26.3) | 30 (19.9) | 121 (32.6) | 109 (37.5) | 122 (27.2) | ||
| > $50,000(%) | 1,693 (46.3) | 64 (42.4) | 58 (15.6) | 20 (6.9) | 35 (7.8) | ||
| Smoking (%) | 397 (10.8) | 17 (11.3) | 0.090 | 14 (3.3) | 8 (2.5) | 11 (2.4) | 0.003 |
| Drinking (%) | 753 (20.6) | 18 (11.9) | 0.008 | 33 (7.7) | 21(6.5) | 40 (8.9) | 0.280 |
| Coronary heart disease (%) | 32 (0.9) | 6 (4.0) | < 0.001 | 182 (42.6) | 134 (41.4) | 173 (38.5) | 0.522 |
| Diabetes (%) | 976 (26.6) | 64 (42.4) | < 0.001 | 146 (35.4) | 132 (42.3) | 177 (39.4) | 0.126 |
| Antihypertensive medication (%) | 1,900 (51.9) | 113 (74.8) | < 0.001 | 328 (76.8) | 241 (74.4) | 302 (67.3) | 0.383 |
| Serum creatinine, mg/dL | 1.12 (0.90–1.44) | 1.10 (0.9–1.50) | < 0.001 | 0.92 (0.77–1.11) | 1.12 (0.90–1.44) | 1.10 (0.9–1.50) | < 0.001 |
| Allostatic load score | |||||||
| Low (%) | 1,705 (46.6) | 48 (31.8) | < 0.001 | 195 (45.7) | 129 (39.8) | 179 (39.9) | 0.234 |
| Moderate (%) | 1,016 (27.7) | 43 (28.5) | 95 (22.2) | 68 (21.0) | 106 (23.6) | ||
| High (%) | 942 (25.7) | 60 (39.7) | 137 (32.1) | 127 (39.2) | 164 (36.5) | ||
*: Group differences were analyzed using independent t-tests or ANOVA for normally distributed continuous variables, Mann–Whitney U tests for non-normally distributed variables, and chi-square (χ2) tests for categorical variables. Other-cause death does not include CVD death. CVD: cardiovascular disease.
About 31.8% of participants were classified in the low AL group. During approximately 4 years of follow-up, a total of 151 incident HF cases (9.93 per 1,000 person-years) were identified in the HRS cohort. The incidences of HF were 2.74%, 4.06%, and 5.99% in participants with low, moderate, and high AL groups, respectively.
Each unit increase in AL score was associated with a 49% higher risk of HF (OR = 1.49; 95% CI: 1.21–1.82, P < 0.001). Compared to the low AL group, participants in the high AL group had a significantly higher risk of HF (OR = 2.17; 95% CI: 1.46–3.21, P < 0.001), and the medium AL group did not show statistically higher risk of HF (OR = 1.44; 95% CI: 0.94–2.21, P = 0.090). After adjusting for other covariates, consistently, each unit increase in AL was associated with a 30% increase in the risk of HF (OR = 1.30; 95% CI: 1.13–1.49, P < 0.001). Compared to the low AL group, a significantly higher risk of HF (OR = 2.07; 95% CI: 1.29–3.32, P = 0.002) remained in the high AL group, but not for the medium AL group (OR = 1.26; 95% CI: 0.75–2.11, P = 0.391) (Table 2).
Association between AL and incident heart failure in the HRS cohort.
| AL | N/Case (%) | OR | 95% CI | P value |
|---|---|---|---|---|
| Model 1 | ||||
| Low AL (0–2) | Reference | |||
| Medium AL (3) | 1,059/29 (2.7) | 1.44 | 0.94–2.21 | 0.090 |
| High AL (≥ 4) | 1,002/103 (10.28) | 2.17 | 1.46–3.21 | < 0.001 |
| P for trend | 3,814/151 (4.0) | 1.47 | 1.21–1.79 | < 0.001 |
| Per unit increment | 3,814/151 (4.0) | 1.49 | 1.21–1.82 | < 0.001 |
| Model 2 | ||||
| Low AL (0–2) | Reference | |||
| Medium AL (3) | 1,058/29 (2.7) | 1.50 | 0.98–2.32 | 0.064 |
| High AL (≥ 4) | 999/103 (10.3) | 2.21 | 1.47–3.33 | < 0.001 |
| P for trend | 3,807/151 (4.0) | 1.49 | 1.21–1.82 | < 0.001 |
| Per unit increment | 3,807/151 (4.0) | 1.45 | 1.28–1.61 | < 0.001 |
| Model 3 | ||||
| Low AL (0–2) | Reference | |||
| Medium AL (3) | 842/22 (2.6) | 1.26 | 0.75–2.11 | 0.391 |
| High AL (≥ 4) | 823/81 (9.8) | 2.07 | 1.29–3.32 | 0.002 |
| P for trend | 2,951/115 (3.90) | 1.46 | 1.14–1.84 | 0.002 |
| Per unit increment | 2,951/115 (3.90) | 1.30 | 1.13–1.49 | < 0.001 |
Model 1 was unadjusted; Model 2 adjusted for age, sex, education level, marital status, race/ethnicity, and income; Model 3 further adjusted for smoking, drinking, serum creatinine, coronary heart disease, antihypertensive medication, and diabetes. HRS: Health and Retirement Study; AL: allostatic load; OR: odds ratio; CI: confidence interval.
Only 39.8% of patients were classified in the low AL group. Over a median follow-up of 5.92 years (Q1–Q3: 3.17–11.08 years), 324 (27%) cardiovascular deaths and 773 (64.4%) all-cause deaths were observed. The cardiovascular mortality rates among HF patients in low, moderate, and high AL groups were 25.65%, 25.28%, and 29.67%; and 61.23%, 64.68% and 67.99% for all-cause mortality rates, respectively.
After adjusting for other covariates, each unit increase in AL score was significantly associated with a 18% higher risk of cardiovascular mortality (HR = 1.18; 95% CI: 1.05–1.31, P = 0.007). Patients with HF in the high AL group had doubled the risk of CVD death compared to the low AL group (HR = 2.03; 95% CI: 1.37–3.03, P < 0.001), while the medium AL group was not significant (HR = 1.30; 95% CI: 0.82–2.07, P = 0.261). After controlling for other covariates, a per-unit increase in AL was associated with a 15% increased risk of all-cause mortality (HR = 1.15; 95% CI: 1.06–1.24, P = 0.001). Compared to the low AL group, the high AL group was significantly associated with higher mortality (HR = 1.70; 95% CI: 1.30–2.22, P < 0.001), and the medium AL group was also significant (HR = 1.35; 95% CI: 1.01–1.79, P = 0.041) (Table 3 and Figure 1).
Association between allostatic load (AL) and mortality outcomes among individuals with heart failure in the NHANES cohort.
| AL | N/Case | HR | 95% CI | P value |
|---|---|---|---|---|
| CVD-death | ||||
| Model 1 | ||||
| AL score = low | Reference | |||
| AL score = medium | 269/68 | 1.11 | 0.83–1.49 | 0.494 |
| AL score = high | 428/127 | 1.31 | 1.03–1.68 | 0.030 |
| P for trend | 1,200/324 | 1.15 | 1.01–1.30 | 0.031 |
| Per unit increment | 1,200/324 | 1.08 | 1.01–1.15 | 0.024 |
| Model 2 | ||||
| AL score = low | Reference | |||
| AL score = medium | 233/57 | 1.15 | 0.83–1.59 | 0.399 |
| AL score = high | 371/113 | 1.58 | 1.21–2.06 | 0.001 |
| P for trend | 1,040/288 | 1.26 | 1.10–1.44 | 0.001 |
| Per unit increment | 1,040/288 | 1.14 | 1.06–1.23 | 0.001 |
| Model 3 | ||||
| AL score = low | Reference | |||
| AL score = medium | 63/16 | 1.30 | 0.82–2.07 | 0.261 |
| AL score = high | 101/29 | 2.03 | 1.37–3.03 | < 0.001 |
| P for trend | 586/144 | 1.42 | 1.16–1.74 | 0.001 |
| Per unit increment | 586/144 | 1.18 | 1.05–1.33 | 0.007 |
| All cause-death | ||||
| Model 1 | ||||
| AL score = low | Reference | |||
| AL score = medium | 269/174 | 1.21 | 1.00–1.45 | 0.048 |
| AL score = high | 428/291 | 1.26 | 1.07–1.48 | 0.005 |
| P for trend | 1,200/773 | 1.12 | 1.04–1.22 | 0.004 |
| Per unit increment | 1,200/773 | 1.07 | 1.03–1.12 | 0.002 |
| Model 2 | ||||
| AL score = low | Reference | |||
| AL score = medium | 233/148 | 1.33 | 1.08–1.63 | 0.007 |
| AL score = high | 371/253 | 1.54 | 1.29–1.84 | < 0.001 |
| P for trend | 1,040/671 | 1.24 | 1.14–1.35 | < 0.001 |
| Per unit increment | 1,040/671 | 1.14 | 1.08–1.19 | < 0.001 |
| Model 3 | ||||
| AL score = low | Reference | |||
| AL score = medium | 111/77 | 1.35 | 1.01–1.79 | 0.041 |
| AL score = high | 163/120 | 1.70 | 1.30–2.22 | < 0.001 |
| P for trend | 586/353 | 1.31 | 1.15–1.49 | < 0.001 |
| Per unit increment | 586/353 | 1.15 | 1.06–1.24 | 0.001 |
Model 1 was unadjusted; Model 2 adjusted for age, sex, education level, marital status, race/ethnicity, and income; Model 3 further adjusted for smoking, drinking, serum creatinine, coronary heart disease, antihypertensive medication, and diabetes. NHANES: National Health and Nutrition Examination Survey; HR: hazard ratio; CI: confidence interval; CVD: cardiovascular disease.
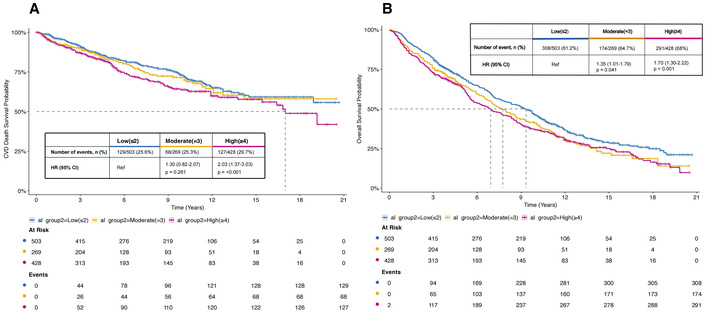
Kaplan–Meier curves for cardiovascular disease (CVD). (A) death and all-cause death (B) by allostatic load (AL) group in the NHANES cohort. Numbers at risk and events are shown below the curves. Hazard ratios (HRs) were estimated using Cox proportional hazards models adjusted for covariates (age, sex, education level, marital status, race/ethnicity, income, smoking, drinking, serum creatinine, coronary heart disease, antihypertensive medication, and diabetes).
In the HRS cohort, adding baseline AL to the HF model modestly improved discrimination for incident HF, with the C-statistic increasing from 0.711 (95% CI: 0.669, 0.753) to 0.720 (95% CI: 0.678, 0.761), yielding a difference of 1.15% (95% CI: –0.73%, 3.03%). The NRI was 0.142 (95% CI: –0.031, 0.316), and the IDI was 0.0016 (95% CI: –0.0022, 0.0053). The extended model incorporating AL showed a higher C-statistic for CVD mortality, increasing from 0.689 (95% CI: 0.654, 0.723) to 0.709 (95% CI: 0.674, 0.743), with a difference of 1.95% (95% CI: 0.36%, 3.89%). For all-cause mortality, the C-statistic rose from 0.689 (95% CI: 0.668, 0.714) to 0.699 (95% CI: 0.679, 0.725), with a difference of 1.00% (95% CI: 0.26%, 2.16%) (Table 4).
Predictive value of AL in HF onset and prognosis.
| Cohorts | Outcomes | Models | C-statistic (95% CI) | NRI (95% CI) | IDI (95% CI) | |
|---|---|---|---|---|---|---|
| Estimate | Difference (%) | |||||
| HRS | HF incidence | Base model | 0.711 (0.669, 0.753) | Ref | Ref | Ref |
| Base model + AL | 0.720 (0.678, 0.761) | 1.15 (–0.73, 3.03) | 0.142 (–0.031, 0.316) | 0.0016 (–0.0022, 0.0053) | ||
| NHANES | CVD-death | Base model | 0.689 (0.654, 0.723) | Ref | Ref | Ref |
| Base model + AL | 0.709 (0.674, 0.743) | 1.95 (0.36, 3.89) | 0.182 (0.023, 0.346) | 0.0002 (–0.0003, 0.0007) | ||
| All-caused death | Base model | 0.689 (0.668, 0.714) | Ref | Ref | Ref | |
| Base model + AL | 0.699 (0.679, 0.725) | 1.00 (0.26, 2.16) | 0.132 (0.065, 0.259) | 0.0001 (–0.0001, 0.0003) | ||
Base mode included age, sex, race, education levels, married status, family income, smoking, drinking, coronary heart disease, antihypertensive medication, diabetes, and serum creatinine. HRS: Health and Retirement Study; NHANES: National Health and Nutrition Examination Survey; AL: allostatic load; CI: confidence interval; CVD: cardiovascular disease; HF: heart failure; NRI: net reclassification improvement; IDI: integrated discrimination improvement.
We conducted stratified analyses to examine whether the association between high AL and adverse outcomes differed by subgroup and showed similar results (Figure 2 and Figure 3). Sensitivity analyses excluding participants who died within 2 years of follow-up (Table S2), imputation of missing data (Table S3 and Table S4), or grouping the NHANES data into three cohorts (1999–2004, 2005–2010, and 2015–2016) showed similar results (Table S5). The subgroup analysis findings should be considered exploratory because of the relatively limited sample size and statistical power. The associations between AL and study outcomes remained generally consistent after excluding participants with baseline coronary heart disease (Table S6).
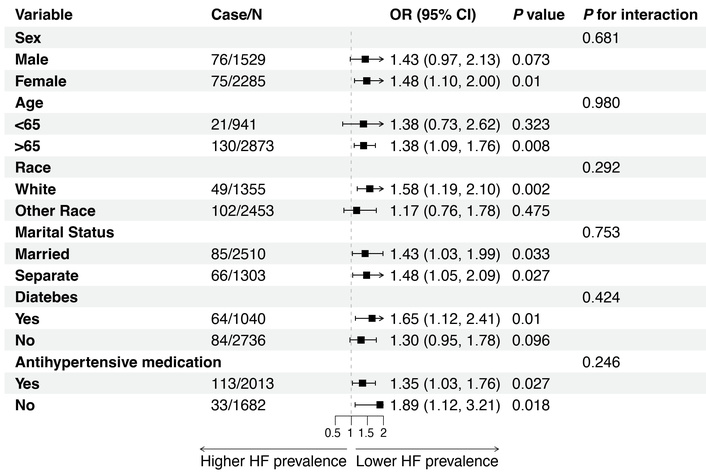
Subgroup analyses of the associations of a unit increase in allostatic load (AL) with incident heart failure in the HRS cohort (2016–2020). ORs and 95% CIs were obtained from logistic regression models with MI. Models were adjusted for all covariates (age, sex, education level, marital status, race/ethnicity, income, smoking, drinking, serum creatinine, coronary heart disease, antihypertensive medication, and diabetes). P values represent within-group effects; P for interaction tests cross-stratum effect modification. OR: odds ratio; HRS: Health and Retirement Study; CI: confidence interval; HF: heart failure.
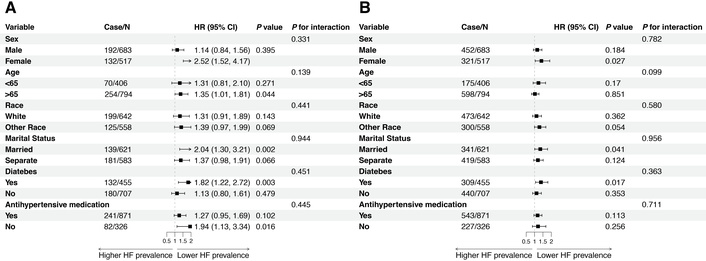
Subgroup analyses of mortality risk per 1-unit increase for cardiovascular disease (CVD). (A) death and all-cause death (B) in allostatic load (AL) among participants with heart failure in the NHANES cohort (1999–2016). HRs and 95% CIs were estimated from Cox proportional hazards models. Models were adjusted for all covariates (age, sex, education level, marital status, race/ethnicity, income, smoking, drinking, serum creatinine, coronary heart disease, antihypertensive medication, and diabetes). P values represent within-stratum associations; P for interaction indicates heterogeneity across subgroups. HR: hazard ratio; CI: confidence interval.
Using two nationally representative cohorts (the HRS and NHANES), we found that elevated AL was significantly associated with the incidence of HF in the general population and with both cardiovascular and all-cause mortality among patients with HF. Furthermore, adding AL to traditional models modestly improved the performance of predictive models for both HF onset and prognosis.
Our findings align with a growing body of literature that links elevated AL to a spectrum of adverse cardiovascular outcomes, including hypertension, coronary artery disease, stroke, and HF [13, 15, 24, 26–29]. This association has been observed across diverse populations and study designs. A landmark study by Seeman et al. [28] in the MacArthur Successful Aging cohort reported that high AL predicted increased incidence of cardiovascular events and all-cause mortality over a 7-year follow-up period, even after adjusting for baseline health status and sociodemographic variables. This is further supported by a systematic review and meta-analysis of 17 prospective studies, which found that elevated AL was associated with a 22% increased risk of all-cause mortality and a 31% increased risk of cardiovascular mortality [30].
More specifically regarding HF, evidence consistently shows a strong association. The REGARDS study demonstrated a stepwise increase in HF risk with higher AL, with the highest quartile associated with over fourfold increased risk compared with the lowest quartile [27]. Similarly, the Jackson Heart Study found that high AL was linked to higher HF incidence and mortality, and this relationship was modified by psychosocial resilience [31]. Corroborating these findings, the Echocardiographic Study of Latinos reported that increasing AL was associated with both prevalent cardiac abnormalities and incident HF [32].
Evidence regarding the prognostic role of AL in patients with established HF remains limited. While several studies have demonstrated the prognostic value of AL in other specific populations, such as cancer survivors [27] patients with ischemic heart disease or stroke, where higher AL predicted a greater risk of cardiovascular events [33, 34]. A notable exception is a study of older adults with HFpEF, which found that elevated AL was independently associated with greater risks of all-cause mortality, cardiovascular mortality, and HF readmission, with clear dose-response trends [30]. Our findings, derived from NHANES data, align with and extend this evidence by showing that among patients with HF, higher AL was independently associated with increased risks of both CVD and all-cause mortality. Furthermore, adding AL to traditional models for HF and mortality achieved modest improvement in discrimination and reclassification. These findings indicate that AL may serve not only as a marker of HF but also may provide complementary value for risk stratification in a clinical setting.
Biologically, AL reflects the “wear and tear” on multiple physiological systems from chronic stress, including neuroendocrine, metabolic, inflammatory, and cardiovascular pathways [35]. The persistent activation of the hypothalamic-pituitary-adrenal axis and sympathetic nervous system is a central mechanism underlying the development of these conditions; in turn, they initiate the pathophysiological changes that favor myocardial remodeling and precipitate the onset of HF [34, 36]. In established HF, elevated AL may exacerbate endothelial dysfunction, oxidative stress, and autonomic imbalance, accelerating disease progression, worsening diastolic function, and increasing susceptibility to arrhythmias [32, 35].
Our study is among the first to examine AL in relation to both HF onset and post-diagnosis outcomes, as well as its predictive value, using two independent cohorts. However, several limitations should be considered. First, HF was based on self-report in the HRS cohort, which is susceptible to recall bias and misclassification. Prior work has shown that self-reported HF has relatively low sensitivity (28–38%) compared to adjudicated clinical diagnoses, which could lead to non-differential misclassification and attenuation of true associations [37]. Therefore, the observed associations should be interpreted with caution, and future studies using clinically adjudicated HF diagnoses are needed to validate our findings. In addition, information on HF subtypes (e.g., HFrEF and HFpEF) was unavailable in both cohorts, limiting our ability to explore potential heterogeneity in the association between AL and different HF phenotypes. Second, as an observational study, residual confounding (e.g., by unmeasured factors like chronic psychosocial stress or mental health) or reverse causation cannot be entirely excluded [38]. Third, AL was assessed only at baseline, preventing an examination of how longitudinal changes in AL, which may be a stronger predictor of cardiovascular outcomes than a single measurement, influence risk [39]. In addition, because AL includes blood pressure and glycemic components, adjustment for hypertension and diabetes may partially overlap with AL-related physiological burden. However, sensitivity analyses suggested that these variables remained clinically important covariates, and the overall associations remained generally consistent. Fourth, the lack of data on HF subtypes limited our ability to explore potential mechanistic differences in how AL relates to specific HF phenotypes [29]. A final limitation is the potential for selection bias due to sample attrition and missing data. Despite efforts to address this through sensitivity analyses and MI, the generalizability of our findings to these excluded populations may be constrained. Despite these limitations, the use of two nationally representative cohorts and consistent findings across analyses strengthens the robustness of the observed associations.
In conclusion, elevated AL is a significant predictor of both HF incidence and subsequent cardiovascular and all-cause mortality. AL captures the cumulative burden of chronic physiological stress and may serve as an integrative biomarker for early identification of at-risk individuals. Future research should test targeted interventions to reduce AL and improve HF prevention and management.
AL: allostatic load
AUC: area under the receiver operating characteristic curve
BMI: body mass index
CIs: confidence intervals
CRP: C-reactive protein
CVD: cardiovascular disease
HDL-C: high density lipoprotein cholesterol
HF: heart failure
HRs: hazard ratios
HRS: Health and Retirement Study
IDI: integrated discrimination improvement
NHANES: National Health and Nutrition Examination Survey
NRI: net reclassification improvement
OR: odds ratio
TC: total cholesterol
TG: triglycerides
VIFs: variance inflation factors
The supplementary materials for this article are available at: https://www.explorationpub.com/uploads/Article/file/1012118_sup_1.pdf.
While preparing this work, the authors used OpenAI and DeepSeek to enhance clarity and readability. After using the tools, the authors reviewed and edited the content as needed and take full responsibility for the publication’s content.
GH: Conceptualization, Supervision, Writing—review & editing. YN: Data curation, Formal analysis, Methodology, Visualization, Writing—original draft. H Zhang, FH, LS, XQ, HX, H Zhu, YD, and HC: Investigation, Validation, Writing—review & editing. All authors contributed to the article and approved the final submitted version.
The authors have nothing to declare.
The NHANES protocol was approved by the National Center for Health Statistics Research Ethics Review Board (Protocol #98-12, #2005-06, and #2011-17), and the HRS study was approved by the University of Michigan Health Sciences and Behavioral Sciences Institutional Review Board (HUM00061128). Both studies comply with the Declaration of Helsinki, and all participants provided written informed consent.
Informed consent was obtained from all participants in the original studies.
Not applicable.
The NHANES and HRS datasets analyzed during the current study are publicly available from the official websites of the National Center for Health Statistics and the Health and Retirement Study program.
This research did not receive any specific grant from funding agencies in the public, commercial, or not-for-profit sectors.
© The Author(s) 2026.
Open Exploration maintains a neutral stance on jurisdictional claims in published institutional affiliations and maps. All opinions expressed in this article are the personal views of the author(s) and do not represent the stance of the editorial team or the publisher.
Copyright: © The Author(s) 2026. This is an Open Access article licensed under a Creative Commons Attribution 4.0 International License (https://creativecommons.org/licenses/by/4.0/), which permits unrestricted use, sharing, adaptation, distribution and reproduction in any medium or format, for any purpose, even commercially, as long as you give appropriate credit to the original author(s) and the source, provide a link to the Creative Commons license, and indicate if changes were made.



View: 668
Download: 13
Times Cited: 0