Original Article

Affiliation:
Department of Pulmonary, Critical Care and Sleep Medicine, All India Institute of Medical Sciences, Raipur 492099, Chhattisgarh, India
Email: sajalde@yahoo.com
ORCID: https://orcid.org/0000-0002-8349-125X
Affiliation:
Department of Pulmonary, Critical Care and Sleep Medicine, All India Institute of Medical Sciences, Raipur 492099, Chhattisgarh, India
ORCID: https://orcid.org/0000-0002-1647-5321
Explor Asthma Allergy. 2026;4:1009126 DOI: https://doi.org/10.37349/eaa.2026.1009126
Received: March 17, 2026 Accepted: April 21, 2026 Published: May 15, 2026
Academic Editor: Nunzio Crimi, University of Catania, Italy
Aim: This study aimed to assess the prevalence and patterns of aeroallergen sensitisation in steroid-naïve, newly diagnosed adult patients with bronchial asthma using skin prick test (SPT), and to examine its association with lung function parameters measured by oscillometry and spirometry.
Methods: Consecutive adult patients with bronchial asthma who were naïve to systemic and inhaled corticosteroids were recruited. Following a detailed clinical history and blood investigations, lung function was assessed using oscillometry and spirometry. SPT was performed using a panel of 13 aeroallergens in accordance with established guidelines. Based on SPT results, patients were stratified into two groups: atopic asthma (sensitisation to ≥ 1 allergen) and non-atopic asthma (no sensitisation). Demographic characteristics, blood parameters, and lung function parameters were compared between the two groups.
Results: Of 257 patients screened, 205 were enrolled (59% men; mean age 36.9 years). Allergic rhinitis was present in 58% of patients, and 69.8% had atopic asthma (95% CI 62.9–75.6). Sensitisation was most common to house dust mites (47.8%), followed by cockroach (37.6%) and weed pollen (29.8%). Atopy was more prevalent in men than in women and was associated with higher serum total IgE levels. Peripheral blood eosinophil counts, oscillometric parameters, severity of airflow obstruction, and bronchodilator responses did not differ significantly between atopic and non-atopic patients.
Conclusions: The majority of asthma patients exhibited sensitisation to one or more aeroallergens. Despite differences in immunopathogenesis, no significant differences in oscillometric parameters were observed between atopic and non-atopic asthma, suggesting that atopic status has a limited influence on the severity of small airway dysfunction.
Bronchial asthma is a global health problem that affects all age groups. Asthma continues to impose a substantial burden on morbidity, healthcare utilisation, and quality of life [1]. A large-scale, nationwide, cross-sectional study from India reported the prevalence of self-reported asthma as 1.9%, with regional variations [2]. Asthma is a heterogeneous airway disease characterised by airway inflammation and variable airflow limitation, encompassing multiple clinical and inflammatory phenotypes. Allergen sensitisation, that is, atopy, can occur across all phenotypes. Patients with an atopic phenotype often respond better to corticosteroid therapy, and their symptoms may improve with allergen avoidance and immunotherapy [1]. Atopy can be diagnosed using the skin prick test (SPT) or by measuring allergen-specific IgE levels in serum. Among these, SPT is a simple, cost-effective, and specific method for detecting IgE-mediated type I hypersensitivity reactions [3–4].
The prevalence of sensitisation to environmental allergens varies across geographical areas. The Indian subcontinent, with its diverse geography and climate, provides a unique environment that may influence allergen exposure and sensitisation patterns among patients with asthma. Understanding regional sensitization profiles is important for identifying local triggers and tailoring individualised management strategies. Systemic corticosteroid therapy can modulate immune responses and potentially influence SPT results [3]. Therefore, studying steroid-naïve patients with asthma offers a clearer assessment of baseline allergen sensitisation.
Traditionally, asthma is considered a disease of larger airways. However, increasing evidence highlights the critical role of the small airways (internal diameter ≤ 2 mm) in their pathophysiology [5]. Conventional spirometry parameters primarily reflect large airway function and may fail to detect subtle abnormalities in the small airways. Respiratory oscillometry is a sensitive technique for assessing lung mechanics, particularly small airway function [5]. However, it remains unclear whether small airway dysfunction differs between patients with atopic and non-atopic asthma.
The primary objective of this study was to assess the frequency and pattern of aeroallergen sensitisation using SPT in newly diagnosed, steroid-naïve (defined as no prior systemic or inhaled corticosteroid use) adult patients with bronchial asthma. The secondary objective was to compare demographic characteristics, blood parameters, and lung function indices, including respiratory oscillometry, between patients with atopic and non-atopic asthma.
This prospective observational study was conducted between November 2023 and April 2025. The Institutional Ethics Committee of All India Institute of Medical Sciences, Raipur, India, approved the study protocol. Written informed consent was obtained from all participants. The diagnosis of bronchial asthma was established based on clinical symptoms in accordance with the Global Initiative for Asthma (GINA) recommendations [1].
Clinically stable, steroid-naïve adult patients with bronchial asthma were consecutively recruited from the outpatient department. Steroid-naïve status was defined as no prior use of systemic or inhaled corticosteroids in the preceding 12 weeks. The inclusion criteria were symptoms consistent with bronchial asthma and evidence of airflow obstruction on spirometry. Allergic rhinitis was diagnosed according to the Allergic Rhinitis and its Impact on Asthma (ARIA) guidelines [6]. Patients were excluded if they had a history of smoking, a prior diagnosis of bronchial asthma with ongoing treatment, a history of pulmonary tuberculosis, structural lung disease, or any clinical evidence of an acute exacerbation within the preceding four weeks.
All participants underwent a detailed clinical evaluation, including medical history taking, physical examination, blood examination, and chest radiography. Patients were stratified into eosinophilic and non-eosinophilic asthma using a peripheral blood eosinophil threshold of > 300 cells/µL. Total serum IgE levels were estimated using an enzyme-linked immunosorbent assay kit. Lung function was assessed using oscillometry, followed by spirometry.
Respiratory impedance was measured using the Resmon Pro Full device (Restech Srl, Milan, Italy) in accordance with the European Respiratory Society guidelines [7]. All measurements were performed in accordance with standard quality control criteria, and at least three technically acceptable recordings were obtained. The mean of three technically acceptable recordings was reported. The oscillometry parameters included in the analysis were whole-breath respiratory system resistance at 5 Hz (R5), whole-breath respiratory system reactance at 5 Hz (X5), the difference in whole-breath respiratory resistance between 5 Hz and 19 Hz (R5–19), resonant frequency (Fres), and the integrated area of respiratory reactance between X5 and Fres (AX). The predicted values for oscillometry parameters were derived using regression equations for the Indian population [8]. Impairment in R5 and R5–19 was defined as a z-score > +1.64, and impairment in X5 as a z-score < –1.64, in accordance with recommendations [7].
Spirometry was performed using the PowerCube Body+ system (GANSHORN Medizin Electronic, Germany), in accordance with the American Thoracic Society/European Respiratory Society guidelines [9]. The spirometric indices included in the analysis were forced expiratory volume in 1 s (FEV1), forced vital capacity (FVC), maximal mid-expiratory flow rate (MMEF), and the FEV1/FVC ratio. The predicted spirometric values were calculated using reference equations for the Indian population [10].
Following baseline measurements, oscillometry and spirometry were repeated 15–20 min after administration of 400 μg of salbutamol via a metered-dose inhaler with a spacer to assess bronchodilator responsiveness (BDR). BDR in oscillometry was defined as a ≥ 40% reduction in R5, a ≥ 50% decrease in the magnitude of X5 in accordance with recommendations [7]. BDR in spirometry was defined as a ≥ 12% and ≥ 200 mL increase in FEV1 and/or FVC from baseline [9].
The antigens for SPT were obtained from All Cure Pharma Pvt. Ltd. (New Delhi, India). The antigens used in this study were house dust mites (HDM) (Blomia, Farniae, and Pteronyssinus), house dust, weed pollen (Parthenium hysterophorus, Argemone mexicana, and Cynodon dactylon), molds (Aspergillus fumigatus, Aspergillus niger, Aspergillus flavus, and Alternaria alternata), dog epithelium, and cockroach. SPT was performed using the same lot of allergens, with positive (histamine) and negative (buffered normal saline) controls [3]. A 1-mm lancet was used to perform the tests. The reaction was read 20 min after administration and was considered positive if the wheal diameter was ≥ 3 mm compared with the negative control. Wheal diameter of 3–5 mm was graded as 1+, 6–8 mm as 2+, 9–11 mm as 3+, and > 11 mm as 4+ in accordance with guidelines [3]. SPT reactions ≥ 2+ were considered clinically significant positive reactions. Atopic asthma was defined as sensitisation to at least one allergen, whereas non-atopic asthma was defined as a negative SPT response to all tested allergens.
Data were analysed using IBM SPSS Statistics for Windows (version 23.0; IBM Corp., Armonk, NY, USA). Parametric data were expressed as mean ± standard deviation, non-parametric data as median [interquartile range (IQR)], and categorical variables as percentages. Frequencies were reported with 95% confidence intervals (CIs). Student’s t-test, the Mann-Whitney U test, and the chi-square test were used to compare demographic and lung function parameters between atopic and non-atopic groups. Statistical significance was set at a two-sided p-value < 0.05.
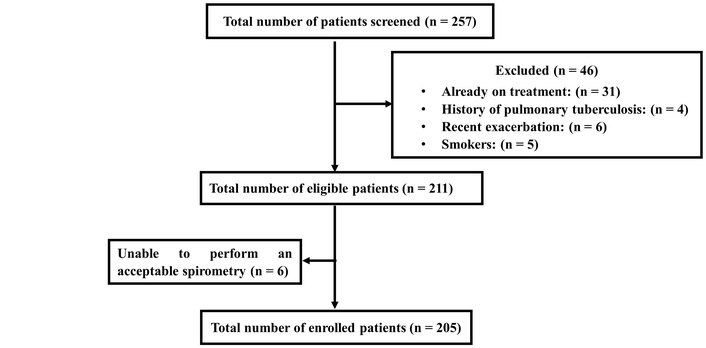
A total of 257 patients with bronchial asthma were screened for eligibility. Of these, 52 were excluded based on predefined criteria, and the remaining 205 patients met the inclusion criteria and were enrolled in this study. The detailed patient selection process is illustrated in Figure 1. The mean age of the cohort was 36.9 ± 12.2 years, and 59% were male. The mean body mass index was 24.1 ± 3.8 kg/m2. The mean FEV1% predicted was 57 ± 16. Concomitant allergic rhinitis was present in 58% (95% CI: 50.7–66.3) of patients. The median peripheral blood eosinophil count was 324 cells/µL (IQR: 215–541), and the median serum total IgE level was 432 IU/mL (IQR: 233–853). The prevalence of eosinophilic asthma was 54.6% (95% CI: 47.8–61.9).
Among the 205 patients, 69.8% (95% CI: 62.9–75.6) were sensitised to at least one aeroallergen, and a clinically significant SPT response was observed in 48.3% (95% CI: 40.6–55.0) of the patients (Table 1). The most common sensitisation was to HDM, observed in 47.8% of patients, followed by cockroaches (37.6%) and weed pollen (29.8%), respectively. Among the HDM species, Blomia tropicalis was the most prevalent (41.0%), followed by Dermatophagoides pteronyssinus (34.6%) and Dermatophagoides farinae (31.7%). Among weed pollens, Parthenium hysterophorus was the most common (23.4%), followed by Cynodon dactylon (16.1%) and Argemone mexicana (11.2%). Sensitization to any mold was observed in 21.0% of patients, with Aspergillus fumigatus being the most frequent (10.2%), followed by Aspergillus niger (8.8%), Alternaria alternata (7.3%), and Aspergillus flavus (6.8%). House dust sensitisation was observed in 22.4% of patients. Sensitisation to dog epithelium was low and observed in only 4.4% of patients.
Distribution of sensitization against different allergens.
| Allergens | n, (%) | 95% CI (%) |
|---|---|---|
| Sensitization against house dust mites | 98 (47.8) | 40.5–54.6 |
| Blomia tropicalis SPT ≥ 2+ | 84 (41.0)52 (25.4) | 34.1–47.319.4–31.3 |
| Dermatophagoides pteronyssinus SPT ≥ 2+ | 71(34.6)54 (26.3) | 28.3–41.520.3–32.4 |
| Dermatophagoides farinae SPT ≥ 2+ | 65 (31.7)45 (22.0) | 25.4–38.016.3–27.6 |
| House dust SPT ≥ 2+ | 46 (22.4)16 (7.8) | 17.1–28.34.1–11.5 |
| Cockroach SPT ≥ 2+ | 77 (37.6)47 (22.9) | 30.7–44.417.2–28.7 |
| Sensitization to dog epithelium SPT ≥ 2+ | 9 (4.4)1 (0.5) | 2–7.30–1.4 |
| Sensitization to weed pollen | 61 (29.8) | 23.4–36.1 |
| Parthenium hysterophorus SPT ≥ 2+ | 48 (23.4)16 (7.8) | 17.6–29.74.1–11.5 |
| Cynodon dactylon SPT ≥ 2+ | 33 (16.1)8 (3.9) | 11.2–21.01.3–6.6 |
| Argemone mexicana SPT ≥ 2+ | 23 (11.2)4 (2.0) | 6.8–15.60.1–3.8 |
| Sensitization to molds | 43 (21.0) | 15.6–26.8 |
| Aspergillus fumigatus SPT ≥ 2+ | 21 (10.2)3 (1.5) | 6.3–14.60–.3.1 |
| Aspergillus niger SPT ≥ 2+ | 18 (8.8)2 (1.0) | 4.9–12.70–2.3 |
| Alternaria alternata SPT ≥ 2+ | 15 (7.3)3 (1.5) | 3.9–11.20–3.1 |
| Aspergillus flavus SPT ≥ 2+ | 14 (6.8)2 (1.0) | 3.9–10.20–2.3 |
CI: confidence interval; SPT: skin prick test.
Demographic characteristics, peripheral blood eosinophil counts, total serum IgE levels, and pre-bronchodilator pulmonary function parameters were compared between patients with atopic and non-atopic asthma (Table 2). There was no statistically significant difference in the frequency of eosinophilic asthma between the phenotypes (56.6% vs. 50.0%, p = 0.23). A significantly higher proportion of males had atopic asthma. However, no significant differences were observed between the groups in terms of age, body mass index, or the presence of concomitant allergic rhinitis. Although peripheral blood eosinophil counts did not differ significantly, serum total IgE levels were significantly higher in patients with atopic asthma. The severity of airflow obstruction and MMEF did not differ between the groups. However, patients with atopic asthma had a significantly higher FVC% predicted than those with non-atopic asthma (74.2 ± 14.4 vs. 69.3 ± 17.4; p = 0.04). Oscillometric parameters, including oscillometry-defined small airway dysfunction (R5–19 and X5), did not differ significantly between atopic and non-atopic patients. Similarly, the frequency of BDR, as assessed by spirometry and oscillometry, was not significantly different between the two groups. Further analyses revealed no significant differences in lung function parameters between patients with significant atopy and those without significant atopy or who were non-atopic.
Comparison between atopic and non-atopic asthmatics.
| Variables | Atopic asthma(n = 143) | Non-atopic asthma (n = 62) | P-value |
|---|---|---|---|
| Age, years | 36.6 ± 12.0 | 37.7 ± 12.5 | 0.54 |
| Male, n (%) | 97 (67.8) | 24 (38.7) | < 0.001 |
| BMI, kg/m2 | 23.9 ± 3.9 | 24.6 ± 3.6 | 0.26 |
| Allergic rhinitis, n (%) | 87 (60.8) | 32 (51.6) | 0.14 |
| Peripheral blood eosinophils, median (IQR) | 342 (230–520) | 300 (207–626) | 0.58 |
| Eosinophilic asthma, n (%) | 81 (56.6) | 31 (50.0) | 0.23 |
| Serum total IgE (IU/ml), median (IQR) | 542 (266–970) | 293 (182–578) | < 0.001 |
| FVC% predicted | 74.2 ± 14.4 | 69.3 ± 17.4 | 0.04 |
| FEV1% predicted | 57.7 ± 15.6 | 55.6 ± 17.0 | 0.41 |
| FEV1/FVC% | 64.3 ± 8.5 | 66.8 ± 9.1 | 0.06 |
| MMEF% predicted | 34.7 ± 14.7 | 34.8 ± 15.4 | 0.96 |
| R5, z-score | 3.11 ± 2.75 | 3.03 ± 2.64 | 0.85 |
| R5–19, z-score | 3.08 ± 3.36 | 2.99 ± 3.59 | 0.53 |
| X5, z-score | –2.63 ± 3.61 | –3.02 ± 3.99 | 0.78 |
| Fres, Hz | 21.2 ± 6.9 | 21.6 ± 7.7 | 0.72 |
| AX, cmH2O/L/s | 24.1 ± 23.9 | 27.9 ± 26.5 | 0.46 |
| Impaired R5, n (%) | 94 (65.7) | 36 (58.1) | 0.19 |
| Impaired, R5–19, n (%) | 78 (54.5) | 32 (51.6) | 0.41 |
| Impaired X5, n (%) | 60 (42.0) | 25 (40.3) | 0.48 |
| BDR of FEV1, n (%) | 108 (75.5) | 49 (79.0) | 0.36 |
| BDR of FVC, n (%) | 57 (39.9) | 29 (46.8) | 0.22 |
| BDR of R5, n (%) | 66 (46.2) | 31 (50.0) | 0.36 |
| BDR of X5, n (%) | 55 (38.5) | 22 (35.5) | 0.4 |
AX: integrated area of respiratory reactance between X5 and resonant frequency; BDR: bronchodilator responsiveness; BMI: body mass index; FEV1: forced expiratory volume in 1 s; Fres: resonant frequency; FVC: forced vital capacity; IQR: interquartile range; MMEF: maximal mid-expiratory flow rate; R5: whole-breath respiratory system resistance at 5 Hz; R5–19: difference in whole-breath respiratory resistance between 5 Hz and 19 Hz; X5: whole-breath respiratory system reactance at 5 Hz.
This study evaluated the prevalence and patterns of aeroallergen sensitisation in steroid-naïve adult patients with newly diagnosed bronchial asthma. Approximately two-thirds of patients exhibited sensitisation to at least one aeroallergen, with indoor allergens more commonly implicated than outdoor allergens. HDM was the most frequently identified allergen, followed by cockroach. Serum IgE levels were significantly higher in atopic patients. However, peripheral blood eosinophil counts, the prevalence of allergic rhinitis, and lung function parameters did not differ significantly between the phenotypes.
The frequency and distribution of aeroallergen sensitisation among patients with bronchial asthma vary considerably across geographical regions in India [11–18]. The reported prevalence of aeroallergen sensitisation in asthma, with or without allergic rhinitis, ranges from 54% to 100% [11–18]. The prevalence of sensitisation has also been shown to vary across studies conducted at the same centre at different time points [11, 12]. The frequency of HDM sensitization in Indian studies has shown considerable variability, ranging from 11% to 74% [11–18]. A study from Maharashtra reported HDM as the most common allergen, with a prevalence of 49.9%, consistent with our findings [13]. Among HDM species, Dermatophagoides pteronyssinus and Dermatophagoides farinae are commonly reported as the predominant allergens [11–18]. Some studies have identified Dermatophagoides pteronyssinus as the dominant species [13, 15], whereas others have reported a higher prevalence of Dermatophagoides farinae [16, 18]. In contrast, our study found that Blomia tropicalis was the most common sensitising HDM. Blomia is a storage mite that proliferates in stored rice, grains, and flour, particularly under warm and humid conditions. Chhattisgarh is one of the leading rice-producing states in India, and local environmental and occupational exposures may explain the higher prevalence of Blomia sensitization in our cohort.
In our study, sensitization to cockroach allergens was the second most prevalent and was comparable to that reported in other Indian studies [16–18]. Sensitization to weed pollen varied widely across studies, with reported frequencies ranging from 14% to 54%, and in some cohorts, weed pollen was the predominant aeroallergen [11, 16, 17]. The variability in sensitisation to weed allergens across studies may be attributed to several factors, including geographic and climatic differences that influence pollen distribution, and heterogeneity in study populations. Our findings on Parthenium sensitization are consistent with a study from South India, which reported a prevalence of 28.2% [16]. Sensitisation to Cynodon has been reported to vary widely, ranging from 2% to 54% across studies [11–18]. The study from Maharashtra reported Cynodon dactylon as the most common weed pollen allergen (26.3%), exceeding the prevalence observed in our cohort [13].
The prevalence of house dust sensitization in Indian studies ranges from 4% to 67%, and the prevalence observed in our cohort falls within this range [11, 12, 14, 16–18]. Variability in sensitization to house dust across studies may result from differences in environmental and housing conditions, population characteristics, and the type and standardisation of allergens used for SPT, which may not accurately reflect the indoor environment of the study population. Sensitization to mold allergens among asthma patients has been reported to range from 5.9% to 19.6%, which is comparable to our finding of 21% [11–16].
We observed that aeroallergen sensitisation was more frequent among males, consistent with studies from Europe and North America [19, 20]. However, a study from Delhi, India, reported similar sensitisation rates between sexes [11]. In our cohort, the prevalence of allergic rhinitis did not differ significantly between the phenotypes, in contrast to other studies that reported a stronger association between allergic rhinitis and atopy [19, 20].
Atopic asthma is typically associated with T2 inflammation, characterised by eosinophilic inflammation, elevated serum IgE levels, and increased exhaled nitric oxide. Although non-atopic asthma may exhibit T2-high inflammation, it can also present with T2-low or mixed inflammatory profiles. In our cohort, peripheral blood eosinophil counts did not differ between atopic and non-atopic patients, whereas discordance in blood eosinophil counts between these phenotypes has been reported [11, 19]. We also observed that the prevalence of eosinophilic asthma did not differ significantly between atopic and non-atopic patients. Serum IgE concentrations vary widely across different ethnic populations. Sharma et al. [21] reported wide variation in serum IgE levels among Indian patients with asthma, ranging from 100 to 4,000 IU/mL. Our study demonstrated significantly higher serum IgE levels in patients with atopic asthma, consistent with findings from other studies [11, 19, 22].
Prior studies [11, 19, 20, 22] have examined differences in spirometric indices between atopic and non-atopic asthma. Some studies [19, 22] reported a significantly lower FEV1/FVC ratio in non-atopic asthma. We observed a lower FEV1/FVC ratio in atopic asthma, although the difference was not statistically significant. Consistent with our findings, previous studies [19, 22] have reported no significant difference in the severity of airflow obstruction, as assessed by FEV1% predicted, between atopic and non-atopic asthma. However, Nieves et al. [20] reported that both FVC% predicted and FEV1% predicted were significantly higher in atopic than in non-atopic asthma. Consistent with this, we also observed significantly higher FVC in atopic asthma, although the underlying mechanism remains unclear.
T2-high asthma is often associated with more pronounced small airway dysfunction [23]. To our knowledge, no prior study has directly compared oscillometry parameters between atopic and non-atopic asthma. Our study is the first to demonstrate that the severity and frequency of impairment in oscillometric parameters do not differ significantly between these two phenotypes. The mean z-scores for respiratory impedance, particularly markers of small airway dysfunction, were markedly elevated in both groups, indicating substantial impairment irrespective of atopic status, which may have limited the detection of intergroup differences.
This study was conducted at a single tertiary care centre with a hospital-based population, which may limit generalisability. In addition, only a selected panel of pollen allergens relevant to the local region was tested and may not represent the full spectrum of aeroallergens. Among oscillometric parameters, X5 tended to be lower (i.e., more negative) in patients with non-atopic asthma; however, this difference did not reach statistical significance. This observation may be influenced by the sample size and warrants further evaluation in larger samples.
In conclusion, the majority of adult patients with bronchial asthma were sensitised to at least one aeroallergen, predominantly indoor allergens, particularly HDM. Despite differences in immunopathogenesis between atopic and nonatopic asthma, impairments in oscillometric parameters, including small airway dysfunction and severity of airflow obstruction, do not differ significantly between them.
BDR: bronchodilator responsiveness
CIs: confidence intervals
FEV1: forced expiratory volume in 1 s
Fres: resonant frequency
FVC: forced vital capacity
HDM: house dust mites
IQR: interquartile range
MMEF: maximal mid-expiratory flow rate
R5: whole-breath respiratory system resistance at 5 Hz
R5–19: difference in whole-breath respiratory resistance between 5 Hz and 19 Hz
SPT: skin prick test
X5: whole-breath respiratory system reactance at 5 Hz
The author thanks Mrs Manjula R, Mrs Rajyalakshmi Kundrapu and Mr Bheem Prasad Jaiswal for their assistance with study procedures.
SD: Conceptualization, Supervision, Writing—original draft, Writing—review & editing. AM: Investigation, Validation. Both authors read and approved the submitted version.
The authors declare that they have no conflicts of interest.
The study was approved by the Institutional Ethics Committee of All India Institute of Medical Sciences, Raipur, India (Approval No. 4046/IEC-AIIMSRPS/2023, dated 31 October 2023) and complies with the Declaration of Helsinki.
Informed consent to participate in the study was obtained from all participants.
Not applicable.
The data of this manuscript could be available from the corresponding author upon reasonable request.
Not applicable.
© The Author(s) 2026.
Open Exploration maintains a neutral stance on jurisdictional claims in published institutional affiliations and maps. All opinions expressed in this article are the personal views of the author(s) and do not represent the stance of the editorial team or the publisher.
Copyright: © The Author(s) 2026. This is an Open Access article licensed under a Creative Commons Attribution 4.0 International License (https://creativecommons.org/licenses/by/4.0/), which permits unrestricted use, sharing, adaptation, distribution and reproduction in any medium or format, for any purpose, even commercially, as long as you give appropriate credit to the original author(s) and the source, provide a link to the Creative Commons license, and indicate if changes were made.

View: 523
Download: 24
Times Cited: 0