 Meta-Analysis

Affiliation:
Section of Endocrinology, Diabetes and Metabolism, Department of Medicine, University and Azienda Ospedaliera Universitaria Integrata of Verona, 37126 Verona, Italy
Email: alessandro.mantovani@univr.it
ORCID: https://orcid.org/0000-0002-7271-6329
Affiliation:
Section of Endocrinology, Diabetes and Metabolism, Department of Medicine, University and Azienda Ospedaliera Universitaria Integrata of Verona, 37126 Verona, Italy
Affiliation:
Section of Endocrinology, Diabetes and Metabolism, Department of Medicine, University and Azienda Ospedaliera Universitaria Integrata of Verona, 37126 Verona, Italy
Affiliation:
Section of Endocrinology, Diabetes and Metabolism, Department of Medicine, University and Azienda Ospedaliera Universitaria Integrata of Verona, 37126 Verona, Italy
Affiliation:
Section of Endocrinology, Diabetes and Metabolism, Department of Medicine, University and Azienda Ospedaliera Universitaria Integrata of Verona, 37126 Verona, Italy
Affiliation:
Section of Endocrinology, Diabetes and Metabolism, Department of Medicine, University and Azienda Ospedaliera Universitaria Integrata of Verona, 37126 Verona, Italy
Email: giovanni.targher@univr.it
Explor Med. 2020;1:108–123 DOI: https://doi.org/10.37349/emed.2020.00008
Received: March 30, 2020 Accepted: May 02, 2020 Published: June 29, 2020
Academic Editor: Lindsay A. Farrer, Boston University School of Medicine, USA
The article belongs to the special issue Exploring Type 2 Diabetes Mellitus
Aim: Recent randomized controlled trials (RCTs) have tested the efficacy of glucagon-like peptide-1 receptor agonists (GLP-1 RA) to specifically treat non-alcoholic fatty liver disease (NAFLD). We performed a meta-analysis of RCTs to investigate the efficacy of GLP-1 RAs for treatment of NAFLD or non-alcoholic steatohepatitis (NASH).
Methods: We systematically searched PubMed and ClinicalTrials.Gov databases utilizing specific terms to identify placebo-controlled or head-to-head RCTs (last research on March 1, 2020) involving NAFLD patients with the aim of evaluating the efficacy of GLP-1 RAs to treat NAFLD/NASH. Primary outcomes were changes in serum liver enzymes, liver fat content, or histologic resolution of NASH. Weighted mean differences (WMD) were used to test the differences between the treatment arms.
Results: Overall, we found 7 placebo-controlled or head-to-head RCTs involving 472 middle-aged individuals (66% men; 77% with established diabetes) followed for a median of 16 weeks that have used liraglutide or exenatide to treat NAFLD on imaging (n = 6) or biopsy (n = 1). Compared to placebo or reference therapy, treatment with GLP-1 RAs decreased serum alanine aminotransferase [n = 7 studies; WMD: –8.77 IU/L, 95% confidence intervals (CI) –17.69 to 0.14 IU/L; I2 = 87.3%], gamma-glutamyltransferase levels (n = 4 studies; WMD: –10.17 IU/L, 95% CI –14.27 IU/L to –6.07 IU/L; I2 = 0%) and imaging-defined liver fat content (n = 4 studies; WMD: –6.23%, 95% CI –8.95% to –3.51%; I2 = 85.9%). In one RCT involving 55 patients with biopsy-proven NASH, a 48-week treatment with liraglutide also led to a greater histological resolution of NASH than placebo.
Conclusions: GLP-1 RAs (mostly liraglutide) seem to be a promising treatment option for NAFLD or NASH.
Non-alcoholic fatty liver disease (NAFLD) is a metabolic liver disease that includes a variety of progressive pathologic conditions, spanning from simple steatosis to steatohepatitis (NASH), advanced fibrosis and, lastly, cirrhosis [1, 2]. To date, NAFLD is an increasingly recognized public health problem worldwide, affecting roughly a quarter of the general population and up to 70–90% of patients who are obese or have type 2 diabetes mellitus (T2DM) [1–3]. The burden of NAFLD is influenced by the epidemics of obesity and T2DM, and the prevalence of these pathologic conditions is also expected to increase in the future.
Over the last decade, it has become evident that NAFLD (principally its more severe histologic forms) is not only related to increased liver-related morbidity and mortality [1, 2], but also increased risk of relevant extra-hepatic diseases, such as cardiovascular disease (the principal cause of mortality in patients with NAFLD), cancers and chronic kidney disease [2–6].
Although the pathogenesis of NAFLD is multifactorial, it is important to underline that this burdensome liver disease is linked with insulin resistance, abdominal obesity, and T2DM [1, 2, 5, 7]. Indeed, strong evidence indicates that abdominal obesity, T2DM and metabolic syndrome can synergistically contribute to the development and the progression of NAFLD [1, 2, 5]. As with other chronic liver diseases, the severity of liver fibrosis is the principal histological feature of long-term adverse clinical outcomes in NAFLD [2, 8–10]. Moreover, on the other hand, NAFLD is related to increased risk of T2DM and metabolic syndrome [11, 12].
To date, specific pharmacological treatments for NAFLD are not available. The mainstay of NAFLD management is lifestyle modification to prompt weight loss through diet and physical exercise [2, 13, 14]. However, based on the strong link existing between NAFLD and insulin resistance or T2DM, many non-randomized interventional studies and randomized controlled trials (RCTs) have investigated the role of “older” hypoglycaemic agents (i.e. metformin and pioglitazone) and other newer anti-hyperglycemic drugs in NAFLD patients, irrespective of the presence of T2DM [5, 13–15]. The most reliable data regarding the efficacy of various hypoglycaemic agents in patients with biopsy-proven NASH concern pioglitazone [13–15]. However, long-term safety concerns have limited its use. Among the newer anti-hyperglycaemic agents, glucagon-like peptide 1 receptor agonists (GLP-1 RAs) are a class of glucose-lowering drugs that are also able to induce significant weight loss and improve insulin resistance [16]. In addition, in people with T2DM, GLP-1 RAs strongly decrease the adverse cardiovascular and renal outcomes [17], suggesting that this class of anti-hyperglycaemic drugs may be a reasonable option to treat NAFLD in patients with and without diabetes mellitus.
For these reasons, we have carried out a comprehensive systematic review and meta-analysis of placebo-controlled or head-to-head RCTs that have assessed the GLP-1 RAs in the treatment of NAFLD.
We conducted a systematic review and meta-analysis following with the preferred reporting items for systematic reviews and meta-analyses (PRISMA) guidelines. For the present study, we have included placebo-controlled or head-to-head RCTs conducted in adults (age > 18 years) with NAFLD in which GLP-1 RAs were used for the treatment of NAFLD. We have included RCTs with at least 20 patients per arms.
Eligible studies [18–26] were obtained by searching PubMed and ClinicalTrials.Gov databases until March 1, 2020 (date of the last research), using the following keywords: “non-alcoholic fatty liver disease” (OR “NAFLD” OR “non-alcoholic steatohepatitis” OR “NASH”) AND “glucagon-like peptide-1 receptor agonists” OR “GLP-1 RA” OR “liraglutide” OR “exenatide” OR “dulaglutide” OR “albiglutide” OR “semaglutide”. Searches were confined to placebo-controlled or head-to-head RCTs in which the diagnosis of NAFLD was made by liver biopsy or imaging techniques (i.e. ultrasonography, computed tomography, magnetic resonance imaging, and/ or spectroscopy). Studies that included patients with significant alcohol consumption and secondary causes of chronic liver disease were excluded. In addition, non-English-language articles, editorials, commentaries and abstracts, unpublished studies or non-randomized studies were excluded. One investigator screened citations, whereas a second one assessed the excluded citations. Two investigators (AM and GT) judged full-text articles by using the inclusion criteria. Disagreements were then resolved by consensus.
For eligible RCTs [18–24], we obtained data on the main characteristics of participants, type of intervention, methods used for the diagnosis NAFLD, as well as information on primary outcomes. Specifically, the primary outcomes were alterations in serum liver enzyme levels [i.e. alanine aminotransferase (ALT), aspartate aminotransferase (AST) and gamma-glutamyltransferase (GGT)], liver fat content on imaging techniques, as well as alterations in the histologic scores of NAFLD or histologic resolution of NASH in the two treatment arms. We also obtained data on weight loss and changes in the levels of hemoglobin A1c and, whenever available, information on visceral adipose tissue (as assessed by imaging methods) and adverse events.
Two investigators evaluated the risk of bias independently. For this purpose, we used the Cochrane Collaboration’s tool [27]. It is important to remember that this tool evaluates 7 potential sources of bias: random sequence generation, allocation concealment, blinding of participants and personnel, blinding of outcome assessment, incomplete outcome data, selective reporting, and other bias [27]. For each domain, we categorized RCTs into three categories: low, unclear, and high risk of bias [27].
The effect sizes were displayed as weighted mean difference (WMD) and 95% confidence intervals (CI) for RCTs describing primary outcome measures between patients with and without NAFLD. The overall estimate of the effect size was computed using a random-effects model [28]. When requested, we also calculated mean difference for continuous outcomes both at baseline and at the end of the trial by using specific statistical methods [28, 29].
Visual inspection of the forest plots was used to estimate the heterogeneity. The heterogeneity among studies was also tested by the I2-statistics. Specifically, the interpretation of the I2-statistics is as follows: I2 values of roughly 25% show low heterogeneity, I2 values of roughly 50% show medium heterogeneity, whereas I2 values of roughly 75% show high heterogeneity [30].
In order to test the sources of heterogeneity among the RCTs, we also conducted subgroup analyses by study country (Asia vs. Europe), methods used for the diagnosis of NAFLD (imaging vs. biopsy), median duration of the trial or different GLP-1 RA drug used (liraglutide vs. exenatide). Further sensitivity analyses were also made by omitting one study at a time (data not reported).
Since the number of the eligible RCTs included in the meta-analysis was less than 10, we performed neither meta-regression analyses nor funnel plots for assessing potential publication bias [28].
All statistical tests were two sided and used a significance level of P < 0.05. All statistical analyses were performed using the software STATA® 14.2 (Stata, College Station, TX).
The flow diagram of the study selection is reported in Figure S1. As reported, we identified 9 potentially RCTs from publication databases until March 1, 2020 [18–26]. After assessing the full text of such 9 publications, we further excluded two studies [25, 26] for specific reasons (Figure S2).
In total, seven placebo-controlled (n = 3 studies) or head-to-head (n = 4 studies) RCTs were considered eligible for our meta-analysis and were therefore tested for quality [18–24]. Table 1 reports the main characteristics of 7 RCTs are described in. Overall, there were 472 middle-aged obese individuals [66% men; mean age 47 ± 3 years; mean (± SD) body mass index 32 ± 3 kg/m2; mean AST 49 ± 37 UI/L; mean ALT 66 ± 50 UI/L; prevalence of diabetes 77%] with NAFLD or NASH, who were followed for a median period of 16 weeks (inter-quartile range: 12–24 weeks). Of 472 individuals, 253 were randomly assigned to the placebo or reference therapy group, whereas 219 were randomly allocated to either exenatide (n = 3 RCTs) or liraglutide (n = 4 RCTs) in order to treat NAFLD or NASH specifically. As shown in Table 1, five RCTs included exclusively patients with T2DM [18, 20, 21, 23, 24], one RCT was conducted in both patients with and without T2DM [19], whilst one RCT included non-diabetic women with polycystic ovary syndrome [22]. Four RCTs were performed in China [15, 18, 20, 21] and three [16, 17, 19] in Europe (i.e. United Kingdom, France, and Denmark). The diagnosis of NAFLD was made by liver biopsy in one RCT, i.e. the liraglutide efficacy and action in NASH (LEAN) study that included adults with biopsy-proven NASH [19]. By contrast, the detection of NAFLD was based on liver ultrasonography in two RCTs [18, 21], whereas in the remaining four RCTs, the diagnosis of NAFLD was based on magnetic resonance imaging-proton density fat fraction or magnetic resonance spectroscopy [20, 22–24].
Placebo-controlled or active-controlled RCTs of GLP-1 RAs for treatment of NAFLD or NASH (ordered by publication year)
| Author, year, country (Ref) | Study characteristics | Interventions (n), trial length (weeks) | Efficacy and/or effectiveness outcomes A vs. B (or vs. C) | Major adverse effects | Cochrane RCT’s quality scale |
|---|---|---|---|---|---|
| Shao et al. 2014; China [18] | Patients with T2DM and NAFLD on ultrasound Mean age: 43 years; male sex: 48%; BMI 30 kg/m2; HbA1c 7.6%; ALT 166 IU/L; AST 123 IU/L | A. Exenatide + glargine (n = 30) B. Intensive insulin: insulin aspart + insulin glargine (n = 30) Length: 12 weeks | Reversal rate of NAFLD on ultrasound (A vs. B): 93% vs. 67%, P < 0.01 Differences in body weight change post-treatment vs. pre- treatment: −7.8 kg vs. 3.3 kg, P < 0.001 No difference in changes in HbA1c between the groups | Not reported | Random sequence generation (selection bias): unclearAllocation concealment (selection bias): unclearBlinding of participants and researchers (performance bias): unclearBlinding of outcome assessment (detection bias): unclearIncomplete outcome data (attrition bias): unclear Selective reporting (reporting bias): unclear Other bias: unclear |
| Armstrong et al. 2016; UK [19] | Patients with biopsy-proven NASH (i.e. LEAN trial) Mean age: 51 years; male sex: 60%; BMI 36 kg/m2; ALT 71 IU/L; AST 51 IU/L; fibrosis F3-F4 (on histology) 52%; pre-existing diabetes: 33% | A. Liraglutide 1.8 mg (n = 26) B. Placebo (n = 26) Length: 48 weeks | Histologic resolution of NASH: 39% vs. 9%, P = 0.019 Change in histologic NAS score: −1.3 vs. −0.8, P = 0.24 Change in fibrosis stage: −0.2 vs. 0.2, P = 0.11 Fibrosis improvement: 26% vs. 14%, P = 0.46 Fibrosis worsening: 9% vs. 36%, P = 0.04 Change in serum ALT: −26.6 UI/L vs. −10.2 UI/L, P = 0.16 Change in serum AST: −27 UI/L vs. +9 IU/L, P = 0.02 | Gastro-intestinal disorders in the liraglutide vs. placebo: 81% vs. 65% | Random sequence generation (selection bias): low Allocation concealment (selection bias): low Blinding of participants and researchers (performance bias): low Blinding of outcome assessment (detection bias): low Incomplete outcome data (attrition bias): low Selective reporting (reporting bias): low Other bias: low |
| Dutour et al. 2016; France [20] | Patients with T2DM, 95% of whom had NAFLD on MR spectroscopy Mean age: 52 years; male sex: 48%; BMI 36 kg/m2; HbA1c 7.5%; ALT 29 IU/L; AST 22 IU/L | A: Exenatide 5–10 mcg bid (n = 22) B: Placebo (n = 22) Length: 26 weeks | Exenatide and reference treatment had a similar improvement in terms of HbA1c values (−0.7 ± 0.3% vs. −0.7 ± 0.4%; P = 0.29) Significant weight loss was observed in the exenatide group (–5.5 ± 1.2 kg vs. −0.2 ± 0.8 kg, P = 0.001 for difference between groups) When compared with the reference therapy, exenatide induced a significant reduction in liver fat content (–23.8 ± 9.5% vs. 12.5 ± 9.6%, P = 0.007) | Not reported | Random sequence generation (selection bias): unclear Allocation concealment (selection bias): unclear Blinding of participants and researchers (performance bias): unclear Blinding of outcome assessment (detection bias): unclear Incomplete outcome data (attrition bias): unclear Selective reporting (reporting bias): unclear Other bias: unclear |
| Feng et al. 2017; China [21] | Patients with T2DM and NAFLD on ultrasound Mean age: 47 years; male sex: 75%; BMI 28 kg/m2; HbA1c 9.1%; ALT 49 IU/mL; AST 31 IU/L | A. Liraglutide up to 1.8 mg/d (n = 31) B. Metformin up to 2000 mg/d (n = 31) C. Gliclazide 60–120 mg/d (n = 31) Length: 24 weeks | Liver fat content decreased in all groups as follows: from 36.7 ± 3.6% to 13.1 ± 1.8% in the liraglutide group; from 33.0 ± 3.5% to 19.6 ± 2.1% in the gliclazide group, and from 35.1 ± 2.3% to 18.4 ± 2.2% in the metformin group (P < 0.001 for all treatment groups, final vs. baseline) Reduction in liver fat content following liraglutide treatment was greater when compared to that following gliclazide treatment (P = 0.001) Both liraglutide and metformin treatments reduced body weight and improved serum liver enzymes HbA1c levels were lower in the liraglutide and metformin groups than in the gliclazide group | Not reported | Random sequence generation (selection bias): unclear Allocation concealment (selection bias): unclear Blinding of participants and researchers (performance bias): unclear Blinding of outcome assessment (detection bias): unclear Incomplete outcome data (attrition bias): unclear Selective reporting (reporting bias): unclear Other bias: unclear |
| Frøssing et al. 2017; Denmark [22] | Women with polycystic ovary syndrome and NAFLD on MR spectroscopy Mean age: 47 years; female sex: 100%; BMI 33 kg/m2 | A. Liraglutide 1.8 mg/d (n = 48) B. Placebo (n = 24) Length: 26 weeks | Liraglutide treatment reduced body weight by 5.2 kg (–5.6% from baseline), liver fat content by 44% (on MR spectroscopy) as well as NAFLD prevalence by roughly two-thirds (P < 0.01 for all) Liraglutide treatment reduced fasting plasma glucose and HbA1c [liraglutide vs. placebo, mean between-group difference (95% CI), −0.24 (–0.44 to −0.04) mmol/L; mean HbA1c (95% CI), −1.38 (–2.48 to −0.28) mmol/mol] | Nausea and constipation in the liraglutide group | Random sequence generation (selection bias): unclear Allocation concealment (selection bias): unclear Blinding of participants and researchers (performance bias): unclear Blinding of outcome assessment (detection bias): unclear Incomplete outcome data (attrition bias): unclear Selective reporting (reporting bias): unclear Other bias: unclear |
| Yan et al. 2019; China [23] | Patients with T2DM and NAFLD on MRI- PDFF Mean age: 44 years; male sex: 69%; BMI 29.8 kg/m2; HbA1c 7.7%; ALT 43 IU/L; AST 33 IU/L | A. Liraglutide 1.8 mg/d (n = 24) B. Insulin glargine 0.2 IU/kg/d (n = 24) C. Sitagliptin 100 mg/d (n = 27) Length: 26 weeks | In the liraglutide and sitagliptin groups, liver fat content decreased from baseline to week 26 (in particular, in the liraglutide group the reduction ranged from 15.4 ± 5.6% to 12.5 ± 6.4%, P < 0.001, while in the sitagliptin group the reduction ranged from 15.5 ± 5.6% to 11.7 ± 5.0%, P = 0.001) HbA1c levels decreased in all treatment groups (in particular, in the liraglutide group the reduction ranged from 7.8 ± 1.4% to 6.8 ± 1.7%, P < 0.001; in the sitagliptin group from 7.6 ± 0.9% to 6.6 ± 1.1%, P = 0.016; and in the insulin group from 7.7 ± 0.9% to 6.9% ± 1.1%, P = 0.013) Body weight decreased in the liraglutide and in the sitagliptin groups, but not in the insulin glargine group | Not reported | Random sequence generation (selection bias): unclear Allocation concealment (selection bias): unclear Blinding of participants and researchers (performance bias): unclear Blinding of outcome assessment (detection bias): unclear Incomplete outcome data (attrition bias): unclear Selective reporting (reporting bias): unclear Other bias: unclear |
| Liu et al. 2020; China [24] | Patients with T2DM and NAFLD on MRI- PDFF Mean age: 48 years; male sex: 50%; BMI 28 kg/m2; HbA1c 8.3%; ALT 38 IU/L; AST 28 IU/L | A. Exenatide 1.8 mg/d (n = 38) B. Insulin glargine 0.2 IU/kg/d (n = 38) Length: 24 weeks | Liver fat content was reduced after exenatide treatment (Δ liver fat −17.6 ± 12.9%). Exenatide treatment also led to a greater reduction in the visceral adipose tissue (ΔVAT −43.6 ± 68.2 cm2), serum ALT, AST, GGT levels, BMI and waist circumference than insulin glargine | Adverse events were comparable between the two groups | Random sequence generation (selection bias): unclear Allocation concealment (selection bias): unclear Blinding of participants and researchers (performance bias): unclear Blinding of outcome assessment (detection bias): unclear Incomplete outcome data (attrition bias): unclear Selective reporting (reporting bias): unclear Other bias: unclear |
BMI: body mass index; HbA1c: hemoglobin A1c; MR: magnetic resonance; MRI-PDFF: magnetic resonance imaging-proton density fat fraction; VAT: visceral adipose tissue
In eligible RCTs, GLP-1 RAs had a similar adverse event profile to either placebo or reference therapy, except for a slight increase of the frequency of gastro-intestinal symptoms, such as nausea, diarrhea, and loss of appetite. However, it is important to highlight that these adverse events were mostly temporary and mild in severity across the RCTs.
As shown in Figures 1, 2 and 3, when compared to placebo or reference therapy, GLP-1 RAs decreased the circulating levels of both ALT (n = 7 studies; pooled WMD: –8.77 IU/L, 95% CI –17.69 IU/L to 0.14 IU/L) or GGT (n = 4 studies; pooled WMD: –10.17 IU/L, 95% CI –14.27 IU/L to –6.07 IU/L) and tended to decrease serum AST levels (n = 6 studies; pooled WMD: –3.41 IU/L, 95% CI –11.49 IU/L to 4.68 IU/L).
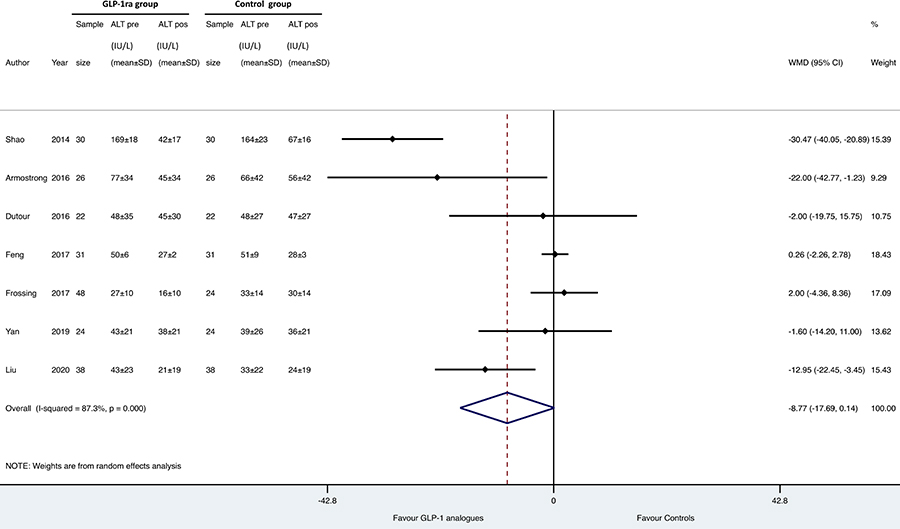
Forest plot and pooled estimates of the effect of GLP-1 RAs on changes in serum alanine aminotransferase (ALT) levels in the eligible placebo-controlled or head-to-head RCTs (n = 7). The effect size was expressed as WMD and 95% CIs
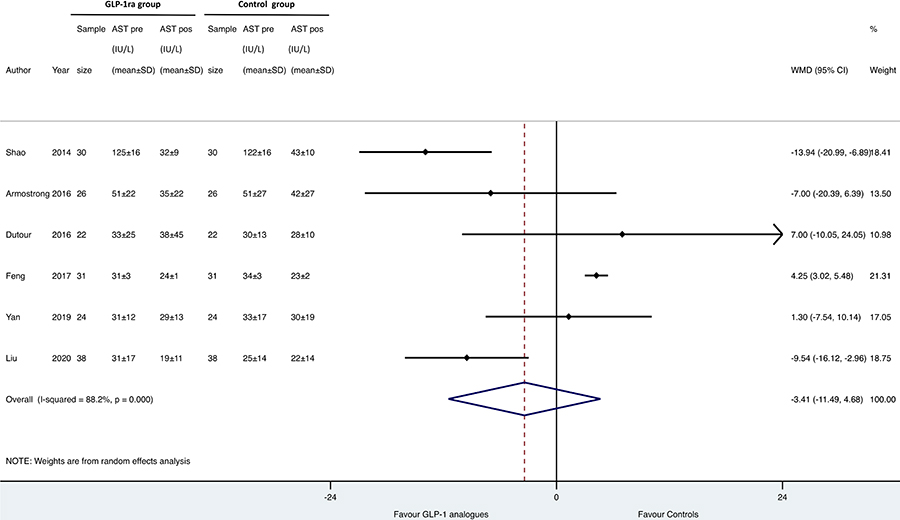
Forest plot and pooled estimates of the effect of GLP-1 RAs on changes in serum aspartate aminotransferase (AST) levels of in the eligible RCTs (n = 6). The effect size was expressed as WMD and 95% CIs
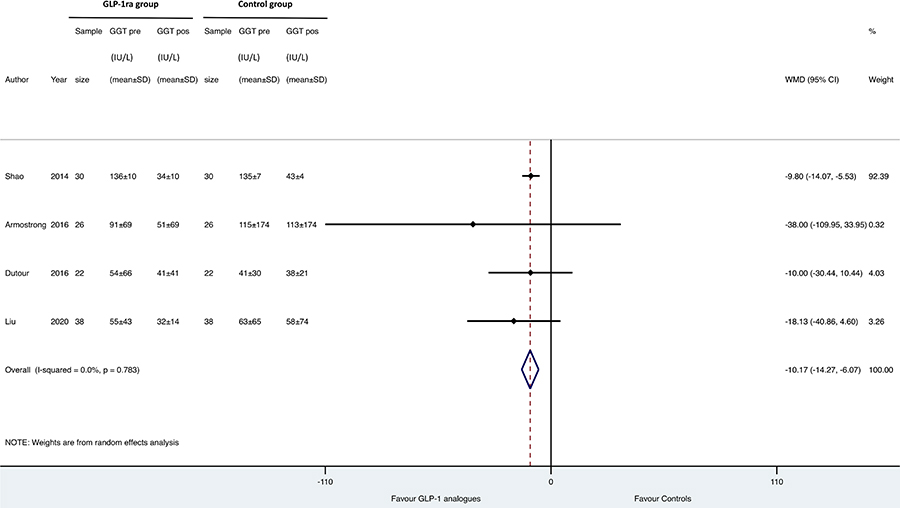
Forest plot and pooled estimates of the effect of GLP-1 RAs on changes in serum gamma-glutamyltransferase (GGT) levels in the eligible placebo-controlled or head-to-head RCTs (n = 4). The effect size was expressed as WMD and 95% CIs
Figure 4 reports the forest plot and pooled estimates of the effect of GLP-1 RAs on changes in liver fat content in the eligible RCTs using imaging methods for measuring it (notably, the LEAN study was not included in the figure as this trial used liver biopsy). When compared to placebo or reference therapy, GLP-1 RAs significantly improved liver fat content (n = 4 studies; pooled WMD: –6.23%, 95% CI –8.95% to –3.51%).
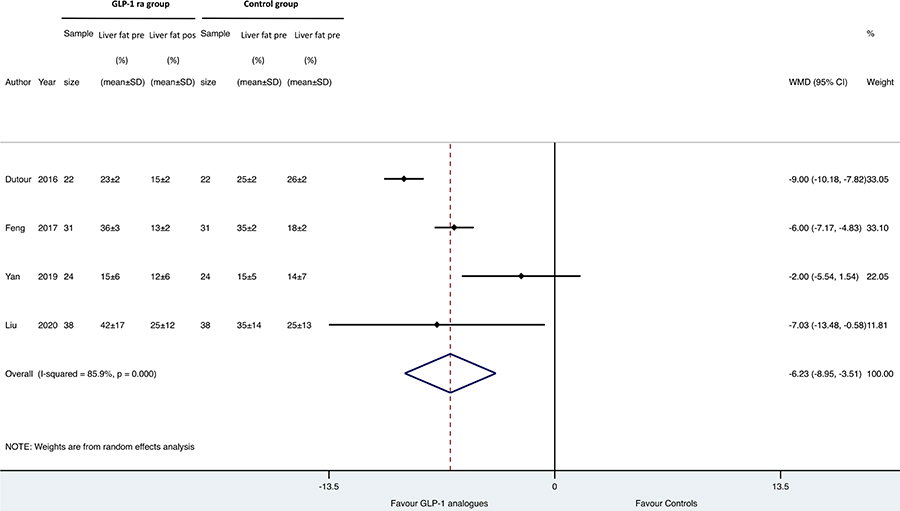
Forest plot and pooled estimates of the effect of GLP-1 RAs on changes in liver fat content as detected by imaging methods in the eligible placebo-controlled or head-to-head RCTs (n = 4). The effect size was expressed as WMD and 95% CIs
It should be noted that, the LEAN trial [19], using liver biopsy for investigating the effect of liraglutide in patients with NASH, documented that 40% of patients, who received liraglutide had histological resolution of NASH with no worsening of fibrosis when compared with 9% of patients in the placebo group (P < 0.05). In addition, in that study, fewer patients in the liraglutide group had progression of fibrosis when compared to the placebo group and a greater proportion of patients in the liraglutide group had also significant improvements in steatosis and hepatocyte ballooning. No difference was seen in lobular inflammation and NAFLD activity score between the two treatment arms. Patients in the liraglutide group also had a statistically significant reduction in body weight and serum liver enzyme levels.
As shown in Table 2, we did subgroup analyses to test the sources of heterogeneity among the eligible RCTs. After stratifying the RCTs for study country, diagnostic methods of NAFLD, length of the trial or single GLP-1 RA drug tested, the positive effects of GLP-1 RAs on serum liver enzymes and liver fat content were substantially consistent across all subgroups.
Effects of GLP-1 RAs on changes in serum liver enzyme levels and liver fat content (assessed by imaging methods) in the eligible RCTs, stratified by study country, methods used for the diagnosis of NAFLD, individual GLP-1 RA drug used and duration of the trial
| ALT (IU/L) | AST (IU/L) | GGT (IU/L) | Liver fat content (%) | |
|---|---|---|---|---|
| Study Country | ||||
| Asia | WMD −11.1(95% CI −25.7 to 3.6) I2 = 93%n = 4 studies | WMD −4.3 (95% CI −14.2 to 5.6)I2 = 92%n = 4 studies | WMD −10.1(95% CI −14.3 to 5.9)I2 = 0%n = 2 studies | WMD −4.9(95% CI −7.8 to −2.0)I2 = 57%n = 3 studies |
| Europe | WMD −4.6(95% CI −17.4 to 8.3) I2 = 58%n = 3 studies | WMD −1.0(95% CI −14.6 to 12.5)I2 = 37%n = 2 studies | WMD −12.1(95% CI −31.8 to 7.6) I2 = 0%n = 2 studies | WMD −9.0 (95% CI −10.2 to −7.8)I2 = 0%n = 1 study |
| Diagnosis of NAFLD | ||||
| Ultrasonography | WMD −14.7(95% CI −44.9 to 15.4) I2 = 97%n = 2 studies | WMD −4.5 (95% CI −22.3 to 13.3)I2 = 96%n = 2 studies | WMD −9.8(95% CI −14.1 to −5.5)I2 = 0%n = 1 study | WMD −6.0(95% CI −7.2 to −4.8) I2 = 0%n = 1 study |
| Biopsy | WMD −22.0(95% CI −42.8 to −1.3) I2 = 0%n = 1 study | WMD −7.0(95% CI −20.4 to 6.4)I2 = 0%n = 1 studies | WMD −38.0(95% CI −109 to 33.9)I2 = 0%n = 1 study | Not available on imaging methods |
| MRI-PDFF or spectroscopy | WMD −3.6 (95% CI −11.4 to 4.3) I2 = 54%n = 4 studies | WMD −2.2 (95% CI −11.8 to 7.4)I2 = 64%n = 3 studies | WMD −13.6(95% CI −28.8 to 1.6) I2 = 0%n = 2 studies | WMD −6.1(95% CI −11.2 to −0.9) I2 = 85%n = 3 studies |
| Individual GLP-1 RA drug used | ||||
| Exenatide | WMD −16.3 (95% CI −31.8 to −0.87) I2 = 81%n = 3 studies | WMD −8.6 (95% CI −16.8 to −0.38)I2 = 60%n = 3 studies | WMD −10.1(95% CI −14.2 to −5.9) I2 = 0%n = 3 studies | WMD −8.9 (95% CI −10.1 to −7.8) I2 = 0%n = 2 studies |
| Liraglutide | WMD −0.43(95% CI −4.9 to 4.1) I2 = 37%n = 4 studies | WMD 2.5 (95% CI −2.2 to 7.2)I2 = 35%n = 3 studies | WMD −38.0(95% CI −109 to 33.9)I2 = 0%n = 1 study | WMD −4.4(95% CI −8.2 to −0.5)I2 = 77%n = 2 studies |
| Median length of trial | ||||
| Length ≤ 24 weeks | WMD −13.9(95% CI −32.8 to 4.8) I2 = 95%n = 3 studies | WMD −6.1 (95% CI −18.8 to 6.7)I2 = 95%n = 3 studies | WMD −10.1(95% CI −14.2 to −5.9)I2 = 0%n = 2 studies | WMD −6.0 (95% CI −7.2 to −4.9)I2 = 0%n = 2 studies |
| Length > 24 weeks | WMD −2.5(95% CI (−10.5 to 5.6) I2 = 37%n = 4 studies | WMD 0.8 (95% CI −6.7 to 6.8)I2 = 0%n = 3 studies | WMD −12.1(95% CI −31.8 to 7.6)I2 = 0%n = 2 studies | WMD −5.7(95% CI −12.6 to −1.1) I2 = 92%n = 2 studies |
MRI-PDFF: magnetic resonance imaging-proton density fat fraction
As shown in Figures S2, S3 and S4, when compared to placebo or reference therapy, GLP-1 RAs also improved anthropometric parameters, mostly intra-abdominal visceral adipose tissue (n = 4 studies; pooled WMD: –27.43, 95% CI –42.66 cm2 to –12.2 cm2), and slightly reduced hemoglobin A1c levels (n = 6 studies; pooled WMD: –0.13, 95% CI –0.47% to 0.21%).
Our updated systematic review and meta-analysis involved seven placebo-controlled or head-to-head RCTs (published until March 1, 2020) testing the efficacy of either exenatide (n = 3 studies) or liraglutide (n = 4 studies) to treat NAFLD for a median period of 16 weeks with a total of 472 middle-aged individuals with and without T2DM. Overall, the results of our meta-analysis support the capability of GLP-1 RAs (especially liraglutide) to reduce serum liver enzyme levels (mostly serum GGT concentrations) and to improve NAFLD.
The improvement of NAFLD by liraglutide and other GLP-1 RAs is, in all likelihood, multifactorial and may be mainly thought as a direct consequence of the cumulative effect of these glucose-lowering agents on weight loss, insulin resistance and liver. In fact, the GLP-1 RAs are efficacious for treatment of T2DM and are also able to improve insulin resistance and promote weight loss (on average ~3–4 kg after 24 weeks) [16]. Moreover, it is important to mark that GLP-1 receptors are also highly expressed in human hepatocytes and that GLP-1 RAs may decrease hepatic fat content by reducing de novo lipogenesis, enhancing fatty acid oxidation and improving hepatic insulin signaling both in the hepatocytes [31–33].
From this study, however, it comes to light that a relevant problem in this specific topic is the lack of high-quality RCTs with important hepatic endpoints (i.e. liver histologic data). Indeed, no robust data are currently available in the literature with liver histological endpoint as a primary outcome in order to support the efficacy of GLP-1 RAs as a specific treatment for NAFLD. This is an important and relevant aspect to be taken into consideration when we interpret the results of the present meta-analysis. In fact, we believe that RCTs of pharmacologic treatments designed for improving the liver disease severity in NAFLD patients should constantly include patients with biopsy-proven NASH or advanced fibrosis, that is strongly associated with unfavorable outcomes [2, 8–10, 13, 14]. In addition, although magnetic resonance imaging-estimated proton density fat fraction or proton magnetic resonance spectroscopy can be used to quantify the liver fat content, the capacity of these techniques for detecting NASH and fibrosis is relatively limited [1, 34]. Therefore, on the basis of these considerations, the majority of eligible RCTs included in the present study have obtained a fair quality according to the Cochrane Collaboration’s tool (Table 1). To date, notably, only the LEAN trial has used the liver biopsy for diagnosing and staging NAFLD [19]. In this multicenter phase 2 RCT involving 55 UK obese adults with NASH, it has been documented that patients who were randomly assigned to liraglutide had a greater histological resolution of NASH and significant improvements in individual histologic scores of NASH (except for liver fibrosis regression) when compared to those receiving placebo [19]. The authors of this trial also suggested that the beneficial effects of liraglutide on the histological liver endpoints were presumably owing to its direct hepatic effect and weight loss. The beneficial effect of liraglutide on body weight and, especially, on intra-abdominal visceral adipose tissue has been also documented by the results of our meta-analysis. It should be noted that, in our meta-analysis, we did not include the study of Armstrong et al. [25], [Liraglutide effect and action in diabetes (LEAD) & LEAD-2 trials] and that of Gluud et al. [26], for unsatisfactory inclusion criteria and/or unsatisfactory study design. However, it should be noted that the findings of these two studies were substantially consistent with those of the eligible RCTs included in the present meta-analysis.
Several RCTs with a long duration of follow-up have clearly demonstrated that liraglutide and other long-acting GLP-1 RAs are also able to reduce the risk of developing cardiovascular and renal diseases in patients with T2DM [35–39]. For instance, in a meta-analysis involving many of these RCTs (for a total of nearly 56, 000 T2DM individuals followed for approximately 3 years), Kristensen et al. [17], confirmed that GLP-1 RAs reduced major adverse cardiovascular events by 12% (hazard ratio 0.88, 95% CI 0.82–0.94), hospital admission for heart failure by 9% (hazard ratio 0.91, 95% CI 0.83–0.99) and chronic kidney disease by 17% (hazard ratio 0.83, 95% CI 0.78–0.89).
Based on these aspects, we strongly believe that if larger phase 3 RCTs will confirm the interesting findings of the LEAN trial [19], it is reasonable to suppose that liraglutide and other long-acting GLP-1 RAs will become a suitable treatment option in NAFLD patients.
Our meta-analysis has some limitations. First, it includes a relatively low number of placebo-controlled and head-to-head RCTs with a small sample size and a short follow-up. Second, the eligible RCTs used only liraglutide or exenatide because at present the data on the efficacy and safety of other long-acting GLP-1 RAs (e.g., dulaglutide and semaglutide) in patients with NAFLD are not available. Third, data with liver histological endpoint as a primary outcome were accessible only for the LEAN trial. Therefore, these findings are not conclusive and further investigation is also required.
In conclusion, the results of our updated meta-analysis of placebo-controlled or head-to-head RCTs suggest that, when compared to placebo or reference therapy, GLP-1 RAs (especially liraglutide) show favorable results on reductions in serum liver enzymes, liver fat content and histological resolution of NASH. However, these findings warrant further evaluation in larger, randomized controlled phase 3 trials.
ALT: alanine aminotransferase
AST: aspartate aminotransferase
CI: confidence interval
GGT: gamma-glutamyltransferase
GLP1 RA: glucagon-like peptide-1 receptor agonists
LEAD: liraglutide effect and action in diabetes
LEAN: liraglutide efficacy and action in NASH
NAFLD: non-alcoholic fatty liver disease
NASH: non-alcoholic steatohepatitis
PRISMA: Preferred Reporting Items for Systematic Reviews and Meta-Analyses
RCTs: randomized controlled trials
T2DM: type 2 diabetes mellitus
WMD: Weighted mean difference
The supplementary material for this article is available at:
AM and GT contributed to study concept and design, acquisition of data, and drafting of the manuscript. AM and GT contributed to statistical analysis of data. AM, GB, GP, FP, DS, and GT contributed to analysis and interpretation of data. GB, GP, FP, and DS contributed to critical revision of the manuscript for important intellectual content. AM and GT are the guarantor of this work and, as such, had full access to all the data in the study and takes responsibility for the integrity of the data and the accuracy of the data analysis.
The authors declare that they have no conflicts of interest.
Not applicable.
Not applicable.
Not applicable.
Not applicable.
Not applicable.
© The Author(s) 2020.
Copyright: © The Author(s) 2020. This is an Open Access article licensed under a Creative Commons Attribution 4.0 International License (https://creativecommons.org/licenses/by/4.0/), which permits unrestricted use, sharing, adaptation, distribution and reproduction in any medium or format, for any purpose, even commercially, as long as you give appropriate credit to the original author(s) and the source, provide a link to the Creative Commons license, and indicate if changes were made.

Agostino Milluzzo ... Laura Sciacca
Erika Pedone ... Amelia Caretto
Roberta Malaguarnera ... Salvatore Piro
Saula Vigili de Kreutzenberg
Mauro Maurantonio ... Luca Roncucci
