Original Article

Affiliation:
National Medical Research Center for Therapy and Preventive Medicine, 101990 Moscow, Russia
ORCID: https://orcid.org/0000-0001-8993-7892
Affiliation:
National Medical Research Center for Therapy and Preventive Medicine, 101990 Moscow, Russia
ORCID: https://orcid.org/0000-0002-2812-959X
Affiliation:
National Medical Research Center for Therapy and Preventive Medicine, 101990 Moscow, Russia
ORCID: https://orcid.org/0000-0002-5384-3795
Affiliation:
National Medical Research Center for Therapy and Preventive Medicine, 101990 Moscow, Russia
Email: antonkis@list.ru
ORCID: https://orcid.org/0000-0003-3967-3950
Affiliation:
National Medical Research Center for Therapy and Preventive Medicine, 101990 Moscow, Russia
ORCID: https://orcid.org/0000-0002-4453-8430
Explor Med. 2026;7:1001410 DOI: https://doi.org/10.37349/emed.2026.1001410
Received: March 25, 2026 Accepted: May 13, 2026 Published: June 10, 2026
Academic Editor: Lindsay A. Farrer, Boston University School of Medicine, USA
The article belongs to the special issue Assessment of Atrial and Ventricular Volumes and Functional Properties: Novel Insights
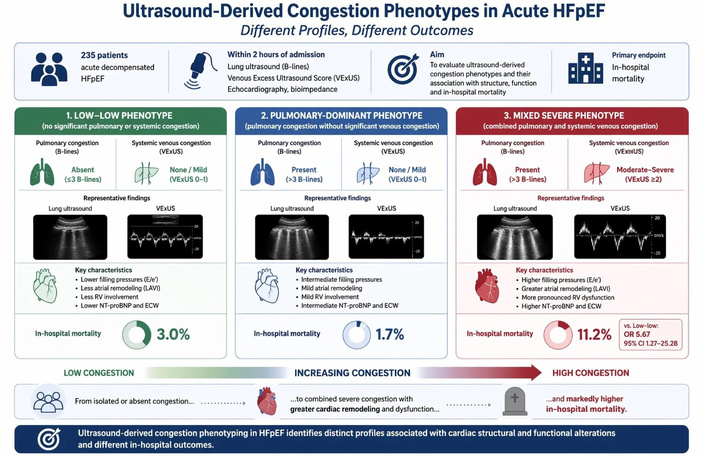
Aim: To evaluate ultrasound-derived congestion phenotypes in acute decompensated heart failure with preserved ejection fraction (HFpEF) and their association with cardiac remodeling and in-hospital outcomes.
Methods: This prospective study included 235 patients (median age 77.0 years, 75.3% women) with acute decompensated HFpEF. Within 2 hours of admission, all patients underwent echocardiography, lung ultrasound (B-lines), venous excess ultrasound score (VExUS) assessment, and bioimpedance analysis. Patients were classified into three phenotypes based on pulmonary (B-lines > 3) and systemic venous congestion (VExUS): low-low (no significant pulmonary or systemic congestion), pulmonary-dominant, and mixed severe. The primary endpoint was in-hospital mortality.
Results: Moderate-to-severe venous congestion (VExUS grade 2–3) was present in 60.8% of patients. The mixed severe phenotype predominated (60.9%) and was associated with higher body mass index (BMI) and waist (p < 0.001). This group demonstrated more advanced cardiac dysfunction, including higher E/e’ (14.9 vs. 11.9; p < 0.001), greater left atrial remodeling (left atrial volume index 45.0 vs. 39.0 mL/m2; p < 0.001), and increased left ventricular mass index (p = 0.010). Right ventricular (RV) involvement was more pronounced, with lower TAPSE (18.0 vs. 20.0 mm; p < 0.001) and higher tricuspid regurgitation velocity (p < 0.001). Markers of congestion showed a gradient, with higher NT-proBNP (3,072.5 vs. 1,197.0 pg/mL; p < 0.001), increased extracellular water (129% vs. 101%; p < 0.001), and lower phase angle (4.9 vs. 5.5; p < 0.001). In-hospital mortality was highest in the mixed severe phenotype [11.2% vs. 3.0% and 1.7%; p = 0.039; odds ratio (OR) 5.67]. B-lines correlated with tricuspid regurgitation velocity, E/e’, and extracellular water (all r ≥ 0.50).
Conclusions: Ultrasound-derived congestion phenotyping in HFpEF identifies distinct profiles associated with atrial and ventricular remodeling and worse in-hospital outcomes. Future studies are required to determine whether phenotype-guided decongestive strategies can improve outcomes beyond risk stratification.
Heart failure (HF) with preserved ejection fraction (HFpEF) accounts for a growing proportion of acute HF (AHF) hospitalizations [1]. Patients with AHF face poor prognosis largely due to lung and systemic congestion, which is the central pathophysiologic driver of these events. Congestion, encompassing intravascular, interstitial, and tissue fluid overload, remains difficult to quantify accurately at the bedside. Traditional assessment relies on symptoms, physical signs, natriuretic peptides, and chest radiography, but these tools frequently fail to detect subclinical or residual congestion and correlate only modestly with true hemodynamic load [2].
In patients with HFpEF, congestion assessment can be even more challenging due to multiple comorbidities and relatively lower natriuretic peptide levels despite comparable venous congestion and end-organ dysfunction to HF with reduced ejection fraction [3]. Moreover, echocardiography, while essential for structural and hemodynamic assessment, does not fully capture the complexity and distribution of congestion, particularly across pulmonary and systemic venous compartments.
This diagnostic gap has fuelled interest in a multimodal, largely noninvasive strategy to refine congestion assessment in acute HFpEF (AHFpEF). Ultrasound-based approaches are at the forefront of this evolution. Transthoracic echocardiography allows estimation of left ventricular (LV) filling pressures and pulmonary pressures, while lung ultrasound (LUS) quantifies extravascular lung water through B-lines and detects pulmonary congestion that frequently precedes or exceeds auscultatory crackles [4]. Inferior vena cava (IVC) metrics and venous Doppler evaluation of hepatic, portal, and renal veins flow, synthesized in frameworks such as the venous excess ultrasound score (VExUS), provide a direct window on systemic venous and splanchnic congestion, which is tightly linked to adverse outcomes [5]. Prospective data indicate that combining clinical examination, biomarkers, echocardiography, and LUS improves risk stratification beyond any single modality, and that ultrasound-derived congestion indices carry strong prognostic value irrespective of ejection fraction [6].
However, despite growing evidence, these tools have not been fully integrated into a unified framework linking congestion patterns with cardiac structural and functional alterations in HFpEF. Therefore, the present study aimed to evaluate ultrasound-derived congestion phenotypes in patients with AHFpEF and to investigate their association with cardiac structure, function, and in-hospital outcomes.
This was a prospective, observational cohort study conducted at the Veresaev City Clinical Hospital, Moscow, Russia. The study included 235 patients aged 50–85 years with a diagnosis of AHFpEF. The median LV ejection fraction was 56.0% (IQR 53.0–59.0). All patients were admitted to the intensive care unit between January 1, 2024 and May 31, 2025.
The inclusion criteria were: age 50–85 years; a previously established or newly diagnosed HFpEF in accordance with current clinical guidelines (presence of symptoms and signs of HF, structural and/or functional cardiac abnormalities consistent with diastolic dysfunction); clinical features of ADHFpEF—worsening of HF symptoms and signs (progressive dyspnea, congestion, orthopnea, development of pulmonary edema) triggered by a precipitating event (hypertensive emergency, arrhythmias or conduction disorders such as paroxysmal atrial fibrillation or bradycardia); and elevated NT-proBNP levels > 900 pg/mL in patients aged 50–75 years and > 1,800 pg/mL in patients older than 75 years.
The exclusion criteria were: acute stroke within the previous 3 months; active malignancy or prior chemotherapy or radiotherapy; severe valvular heart disease; conditions associated with symptoms similar to those of HF (chronic obstructive pulmonary disease, bronchial asthma); and arrhythmias or conduction disorders requiring permanent pacemaker implantation.
The study was conducted in accordance with the principles of Good Clinical Practice and the Declaration of Helsinki (version 2013). All patients provided written informed consent at admission. The study protocol was approved by the Local Ethics Committee of the National Medical Research Center for Therapy and Preventive Medicine (approval No. 04-05/23 dated September 18, 2023). The present analysis was performed within the framework of the GRIF study (ClinicalTrials.gov Identifier: NCT06114498).
Upon admission, all patients underwent physical examination. Serum NT-proBNP concentration was measured using a quantitative immunofluorescence assay on the Getein 1100 analyzer (Getein Biotech Inc., China).
Transthoracic echocardiography according to a standard protocol with assessment of LV filling pressures, chest radiography or computed tomography, LUS, evaluation of venous congestion using the VExUS protocol, bioimpedance vector analysis (BIVA) were performed in less than two hours after admission.
LUS was performed in accordance with the BLUE protocol, with B-lines assessed at four points on each side of the chest. Under normal conditions, fewer than three B-lines are detected in each intercostal space [7]. The presence of ≥ 3 B-lines indicates extravascular lung water accumulation.
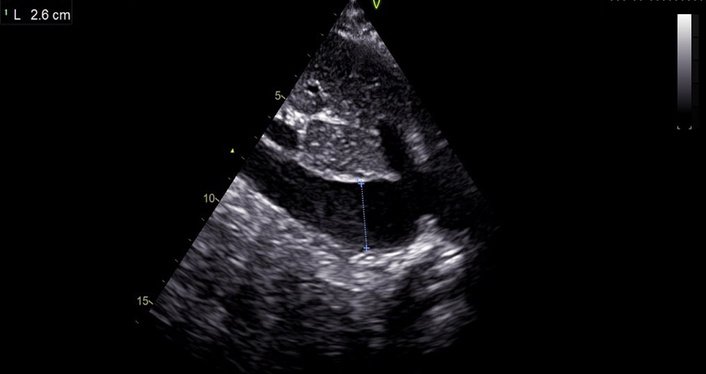
Peripheral venous congestion was assessed using the VExUS protocol [8]. The first step involved measurement of the IVC diameter (Figure 1).
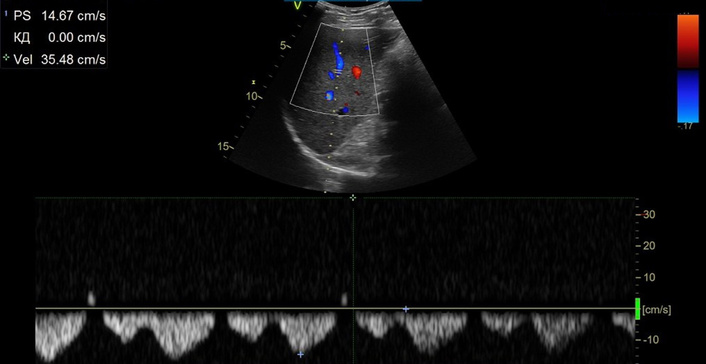
An IVC diameter < 20 mm corresponded to grade 0 (no congestion), in this case further examination was not performed. If the IVC diameter was ≥ 20 mm, pulsed-wave Doppler assessment of the hepatic veins was performed (Figure 2).
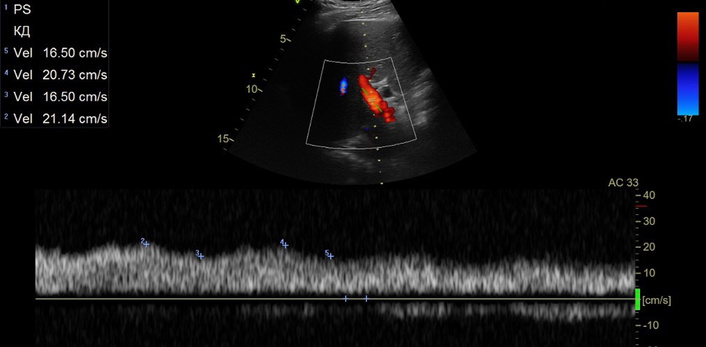
Typically, hepatic venous flow resembles a central venous pressure waveform and consists of three waves: a small retrograde A wave followed by antegrade S and D waves. The S wave amplitude decreases with worsening of venous congestion and may eventually become retrograde, reflecting reversal of flow direction. The next step was evaluation of the portal vein pulsatility index: values < 30% are considered normal, 30–49% indicate moderate abnormalities, and > 50% reflect severe portal venous congestion (Figure 3).
In the renal veins, continuous flow is considered normal; biphasic flow represents a moderate abnormality, whereas monophasic flow indicates severe congestion. Based on IVC diameter and the number and severity of detected abnormalities, venous congestion was graded as VExUS grade 0 (no congestion), grade 1 (mild), grade 2 (moderate), or grade 3 (severe).
Hydration status was assessed by calculating total body water (TBW) and extracellular water (ECW) using the ABC-01 bioimpedance analyzer for metabolic processes and body composition (MEDASS Research and Technology Center LLC, Russia). BIVA is a method based on a comprehensive assessment of anthropometric parameters and the electrical impedance components of a body segment, including resistance (R) and reactance (Xc). Measurements were obtained using a tetrapolar electrode configuration with disposable electrocardiographic electrodes (Fiab, Italy) placed on the patient’s limbs according to the protocol. The analysis included assessment of TBW (kg, %), ECW (kg, %), edema index, reactance measured at 50 kHz (ohm), resistance measured at 50 kHz (ohm), and phase angle (degrees).
Statistical analysis was performed using StatTech v.4.12.2. Quantitative variables were assessed for normality using the Kolmogorov-Smirnov test. Quantitative variables following a normal distribution were described using mean (M) and standard deviation (SD). Quantitative variables that are not normally distributed were described using median (Me) and lower and upper quartiles (Q1–Q3). Categorical data were described with absolute and relative frequencies. Normally distributed continuous variables were compared using one-way ANOVA. Non-normally distributed variables were compared using the Kruskal-Wallis test. The comparison of frequencies in the analysis of 2 by 2 contingency tables was performed using Fisher’s exact test when the minimum expected frequency was less than 10. As a measure of the effect size when comparing groups regarding binary variables. the odds ratio (OR) with a 95% confidence interval (95% CI) was calculated. Differences were considered statistically significant at p < 0.05.
A total of 235 patients hospitalized with a diagnosis of AHFpEF were included in this study. The median age was 77.0 years (IQR 72.0–85.0). and 177 (75.3%) were women. The clinical and demographic characteristics of the study population are summarized in Table 1. The majority of patients had arterial hypertension (99.1%), 57.9% had coronary artery disease, 54.0% had atrial fibrillation, and 40.4% had type 2 diabetes mellitus. Acute kidney injury was observed in 14.5% of patients. The median body mass index (BMI) was 30.5 kg/m2 (IQR 26.8–35.8). The median waist circumference was 102.0 cm (IQR 90.0–116.0).
Baseline clinical and demographic characteristics of the study population (n = 235).
| Variable | Value |
|---|---|
| Demographics | |
| Female sex, n (%) | 177 (75.3) |
| Age, years | 77.0 (72.0–85.0) |
| BMI, kg/m2 | 30.5 (26.8–35.8) |
| Waist circumference, cm | 102.0 (90.0–116.0) |
| Comorbidities, n (%) | |
| Arterial hypertension | 233 (99.1) |
| Coronary artery disease | 136 (57.9) |
| Atrial fibrillation | 127 (54.0) |
| Type 2 diabetes mellitus | 95 (40.4) |
| Acute kidney injury | 34 (14.5) |
| Clinical signs of congestion, n (%) | |
| Orthopnea | 149 (63.4) |
| Jugular venous distension | 149 (63.4) |
| Lower extremity edema | 163 (69.4) |
| Hepatomegaly | 30 (12.8) |
| Pulmonary crackles | 231 (98.3) |
| Pleural effusion | 105 (44.7) |
| Ascites | 35 (14.9) |
Data are presented as median (interquartile range) or n (%). BMI: body mass index.
Signs of congestion were highly prevalent: orthopnea and jugular venous distension were observed in 63.4% of patients, lower limb edema in 69.4%, pleural effusion in 44.7%, and ascites in 14.9%. Pulmonary crackles were present in 98.3% of cases.
Baseline imaging and bioimpedance characteristics are presented in Table 2. LV systolic function was preserved in the overall cohort, with a median LV ejection fraction of 56.0% (IQR 53.0–59.0). However, markers of elevated filling pressures were prominent: the mean E/e’ ratio was 14.1 ± 2.6, and the median left atrial volume index (LAVI) was 43.0 mL/m2 (IQR 39.0–48.0), indicating significant atrial remodeling. Tricuspid regurgitation velocity was increased [2.9 m/s (2.7–3.1)].
Echocardiographic, ultrasound, and bioimpedance parameters at admission (n = 235).
| Variable | Value |
|---|---|
| Echocardiographic parameters | |
| LV ejection fraction, % | 56.0 (53.0–59.0) |
| E/e’ ratio | 14.1 ± 2.6 |
| LAVI, mL/m2 | 43.0 (39.0–48.0) |
| Relative wall thickness | 0.56 (0.51–0.60) |
| LV mass index, g/m2 | 112.5 (101.8–125.3) |
| Tricuspid regurgitation velocity, m/s | 2.9 (2.7–3.1) |
| Laboratory parameters | |
| NT-proBNP, pg/mL | 2,498.0 (1,139.5–5,155.0) |
| Serum creatinine, µmol/L | 103.4 (81.5–137.9) |
| eGFR (CKD-EPI), mL/min/1.73 m2 | 55.4 ± 20.5 |
| Bioimpedance analysis | |
| TBW, kg | 38.2 (33.2–44.4) |
| TBW, % of reference | 117.0 (104.0–130.0) |
| ECW, kg | 15.6 (13.5–18.9) |
| ECW, % of reference | 118.0 (105.0–136.0) |
| Edema index | 0.41 (0.39–0.42) |
| Phase angle (50 kHz), degrees | 5.1 (4.5–5.8) |
| Resistance measured at 50 kHz, ohms | 500.8 ± 135.7 |
| Reactance measured at 50 kHz, ohms | 46.5 ± 19.0 |
| Ultrasound markers of congestion | |
| B-lines per lung zone | 5.0 (4.0–6.0) |
| IVC diameter, mm | 22.0 (20.0–24.0) |
| IVC collapsibility > 50%, n (%) | 122 (51.9) |
| VExUS grade 0, n (%)VExUS grade 1, n (%)VExUS grade 2, n (%)VExUS grade 3, n (%) | 29 (12.3)63 (26.8)83 (35.3)60 (25.5) |
Data are presented as median (interquartile range) or n (%). ECW: extracellular water; eGFR: estimated glomerular filtration rate; IVC: inferior vena cava; LAVI: left atrial volume index; LV: left ventricular; TBW: total body water; VExUS: venous excess ultrasound score.
Renal dysfunction was common, with a median serum creatinine of 103.4 µmol/L and a mean estimated glomerular filtration rate (eGFR) of 55.4 ± 20.5 mL/min/1.73 m2. NT-proBNP levels were markedly elevated (median 2,498.0 pg/mL), reflecting substantial hemodynamic stress.
BIVA revealed objective evidence of systemic fluid overload. TBW and ECW exceeded reference values in the majority of patients, with a median edema index of 0.41 and reduced phase angle values, consistent with fluid redistribution and impaired cellular integrity.
Ultrasound markers of congestion confirmed a high burden of both pulmonary and systemic venous congestion. The median number of B-lines per lung zone was 5.0 (IQR 4.0–6.0). IVC diameter was enlarged [22.0 mm (20.0–24.0)], and more than half of patients demonstrated reduced collapsibility. Moderate-to-severe systemic venous congestion (VExUS grade 2–3) was present in 60.8% of the cohort.
To further explore the heterogeneity of congestion patterns, the study population was stratified according to an integrated ultrasound-based congestion phenotyping approach combining pulmonary and systemic venous ultrasound markers.
Patients were categorized into three phenotypes based on the presence of pulmonary congestion (B-lines > 3 per lung zone) and systemic venous congestion assessed by VExUS (Figure 4):
low-low phenotype (absence of significant pulmonary and systemic congestion).
pulmonary-dominant phenotype (isolated pulmonary congestion).
mixed severe phenotype (combined pulmonary and systemic venous congestion).
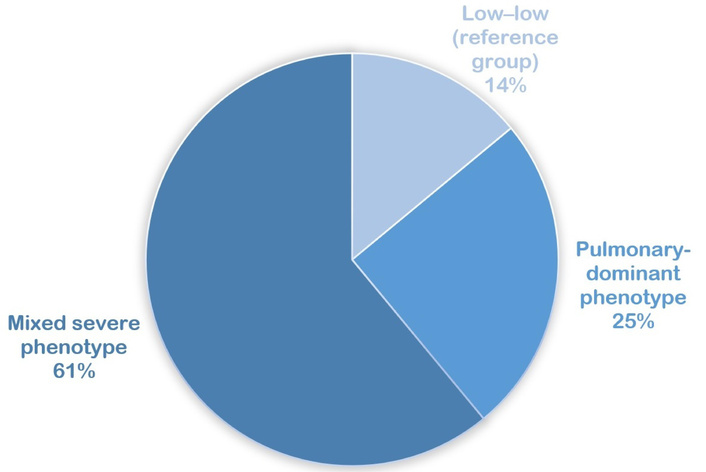
Phenotypes based on the presence of pulmonary congestion and systemic venous congestion assessed by venous excess ultrasound score (VExUS).
This classification aimed to reflect distinct pathophysiological patterns of volume redistribution and hemodynamic burden in AHFpEF.
There were no significant differences in age or sex distribution across phenotypes (Table 3). However, the mixed severe phenotype was characterized by a significantly higher BMI and waist circumference (both p < 0.001), suggesting a closer association with central obesity.
Clinical, echocardiographic, and congestion characteristics across ultrasound-derived congestion phenotypes.
| Parameters | Low-low (reference group) (n = 33) | Pulmonary-dominant phenotype (n = 59) | Mixed severe phenotype (n = 143) | р |
|---|---|---|---|---|
| Demographics | ||||
| Female sex, n (%) | 21 (63.6) | 47 (79.7) | 109 (76.2) | 0.214 |
| Age, years | 77.0 (70.0–84.0) | 78.0 (74.0–86.0) | 77.0 (71.0–84.0) | 0.218 |
| BMI, kg/m2 | 27.2 (24.2–29.8) | 27.5 (24.6–29.8) | 32.9 (29.3–37.8) | < 0.001 |
| Waist circumference, cm | 96.0 (89.0–110.0) | 88.0 (82.0–98.0) | 109.0 (98.0–122.0) | < 0.001 |
| Comorbidities, n (%) | ||||
| Arterial hypertension | 33 (100.0) | 58 (98.3) | 143 (100.0) | 0.226 |
| Coronary artery disease | 16 (48.5) | 32 (54.2) | 88 (61.5) | 0.312 |
| Atrial fibrillation | 11 (33.3) | 28 (47.5) | 88 (61.5) | 0.006 |
| Type 2 diabetes mellitus | 6 (18.2) | 14 (23.7) | 75 (52.4) | < 0.001 |
| Acute kidney injury | 3 (9.1) | 4 (6.8) | 27 (18.9) | 0.061 |
| Medication, n (%) | ||||
| Anticoagulants | 12 (36.4) | 18 (30.5) | 77 (53.8) | 0.005 |
| Beta-blockers | 15 (45.5) | 27 (45.8) | 80 (55.9) | 0.305 |
| Diuretics | 8 (24.2) | 14 (23.7) | 79 (55.2) | < 0.001 |
| MRAs | 0 (0.0) | 5 (8.5) | 28 (19.6) | 0.005 |
| RAAS blockers | 30 (90.9) | 46 (78.0) | 121 (84.6) | 0.249 |
| SGLT2 inhibitors | 1 (3.0) | 2 (3.4) | 15 (10.5) | 0.132 |
| Clinical signs of congestion, n (%) | ||||
| Orthopnea | 7 (21.2) | 26 (44.1) | 116 (81.1) | < 0.001 |
| Jugular venous distension | 6 (18.2) | 18 (30.5) | 125 (87.4) | < 0.001 |
| Lower extremity edema | 15 (45.5) | 20 (33.9) | 128 (89.5) | < 0.001 |
| Hepatomegaly | 1 (3.0) | 0 (0.0) | 29 (20.3) | < 0.001 |
| Pulmonary crackles | 31 (93.9) | 58 (98.3) | 142 (99.3) | 0.100 |
| Pleural effusion | 3 (9.1) | 8 (13.6) | 94 (65.7) | < 0.001 |
| Ascites | 0 (0.0) | 0 (0.0) | 35 (24.5) | < 0.001 |
| Echocardiographic parameters | ||||
| LV ejection fraction, % | 59.0 (55.0–61.0) | 56.0 (55.0–58.5) | 55.0 (52.0–58.0) | < 0.001 |
| E/e’ ratio | 11.91 ± 1.52 | 12.28 ± 2.33 | 14.92 ± 2.38 | < 0.001 |
| Е/А ratio | 0.83 (0.67–0.87) | 0.76 (0.68–0.84) | 1.04 (0.85–1.21) | < 0.001 |
| LAVI, mL/m2 | 39.0 (34.0–42.0) | 41.0 (38.0–45.5) | 45.0 (40.0–49.0) | < 0.001 |
| Relative wall thickness | 0.53 (0.48–0.59) | 0.56 (0.52–0.60) | 0.56 (0.52–0.60) | 0.201 |
| LV mass index, g/m2 | 105.0 (98.0–111.0) | 112.0 (104.0–125.0) | 115.5 (102.0–129.3) | 0.010 |
| Tricuspid regurgitation velocity, m/s | 2.7 (2.6–2.7) | 2.8 (2.7–2.9) | 3.0 (2.9–3.2) | < 0.001 |
| RV dilation, n (%) | 4 (12.1) | 5 (8.5) | 54 (37.8) | < 0.001 |
| TAPSE, mm | 20.0 (19.0–21.0) | 19.0 (19.0–20.0) | 18.0 (16.0–20.0) | < 0.001 |
| RV S’, cm/s | 11.0 (10.5–12.0) | 11.0 (10.0–11.5) | 10.0 (9.0–11.0) | < 0.001 |
| FAC RV, % | 41.0 (39.0–43.0) | 41.0 (38.0–42.0) | 38.0 (31.5–41.5) | < 0.001 |
Values are presented as mean ± standard deviation for normally distributed variables (compared with one-way ANOVA) and as median (interquartile range) for non-normally distributed variables (compared with Kruskal-Wallis test). Categorical variables are presented as n (%) and were compared using the Chi-square test or Fisher’s exact test. Post-hoc comparisons were conducted using Tukey’s test or Dunn’s test with Holm correction, p values represent overall comparisons across the three phenotypes. BMI: body mass index; LAVI: left atrial volume index; LV: left ventricular; RAAS: renin-angiotensin-aldosterone system; RV: right ventricular.
The prevalence of atrial fibrillation increased progressively across phenotypes (33.3% in low-low vs. 61.5% in mixed severe, p = 0.006). Similarly, type 2 diabetes mellitus was markedly more common in the mixed severe group (52.4%, p < 0.001). Acute kidney injury tended to be more frequent in the mixed severe phenotype, although the difference did not reach statistical significance (p = 0.061).
Patients with the mixed severe phenotype more frequently received diuretics (55.2% vs. 24.2% and 23.7%; p < 0.001), anticoagulants (53.8% vs. 36.4% and 30.5%; p = 0.005), and MRAs (19.6% vs. 0.0% and 8.5%; p = 0.005) compared with the low-low and pulmonary-dominant groups. No significant differences were observed for beta-blockers, renin-angiotensin-aldosterone system blockers, or SGLT2 inhibitors.
Markers of systemic congestion demonstrated a clear gradient across phenotypes. Orthopnea, jugular venous distension, lower extremity edema, hepatomegaly, pleural effusion, and ascites were significantly more prevalent in the mixed severe phenotype (all p < 0.001). In contrast, pulmonary crackles were highly prevalent in all groups without significant differences.
These findings indicate a progressively increasing burden of both pulmonary and systemic congestion from the low-low to the mixed severe phenotype.
LV systolic function remained preserved across all phenotypes; however, significant structural and functional differences were observed. Patients with the mixed severe phenotype had higher E/e’ values (14.92 ± 2.38 vs. 11.91 ± 1.52 in the low-low group; p < 0.001) and a higher E/A ratio (1.04 (0.85–1.21) vs. 0.83 (0.67–0.87); p < 0.001), indicating more advanced diastolic dysfunction. LAVI progressively increased from 39.0 (34.0–42.0) mL/m2 in the low-low group to 45.0 (40.0–49.0) mL/m2 in the mixed severe phenotype (p < 0.001), while LV mass index was also higher [115.5 (102.0–129.3) vs. 105.0 (98.0–111.0) g/m2; p = 0.010]. Relative wall thickness did not differ significantly.
Markers of pulmonary hypertension and right ventricular (RV) involvement showed a clear gradient. Tricuspid regurgitation velocity was higher in the mixed severe phenotype [3.0 (2.9–3.2) vs. 2.7 (2.6–2.7) m/s; p < 0.001], accompanied by a greater prevalence of RV dilation (37.8% vs. 12.1%; p < 0.001) and lower indices of RV systolic function, including TAPSE [18.0 (16.0–20.0) vs. 20.0 (19.0–21.0) mm; p < 0.001]. RV S′ [10.0 (9.0–11.0) vs. 11.0 (10.5–12.0) cm/s; p < 0.001], and FAC [38.0% (31.5–41.5) vs. 41.0% (39.0–43.0); p < 0.001].
NT-proBNP levels rose stepwise from 1,197.0 (752.0–2,473.0) pg/mL in the low-low group to 3,072.5 (1,389.5–5,961.8) pg/mL in the mixed severe phenotype (p < 0.001) (Table 4). Serum creatinine was higher in the mixed severe group [116.1 (89.6–155.6) µmol/L vs. 91.3 (79.2–117.4) µmol/L; p < 0.001], while eGFR was lower (52.56 ± 20.76 vs. 63.07 ± 18.41 mL/min/1.73 m2; p = 0.032), indicating more pronounced renal impairment.
Laboratory and bioimpedance characteristics across ultrasound-derived congestion phenotypes.
| Parameters | Low-low (reference group) (n = 33) | Pulmonary-dominant phenotype (n = 59) | Mixed severe phenotype (n = 143) | р |
|---|---|---|---|---|
| Laboratory parameters | ||||
| NT-proBNP, pg/mL | 1,197.0 (752.0–2,473.0) | 1,979.0 (901.9–4,459.5) | 3,072.5 (1,389.5–5,961.8) | < 0.001 |
| Serum creatinine, µmol/L | 91.3 (79.2–117.4) | 92.9 (77.4–117.7) | 116.1 (89.6–155.6) | < 0.001 |
| eGFR (CKD-EPI), mL/min/1.73 m2 | 63.07 ± 18.41 | 57.16 ± 20.12 | 52.56 ± 20.76 | 0.032 |
| Bioimpedance analysis | ||||
| TBW, kg | 34.3 (31.0–39.0) | 33.2 (30.3–37.0) | 40.2 (36.3–49.7) | < 0.001 |
| TBW, % of reference | 102.0 (95.0–115.0) | 103.0 (97.5–111.0) | 125.0 (115.0–139.0) | < 0.001 |
| ECW, kg | 13.8 (12.3–15.5) | 13.5 (12.0–14.7) | 17.1 (15.2–21.1) | < 0.001 |
| ECW, % of reference | 101.0 (91.0–112.0) | 101.0 (94.0–111.5) | 129.0 (117.0–153.0) | < 0.001 |
| Edema index | 0.40 (0.38–0.40) | 0.40 (0.38–0.41) | 0.42 (0.40–0.43) | < 0.001 |
| Phase angle (50 kHz), degrees | 5.5 (4.8–6.6) | 5.5 (4.9–6.1) | 4.9 (4.1–5.7) | < 0.001 |
| Resistance measured at 50 kHz, ohms | 673.00 ± 133.85 | 673.63 ± 104.83 | 486.00 ± 126.69 | < 0.001 |
| Reactance measured at 50 kHz, ohms | 57.0 (51.0–65.0) | 57.0 (47.5–67.5) | 37.0 (28.0–49.0) | < 0.001 |
Values are presented as mean ± standard deviation for normally distributed variables (compared with one-way ANOVA) and as median (interquartile range) for non-normally distributed variables (compared with Kruskal-Wallis test). Categorical variables are presented as n (%) and were compared using the Chi-square test or Fisher’s exact test. Post-hoc comparisons were conducted using Tukey’s test or Dunn’s test with Holm correction, p values represent overall comparisons across the three phenotypes. ECW: extracellular water; eGFR: estimated glomerular filtration rate; TBW: total body water.
BIVA revealed a marked gradient of systemic fluid overload. TBW and ECW were substantially higher in the mixed severe phenotype, both in absolute values [ECW 17.1 (15.2–21.1) vs. 13.8 (12.3–15.5) kg; p < 0.001] and as a percentage of reference values [129.0% (117.0–153.0) vs. 101.0% (91.0–112.0); p < 0.001]. The edema index was also increased [0.42 (0.40–0.43) vs. 0.40 (0.38–0.40); p < 0.001], while phase angle was lower [4.9 (4.1–5.7) vs. 5.5 (4.8–6.6); p < 0.001], consistent with greater extracellular fluid expansion and impaired tissue integrity. Electrical resistance values decreased markedly in the mixed severe phenotype, in line with increased tissue hydration.
Management strategies and treatment response differed significantly across congestion phenotypes. The initial dose of furosemide was highest in patients with the mixed severe phenotype [120.0 (80.0–180.0) mg/day], whereas patients in the low-low (reference group) and pulmonary-dominant phenotypes received substantially lower doses [40.0 (40.0–80.0) mg/day].
A similar pattern was observed for the duration of diuretic therapy, which was longest in the mixed severe phenotype (5.0 days), compared with 3.0 days in both the low-low and pulmonary-dominant groups (p < 0.001 for all comparisons).
In-hospital mortality differed across phenotypes. Death occurred in 1 patient (3.0%) in the low-low group, in 1 patient (1.7%) in the pulmonary-dominant phenotype, and in 16 patients (11.2%) in the mixed severe phenotype (p = 0.039). Thus, the highest short-term mortality was observed in patients with combined pulmonary and systemic venous congestion.
In unadjusted analysis, the mixed severe phenotype was associated with increased odds of in-hospital mortality (OR 5.67, 95% CI 1.27–25.28, p = 0.023) (Figure 5). After adjustment for age, renal function, and NT-proBNP levels, the association was attenuated (adjusted OR 3.53, 95% CI 0.73–16.99, p = 0.115), suggesting that part of the excess risk may be mediated through greater hemodynamic stress and renal impairment in this subgroup.
Ultrasound-derived congestion phenotypes and in-hospital mortality. 95% CI: 95% confidence interval; ECW: extracellular water; HFpEF: heart failure with preserved ejection fraction; LAVI: left atrial volume index; OR: odds ratio; RV: right ventricular; VExUS: venous excess ultrasound score.
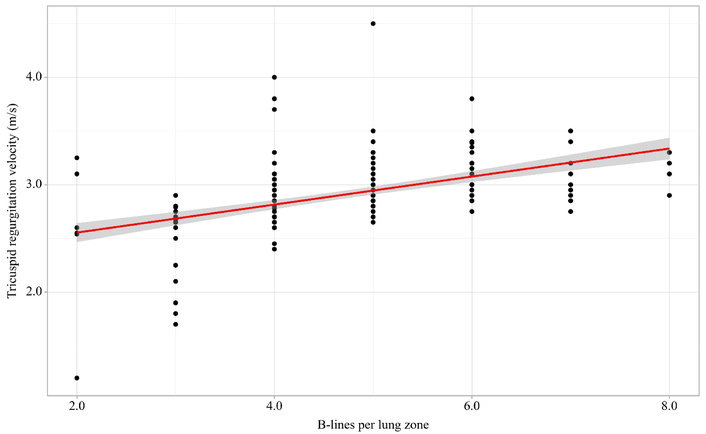
The number of B-lines per lung zone was significantly associated with echocardiographic markers of elevated LV filling pressures and pulmonary vascular involvement. A moderate-to-strong positive correlation was observed between B-lines and tricuspid regurgitation velocity (r = 0.60, p < 0.001) (Figure 6). B-lines were also moderately correlated with the E/e’ ratio (r = 0.50, p < 0.001), supporting their association with increased LV filling pressures in АHFpEF.
In addition, В-lines demonstrated a significant positive correlation with LAVI (r = 0.40. p < 0.001). suggesting a relationship between pulmonary congestion and more advanced atrial remodeling, NT-proBNP levels showed a weaker but still significant correlation with B-lines (r = 0.30, p < 0.001), reflecting the link between ultrasound-derived pulmonary congestion and biochemical markers of hemodynamic stress.
Beyond echocardiographic parameters, B-lines were also related to objective measures of systemic fluid overload assessed by bioimpedance. ECW percentage demonstrated a moderate positive correlation (r = 0.50, p < 0.001), while reactance measured at 50 kHz showed a corresponding inverse relationship (r = −0.50, p < 0.001), consistent with the expected biophysical effect of increased tissue hydration.
The primary finding of this study is that a multimodal ultrasound approach that integrates LUS and VExUS score offers a nuanced characterization of congestion in patients with AHFpEF. The study population exhibited classic clinical manifestations of congestion, with nearly all patients presenting with pulmonary crackles (98.3%) and over half demonstrating orthopnea, jugular venous distension, and lower extremity edema. But physical examination findings alone often correlate poorly with the true severity of hemodynamic load, which highlights the importance of a differentiated approach to assessing the severity of congestion [9]. To our knowledge, this is the first study to integrate LUS and VExUS into a simple bedside-derived phenotypic classification (low-low, pulmonary-dominant, and mixed severe) specifically in an AHFpEF cohort. While the prognostic value of VExUS and B-lines has been established individually in mixed HF populations, this analysis provides novel evidence that the combination of these modalities unmasks distinct gradients of left atrial remodeling and RV dysfunction that are not apparent when using clinical signs or biomarkers alone. Furthermore, we demonstrate for the first time a strong correlation between the ultrasound-derived mixed severe phenotype and objective bioimpedance markers of ECW excess in HFpEF.
The use of ultrasound modalities to evaluate congestion has gained significant traction over the last few decades. In addition to routine transthoracic echocardiography, the current investigation used the VExUS protocol and ultrasound assessment of B-lines. Our results demonstrate that systemic venous congestion, categorized as VExUS grade 2 or 3, was present in a substantial 59.5% of patients at admission, highlighting a high burden of splanchnic and peripheral congestion that may be overlooked by conventional physical examination alone. The correlation analysis further validates the clinical utility of ultrasound markers. The moderate-to-strong positive correlation between B-lines number and tricuspid regurgitation velocity (r = 0.60) and E/e’ (r = 0.50) reinforces the role of LUS as a reliable proxy for elevated LV filling pressures. Furthermore, the integration of BIVA provides objective confirmation of the fluid overload patterns identified by ultrasound. In our study, a significant positive correlation was observed between the B-line count and ECW (r = 0.50, p < 0.001), while an inverse relationship was found with the reactance values (r = –0.50, p < 0.001). These findings suggest that multimodal ultrasound not only reflects hemodynamic pressures but also accurately captures the degree of peripheral and interstitial tissue hydration. According to the literature, bioelectrical impedance analysis parameters correlate reasonably with neurohormonal markers, imaging markers (including computed tomography), invasive hemodynamic parameters, and echocardiographic estimates of filling and venous pressures [10].
In our study, the categorization of patients into three congestion phenotypes revealed significant pathophysiological differences. Importantly, the identified congestion phenotypes were closely associated with distinct patterns of cardiac structural and functional remodeling. Patients with the mixed severe phenotype demonstrated more pronounced left atrial enlargement and elevated filling pressures, reflecting advanced diastolic dysfunction. This structural and functional impairment of the left atrium is central to the pathophysiology of HFpEF. In a recent study by Shirokov et al. [11], left atrial compliance (derived from the ratio of reservoir strain to E/e’) demonstrated a high diagnostic accuracy for HFpEF, outperforming traditional markers such as NT-proBNP and the HFA-PEFF score. Their findings underscore the importance of left atrial myopathy as a key determinant of elevated filling pressures, which aligns with the more severe congestion phenotype observed in our cohort. In parallel, this group exhibited clear signs of RV involvement, including reduced systolic function and increased pulmonary pressures. These findings suggest that multimodal ultrasound-derived congestion patterns are not only markers of volume overload but also reflect underlying alterations in atrial and ventricular function, providing additional insight into the pathophysiological complexity of HFpEF.
The “mixed severe” phenotype was strongly associated with central obesity, as evidenced by significantly higher BMI and waist circumference, and a higher prevalence of type 2 diabetes mellitus. This supports the hypothesis that a specific “obese-HfpEF” phenotype exists, characterized by more pronounced systemic inflammation and greater volume overload [12]. Notably, metabolic disturbances in HFpEF extend beyond obesity; recent data indicate that low LDL cholesterol levels may serve as a marker of disease compensation, being associated with the absence of dyspnea in chronic HF patients receiving disease-modifying therapy [13]. Furthermore, this group exhibited more advanced diastolic dysfunction (higher E/e’ and LAVI) and more significant RV impairment, including lower TAPSE and FAC values, compared to the low-low and pulmonary-dominant phenotypes. These findings suggest that systemic congestion in HFpEF is intimately linked to the progression of right-sided HF and secondary pulmonary hypertension. In a broader cohort of patients with chronic HF, the presence of pleural effusion (a key component of the mixed severe phenotype) and reduced LV ejection fraction have been independently associated with increased long-term mortality, further underscoring the prognostic weight of such combined congestion patterns [14]. The stepwise increase in NT-proBNP levels across phenotypes further validates the integrated ultrasound approach as a mirror of hemodynamic stress.
The strong association between the mixed severe congestion phenotype and anthropometric indices of central obesity (BMI and waist circumference) observed in our cohort merits particular pathophysiological consideration. This finding aligns with the well-established concept of an “obesity-related HFpEF phenotype”, which is driven by mechanisms extending far beyond simple mechanical compression. While increased intra-abdominal pressure and pericardial restraint from visceral adiposity certainly impair venous return and elevate biventricular filling pressures, the link between obesity and aggravated congestion in HFpEF is predominantly systemic and metabolic. A recent systematic review highlights that adipose tissue dysfunction in this setting leads to a cascade of systemic inflammation, microvascular endothelial activation, and impaired nitric oxide-cyclic guanosine monophosphate (NO-cGMP) signaling, which collectively increase arterial stiffness and ventricular-vascular stiffening [15].
Furthermore, the convergence of abdominal obesity with cardiorenal and hepatic interactions amplifies the burden of volume overload observed in the mixed severe phenotype. The relationship between visceral adiposity and intra-abdominal venous congestion creates a feedback loop wherein elevated central venous pressure is transmitted retrogradely to the splanchnic and renal beds. This is further complicated by the high prevalence of metabolic dysfunction-associated steatotic liver disease (MASLD) in this population. Some authors describes the intricate cross-talk between MASLD and HFpEF, wherein hepatic inflammation and sinusoidal fibrosis exacerbate portal hypertension, directly contributing to the abnormal portal vein pulsatility and hepatic vein Doppler patterns quantified by the VExUS score [16]. This splanchnic congestion, in turn, promotes renal sodium avidity and diuretic resistance. Supporting this mechanism, recent data demonstrate that in HFpEF patients, higher baseline BMI and abdominal obesity are independently associated with a steeper decline in eGFR, underscoring the direct nephrotoxic interplay of adiposity and venous congestion [17].
Finally, the clinical consequence of this confluence is profound exercise intolerance and functional decline, a hallmark of the mixed severe phenotype. The obesity in HFpEF is a clinical nexus for reduced oxygen extraction and impaired peripheral muscle metabolism, which synergizes with pulmonary and systemic congestion to create the severe symptom burden we observed in this subgroup [18]. Therefore, the mixed severe phenotype should not be viewed merely as “wetter” HFpEF, but as a distinct cardio-metabolic-inflammatory state driven predominantly by visceral adiposity. This recognition underscores the potential therapeutic value of targeting adipose tissue inflammation and promoting weight loss, in addition to standard decongestive therapies, to effectively manage this high-risk population.
In recent years, several attempts have been made to describe the phenotypes of chronic and AHFpEF. However, a consistent classification remains elusive due to the high heterogeneity of this population. Proposed phenotyping strategies often rely on triggering causes of decompensation, comorbidities, and clinical characteristics. For instance, Sotomi et al. [19] used cluster analysis to identify four AHFpEF phenotypes, which were primarily differentiated by decompensation triggers and laboratory markers rather than the localization or severity of congestion. Specifically, the poorest prognosis was observed in patients with a history of prior HF hospitalizations, elevated total bilirubin. and lower blood pressure and heart rate at admission.
The ultrasound phenotype in this study served as a powerful indicator of short-term prognosis. Patients in the “mixed severe” group experienced significantly higher in-hospital mortality (11.2%) compared to those with isolated pulmonary or minimal congestion. Our findings align with recent evidence, such as the prospective JASE study (n = 290), where a VExUS score of 3 was associated with an eight-fold increase in the odds of in-hospital mortality (OR 8.03; 95% CI 2.25–28.61) [20]. A study of 162 AHF patients demonstrated that B-lines at discharge are a powerful predictor of 6-month death/HF readmission (AUC 0.83) with prognostic performance similar in HFpEF and HF with reduced ejection fraction [21]. Moreover, B-lines tracked with BNP and pulmonary pressures in both phenotypes. Similarly, in our cohort, the “mixed severe” phenotype was associated with significantly higher odds of in-hospital death (OR 5.67; 95% CI 1.27–25.28). Although the association was attenuated after adjusting for age, renal function, and NT-proBNP, the unadjusted OR highlights the profound risk carried by patients with combined pulmonary and systemic congestion.
Beyond the volume-overload phenotypes identified in our study, HFpEF encompasses a broader hemodynamic spectrum that warrants recognition. Notably, the “supra-normal” ejection fraction phenotype (HFsnEF; LVEF ≥ 65%), recently characterized in elderly cohorts by Sonaglioni et al. [22], represents a distinct pathophysiological entity. In contrast to the “mixed severe” congestion phenotype described herein, the HFsnEF phenotype is associated with a “cold and dry” hemodynamic profile, often presenting with smaller LV cavities, paradoxical hypercontractility, and a higher burden of non-cardiac comorbidities, frailty, and sepsis. This phenotype portends adverse outcomes independent of overt congestion, likely reflecting systemic inflammation and microvascular dysfunction rather than elevated venous pressures. The absence of such patients in our cohort is explained by our inclusion criteria mandating clinical signs of decompensation and elevated NT-proBNP, positioning our ultrasound-based congestion phenotyping (VExUS and B-lines) as a robust risk stratification tool primarily for “wet” HFpEF phenotypes. Future studies should explore whether combining congestion scores with markers of inflammation and ventricular-arterial coupling could unify these divergent HFpEF subtypes into a more comprehensive prognostic framework.
The identification of the ‘mixed severe’ phenotype via bedside ultrasound has direct therapeutic consequences. In clinical practice, patients presenting with both pulmonary B-lines and a VExUS grade ≥ 2 exhibit systemic venous congestion resistant to isolated vasodilator therapy. For this cohort, our findings support an early shift towards aggressive decongestive strategies, including higher doses of loop diuretics or early combination diuretic therapy (e.g., thiazide-like agents or acetazolamide), alongside stricter fluid restriction and sodium management. Conversely, patients with the ‘pulmonary-dominant’ phenotype (B-lines with VExUS 0–1) may benefit more from afterload reduction and non-invasive ventilation rather than aggressive diuresis, thereby potentially avoiding intravascular depletion and acute kidney injury. Implementation of this integrated ultrasound approach allows for a personalized decongestion plan within the first two hours of admission, moving beyond a ‘one-size-fits-all’ diuretic regimen.
Several limitations of the current study must be acknowledged. First, the results may reflect local practice patterns as this study is single-center and ultrasound methods are highly operator-dependent. Second, the diagnostic methods did not include invasive hemodynamic monitoring, such as right heart catheterization, which remains the gold standard for cardiac chamber pressure assessment. Future multi-center studies with longer follow-up periods are required to determine if ultrasound-guided approaches can improve long-term survival and reduce rehospitalization rates in the HFpEF population. Third, ultrasound and bioimpedance assessments were performed only at the time of admission. Consequently, the evolution of pulmonary and systemic venous congestion in response to decongestive therapy during hospitalization could not be evaluated. The absence of discharge ultrasound data prevents assessment of residual congestion, which has been shown to be a strong predictor of early readmission and post-discharge mortality in AHF populations. Future prospective studies incorporating serial assessments at admission, during treatment, and at discharge are warranted to determine whether ultrasound-derived congestion phenotyping can guide the intensity and duration of decongestive therapy.
In conclusion, our study demonstrates that a multimodal ultrasound approach, incorporating LUS and the VExUS protocol, provides a comprehensive framework for characterizing hemodynamic profiles of patients with AHFpEF. We identified distinct congestion phenotypes that are closely associated with differences in cardiac structure and function, particularly involving left atrial remodeling, diastolic dysfunction, and RV impairment.
These findings further contribute to the understanding of the heterogeneity in the HFpEF population and underscore the clinical utility of early, integrated ultrasound assessment in the standard diagnostic workup for AHFpEF. The primary advantages of this integrated congestion evaluation are its high accessibility and reproducibility at the bedside. By enabling more precise baseline risk stratification, the implementation of these ultrasound-based protocols may help identify high-risk patients who warrant closer monitoring during hospitalization and after discharge. Further studies incorporating serial ultrasound assessments are required to determine whether this integrated imaging approach can directly guide personalized decongestive therapy and improve long-term clinical outcomes in this vulnerable patient cohort.
95% CI: 95% confidence interval
AHF: acute heart failure
AHFpEF: acute heart failure with preserved ejection fraction
BIVA: bioimpedance vector analysis
BMI: body mass index
ECW: extracellular water
eGFR: estimated glomerular filtration rate
HF: heart failure
HFpEF: heart failure with preserved ejection fraction
IVC: inferior vena cava
LAVI: left atrial volume index
LUS: lung ultrasound
LV: left ventricular
MASLD: metabolic dysfunction-associated steatotic liver disease
OR: odds ratio
RV: right ventricular
TBW: total body water
VExUS: venous excess ultrasound score
EAR: Software, Validation, Formal analysis, Data curation, Visualization. AAI: Conceptualization, Writing—original draft, Investigation, Writing—review & editing. OND: Conceptualization, Writing—original draft, Methodology, Project administration, Resources, Supervision. ARK: Writing—review & editing, Supervision. OMD: Resources. All authors read and approved the submitted version.
The authors declare that they have no conflicts of interest.
The study was conducted in accordance with the principles of Good Clinical Practice and the Declaration of Helsinki (version 2013). The study protocol was approved by the Local Ethics Committee of the National Medical Research Center for Therapy and Preventive Medicine (approval No. 04-05/23 dated September 18, 2023).
Informed consent to participate in the study was obtained from all participants.
Informed consent to publication was obtained from relevant participants.
The datasets for this manuscript are not publicly available due to ethical restrictions. Requests for accessing the datasets should be directed to Dr Olga N. Dzhioeva, Email: ODzhioeva@gnicpm.ru.
Not applicable.
© The Author(s) 2026.
Open Exploration maintains a neutral stance on jurisdictional claims in published institutional affiliations and maps. All opinions expressed in this article are the personal views of the author(s) and do not represent the stance of the editorial team or the publisher.
Copyright: © The Author(s) 2026. This is an Open Access article licensed under a Creative Commons Attribution 4.0 International License (https://creativecommons.org/licenses/by/4.0/), which permits unrestricted use, sharing, adaptation, distribution and reproduction in any medium or format, for any purpose, even commercially, as long as you give appropriate credit to the original author(s) and the source, provide a link to the Creative Commons license, and indicate if changes were made.

View: 559
Download: 17
Times Cited: 0