Original Article

Affiliation:
1School of Medical and Health Sciences, Tung Wah College, Hong Kong, China
2Department of Pathology, United Christian Hospital, Hong Kong, China
†These authors contributed equally to this work.
ORCID: https://orcid.org/0009-0001-1520-2540
Affiliation:
3School of Computer Science and Engineering, Southeast University, Nanjing 211189, Jiangsu, China
†These authors contributed equally to this work.
ORCID: https://orcid.org/0000-0001-8848-596X
Affiliation:
1School of Medical and Health Sciences, Tung Wah College, Hong Kong, China
Email: fhtang@twc.edu.hk
ORCID: https://orcid.org/0000-0001-6530-7730
Affiliation:
1School of Medical and Health Sciences, Tung Wah College, Hong Kong, China
Affiliation:
1School of Medical and Health Sciences, Tung Wah College, Hong Kong, China
Affiliation:
1School of Medical and Health Sciences, Tung Wah College, Hong Kong, China
Explor Med. 2026;7:1001394 DOI: https://doi.org/10.37349/emed.2026.1001394
Received: September 01, 2025 Accepted: January 27, 2026 Published: March 26, 2026
Academic Editor: Ning Li, Chinese Academy of Medical Sciences and Peking Union Medical College, China
The article belongs to the special issue Artificial Intelligence in Precision Imaging: Innovations Shaping the Future of Clinical Diagnostics
Aim: This study aimed to develop and evaluate a stacking ensemble machine learning (SEML) model that integrates deep learning (DL) algorithms to improve the accuracy of prognostic predictions for patients with head and neck squamous cell carcinoma (HNSCC).
Methods: A cohort of 215 HNSCC patients’ CT images, featuring gross tumor volume (GTV) and planning target volume (PTV) contours, was analyzed. Radiomics features were extracted and converted into quantitative data. These features were then used to train and compare a novel SEML model against standard DL algorithms to predict patient prognosis.
Results: The proposed SEML model demonstrated superior predictive performance compared to the DL model, achieving 93% accuracy, 100% sensitivity, and 83% specificity. Statistical analysis using the chi-square test indicated no substantial difference in prediction performance between features derived from GTV and PTV contours (p > 0.05).
Conclusions: The SEML model effectively enhances the prognostic prediction accuracy for HNSCC based on radiomic features. This approach shows significant potential to inform clinical decision-making and support the development of customized treatment strategies for improved patient care.
Head and neck squamous cell carcinoma (HNSCC) rank as the 6th most common cancer worldwide, with approximately 890,000 new cases and 450,000 deaths each year recently [1]. In Hong Kong, HNSCC incidence has risen up to 16,000 new cases reported each year, mostly due to tobacco use, alcohol consumption, betel quid chewing, and HPV infection [2]. Furthermore, 5-year survival rate for late-stage HNSCC patients is less than 50%, primarily due to tumor recurrence, metastasis, and therapy resistance [3]. Radiotherapy combined with surgery, chemotherapy, or immunotherapy remain as main treatment methods, yet heterogeneous treatment responses demand more comprehensive personalized approaches [4]. In our study, we attempted to refocused the study on oropharyngeal squamous cell carcinoma (OPSCC) as a particular example of HNSCC, acknowledging this specificity as a strength for a homogeneous analysis.
The Tumor, Node, Metastasis (TNM) staging system (AJCC 8th Edition) is the gold standard for HNSCC prognosis, it relates to tumor size (T), lymph node involvement (N), and distant metastasis (M) [5]. However, this system suffers from the following weakness:
Biopsies may promote patient discomfort and risk [6], while it has irreplaceable role in the confirmation of diagnosis.
Time delays in histopathological analysis deter immediate treatment decisions [7].
Difficult to detect tumor heterogeneity, molecular subtypes, or dynamic treatment responses [8].
It appears that, other than biomarkers (e.g., PD-L1, HPV status), non-invasive, AI-enhanced radiomics may offer a promising alternative, yet predictive models, like other AI models, can only augment rather than replace AJCC staging.
Radiomics extracts high-dimensional quantitative features (e.g., texture, shape, wavelet transforms1) from computed tomography (CT), MRI, and PET scans to identify tumour characteristics [9, 10].
The main advantages are:
Prognostic prediction modeling: Correlates imaging features with treatment response, survival, and recurrence [11, 12].
Recent studies have noted that machine learning (ML) algorithms have good performance (Table 1). However, single-model approaches suffer from overfitting and may lack generalizability [16].
Performance of machine learning algorithms.
| Algorithm | Application | Accuracy | Reference |
|---|---|---|---|
| SVM (support vector machine): A supervised learning algorithm that finds the optimal hyperplane to separate data into classes with maximum margin. | Oral SCC classification | 100% | (Kumar et al., 2021) [13] |
| Random forest model with six decision trees and seven splits. | Rectal cancer prognosis | 95.3% | (Shen et al., 2020) [14] |
| Multiregional spatial interaction (MSI) matrix with 22 image features. A network strategy was used to integrate all image features and classify patients into different risk groups. | Breast cancer prediction | 97.8%, to 98.6% | (Wu et al., 2018) [15] |
Ensemble methods combine multiple models to enhance prediction performance:
Despite progress, critical gaps persist, such as:
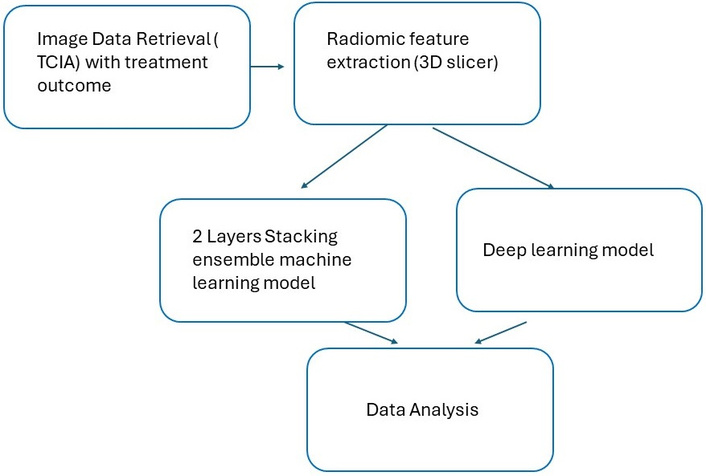
The study followed the following steps (Figure 1):
Performance was evaluated via ROC-AUC, accuracy, sensitivity, and specificity.
Publicly available planning CT images and clinical data from The Cancer Imaging Archive (TCIA) were retrieved, mainly for patients with HNSCC (2003–2013).
Quality control: 164 eligible cases were selected from 215 initial entries after excluding incomplete/inconsistent records.
Image processing: gross tumor volume (GTV) and planning target volume (PTV) structures were segmented using 3D Slicer (version 4.10.2). The images were first processed with filtering (e.g., Laplacian of Gaussian for edge enhancement) or wavelet transforms to highlight texture features.
For GTV, it is the demonstrable extent and location of the malignant tumor, including any macroscopically visible or palpable tumors, masses, or nodal involvement.
PTV is a geometric expansion of the clinical target volume (CTV) that accounts for internal motion (e.g., breathing, organ movement) and setup variability (e.g., patient positioning errors during treatment).
Radiomics features were extracted from the GTV and PTV structures using 3D Slicer (version 4.10.2) with the PyRadiomics extension. The features were categorized into various groups, including shape, first-order statistics, gray-level zone matrix (GLSZM), gray-level dependence matrix (GLDM), gray-level run-length matrix (GLRLM), gray-level co-occurrence matrix (GLCM), and neighborhood gray-tone difference matrix (GLTDM). A total of 107 radiomics features were extracted for analysis.
Stacking ensemble model (SEML) and deep learning (DL) approaches were implemented.
TCIA serves as the data source for the current study. This publicly available repository is operated by the National Cancer Institute (NCI). Planning CT images of patients who received radical radiotherapy for HNSCC during the period from 2003 to 2013, with “HNSCC” labeled dataset was used. The research included GTV and PTV radiotherapy structures and clinical information about patient age, sex, and diagnosis, smoking habits, staging progression, and three- and five-year survival statistics. After quality assessment, finally, 164 valid cases out of the 215 confirmed collections were obtained.
Cancer prognosis is typically assessed based on specific time points, such as the five-year survival rate [23]. This allows for objective comparisons across different cancer studies, as patients who survive five years post-treatment are generally classified as "cancer survivors."
In this study, the five-year survival rate was selected as the treatment outcome to ensure comparability with other studies. Of the 164 cases, 118 patients survived, while 46 did not. An overfitting test was performed by randomly selecting 46 cases from the 117 patients who survived to balance the sample outcomes.
Two ML models were employed:
In this model, the radiomics data were divided into two sets for data splitting: training (70%) and testing (30%). Four classifiers were utilized: decision trees (DT), RF, support vector machine (SVM), and generalized linear model (GLM). The training set was used to train the models, which were then validated with the validation set to generate predictions. Predicted outcomes were quantified numerically, with values of 0 representing survival beyond five years or death from other causes, and 1 indicating death within five years of diagnosis.
The SEML consists of heterogeneous classifiers organized in a two-layer structure. The base classifiers were initially trained with the radiomics data. The meta-learner was trained using the prediction results from the base classifiers, with XGBoost selected as the meta-classifier. The selection of an appropriate meta-classifier is crucial for model performance. Previous studies have indicated that XGBoost is optimal for recurrent HNSCC prognosis [24–26]. The final prediction outcome was the training result of the XGboost. Details of protocol were illustrated in Figure 2.
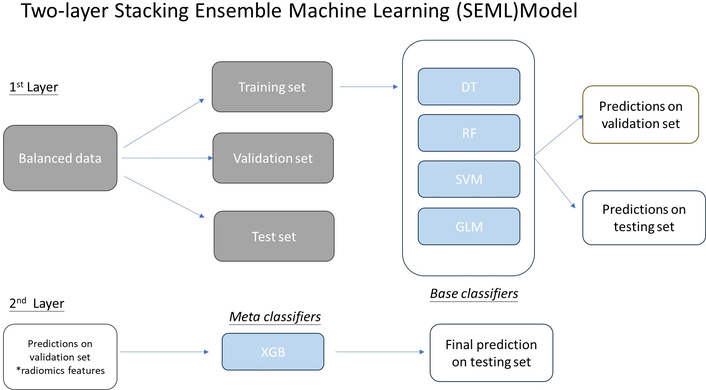
Workflow for the adoption of a stacking ensemble machine learning model. DT: deep learning; RF: random forest; SVM: support vector machine; GLM: generalized linear model.
As the dataset exhibited an unbalanced distribution of outcomes, an overfitting test was conducted using a balanced sample with an equal number of cases for each treatment outcome. The sample with the same number and unequal were conducted to address class imbalance (118 vs. 46), and a balanced subset was created via random undersampling of the majority class. Overfitting was evaluated by comparing performance metrics (AUC, accuracy) and observing the convergence of learning curves (training vs. validation loss) across epochs/folds.
To evaluate the performance of the SEML model against DL-based approaches, a deep neural network (DNN) was implemented and trained using radiomics features. The DL model was structured as a fully connected feed-forward neural network, consisting of three hidden layers designed to capture hierarchical patterns in the data.
The architecture of the DL model was carefully designed to ensure effective learning while avoiding overfitting:
Input layer: The model used 107 radiomics features extracted from medical imaging data, serving as the initial input representation.
Hidden layers: Three fully connected (dense) layers were employed with progressively decreasing units to facilitate feature abstraction and dimensionality reduction:
First hidden layer: 256 neurons
Second hidden layer: 128 neurons
Third hidden layer: 64 neurons
Each of these layers utilized the Rectified Linear Unit (ReLU) activation function, which introduces non-linearity while mitigating the vanishing gradient problem.
Output layer: A single neuron with a sigmoid activation function was used to produce a probabilistic output between “0” and “1”, enabling binary classification (that is, survive and die).
The model was trained using the following optimization and validation strategies:
Optimizer: The “Adam optimizer” was employed with a learning rate of 0.001, chosen for its adaptive momentum properties, which help in efficient convergence.
Batch size: A batch size of 16 was selected to balance computational efficiency and gradient stability.
Epochs: Training was conducted for a maximum of 100 epochs, with an early stopping mechanism (patience = 10) monitoring the validation loss to prevent overfitting. If no improvement was observed for 10 consecutive epochs, training was halted.
Data splitting: The dataset was partitioned into a “70/30 ratio” for training and testing, respectively, ensuring sufficient data for model generalization while retaining an independent test set for unbiased evaluation.
This comparative framework allowed for a systematic assessment of the SEML model's performance relative to traditional DL methods, highlighting its potential advantages in interpretability, computational efficiency, and robustness in medical diagnostics.
The predicted outcomes from the two-layer stacking model were compared with those from the base classifiers. Model performance was evaluated using the receiver operating characteristic (ROC) curve, with metrics including the area under the ROC curve (AUC), accuracy, specificity, sensitivity, and chi-square test, which were calculated using ROCkit from the University of Chicago (1995). SEML and DL models were tested on the same holdout dataset (30%) using Delong test by Matlab calculation.
The dataset comprised 215 patients, of which 51 were excluded due to missing data, resulting in 164 cases for analysis. Both PTV and GTV CT datasets were collected. Demographic details are summarized in Table 2.
Patient demographics, staging, and clinical data.
| Patient and tumour characteristics(All n = 164) | Data |
|---|---|
| Age range (years) (mean ± SD) | 24–9160 ± 13 |
| Female (mean ± SD)Male (mean ± SD) | 55 ± 262 ± 13 |
| Sex | |
| Female | 25 (15%) |
| Male | 139 (85%) |
| Staging | |
| Stage I | 3 |
| Stage II | 3 |
| Stage III | 23 |
| Stage IV | 135 |
| Diagnosis | |
| Ca Base of Tongue | 60 |
| Ca Tonsil | 58 |
| Ca others | 46 |
| Smoking status | |
| Smoker | 54 |
| Non-smoker | 110 |
SEML models using SEML as classifier, consistently outperformed any of the individual ML models in ROC analysis.
Among 4 of the individual ML models using PTV features, SVM attained the best performance in prognostic prediction for HNC. Compared with the SVM model, the SEML model further enhanced the performance in both accuracy from 73.3% to 93.3% (AUC = 0.723 vs. AUC = 0.982) and sensitivity from 66.7% to 100%. The details refer to Table 3.
Performance of each machine learning model and SEML.
| Performance | DL | RF | SVM | GLM | SEML | |
|---|---|---|---|---|---|---|
| AUC | GTV | 0.472 | 0.672 | 0.652 | 0.643 | 0.820 |
| PTV | 0.550 | 0.716 | 0.723 | 0.444 | 0.982 | |
| Accuracy | GTV | 0.467 | 0.733 | 0.467 | 0.667 | 0.733 |
| PTV | 0.400 | 0.600 | 0.733 | 0.400 | 0.933 | |
| Sensitivity | GTV | 0.500 | 0.875 | 0.625 | 0.500 | 0.625 |
| PTV | 0.444 | 0.556 | 0.667 | 0.333 | 1.000 | |
| Specificity | GTV | 0.429 | 0.571 | 0.286 | 0.857 | 0.857 |
| PTV | 0.333 | 0.667 | 0.833 | 0.500 | 0.833 | |
DL: deep learning; RF: random forest; SVM: support vector machine; GLM: Generalized Linear Model; SEML: stacking ensemble machine learning.
The SEML model demonstrated exceptional performance, with AUC ranging from 0.82 to 0.982 across all target volumes. For PTV radiomic features, the AUC reached 0.982. The model exhibited sensitivity of 100%, specificity of 83%, and accuracy of 93%. In contrast, the AUC for GTV features was slightly lower at 0.82, with sensitivity, specificity, and accuracy at 62.5%, 85.7%, and 73.3%, respectively. In comparison, the DL model showed an AUC ranging from 0.605 to 0.774, with accuracy between 0.655 and 0.724, indicating superior performance of the SEML model (Table 4).
A summary of prognosis prediction performance with both PTV and GTV for SEML and DL.
| Performance | SEML | DL | |
|---|---|---|---|
| AUC | GTV | 0.82 | 0.788 |
| PTV | 0.982 | 0.712 | |
| Accuracy | GTV | 0.733 | 0.724 |
| PTV | 0.933 | 0.655 | |
| Sensitivity | GTV | 0.625 | 0.846 |
| PTV | 1 | 0.769 | |
| Specificity | GTV | 0.857 | 0.625 |
| PTV | 0.833 | 0.563 | |
PTV: planning target volume; GTV: gross tumor volume; SEML: stacking ensemble machine learning; DL: deep learning.
Despite the PTV radiomics features yielding better predictions, ROC analysis indicated no significant difference between PTV and GTV features (chi-square test, p > 0.05) (Figure 3).
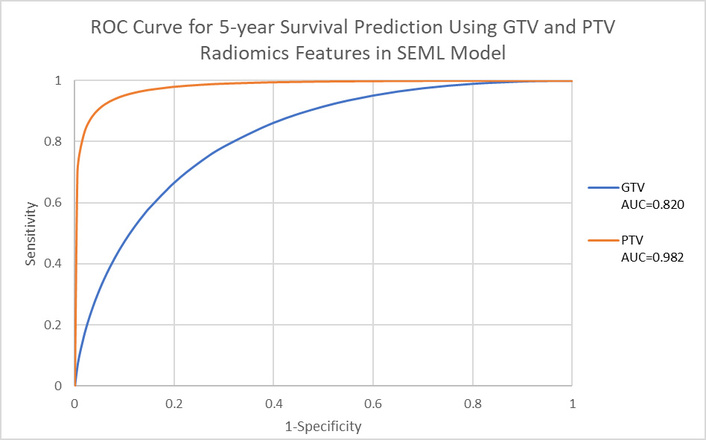
ROC curve of 5-year survival using GTV and PTV radiomics features in the SEML model. GTV: gross tumor volume; PTV: planning target volume; SEML: stacking ensemble machine learning.
The SEML model consistently outperformed the DL model in predicting 5-year survival for HNSCC patients. Sensitivity, specificity, accuracy, and AUC of the SEML model surpassed those of the DL model, although ROC analysis indicated no statistically significant differences between PTV and GTV radiomic features (chi-square test, p > 0.05, Figure 4).
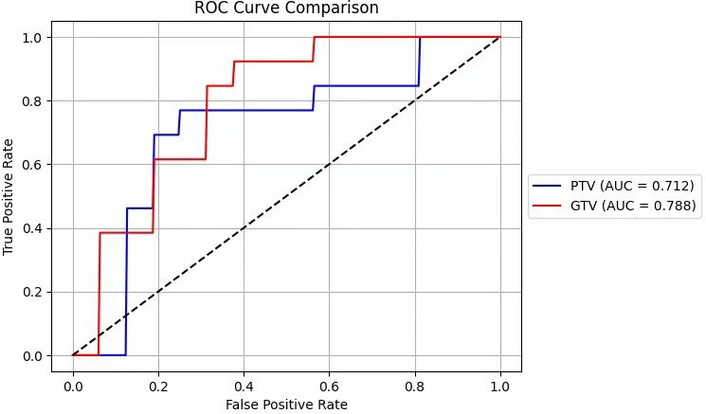
The ROC curve of GTV and PTV using deep learning model. GTV: gross tumor volume; PTV: planning target volume.
A DeLong test for AUCs is conducted to compare the performance of SEML and DL. It was noted that there is no significant difference for GTV, but there is a significant difference for PTV (Table 5).
DeLong’s test for AUCs.
| n = 164 | SEML (AUC) | DL (AUC) | p-value | Any statistical significance? |
|---|---|---|---|---|
| GTV | 0.82 | 0.788 | p = 0.2996 | p > 0.05 |
| PTV | 0.982 | 0.712 | p = 0 | p < 0.001 |
Using radiomics characteristics, this study assesses the performance of the SEML and DL models in predicting five-year survival in patients with HNSCC. Although there was no clear difference between the models, the SEML showed a considerable improvement in prognostic prediction, especially using PTV (P < 0.001 for PTV).
The SEML model employed in this research is the first to quantitatively explore a stacking ensemble approach for enhancing cancer prognosis predictions based on CT radiomics. Prior studies have highlighted the utility of ML in cancer prognosis, with notable successes such as an AUC of 0.61 for head and neck cancer using RF models [27] and a C-index of 0.782 for laryngeal squamous cell carcinoma prognosis [28].
The SEML model’s superior performance compared to the DL model underscores its potential in integrating various algorithms for enhanced prognostic accuracy. This approach leverages the strengths of individual classifiers, leading to significant improvements in predictive performance.
The findings align with previous research on stacking ensemble learning, which has demonstrated improved accuracy and higher AUC compared to single ML models [29, 30]. The limitations of current applications in cancer prognosis highlight the need for further exploration of the stacking ensemble approach.
It should be noted that tumor heterogeneity is not an aspect that can be evaluated through predictive models; these are cellular characteristics that must be assessed using molecular techniques and histopathology.
There is a potential link between smoking status (available in our data) and HPV-positivity as a confounding prognostic factor [19]. We propose this as a key variable for future multi-modal models.
In our study, it is noted that classical ML/ensemble methods often outperform DNNs on smaller datasets due to DNNs’ higher parameter complexity, which aligns with our findings.
While the DeLong test showed no “statistical” significance (p > 0.05) for the PTV vs. GTV AUC difference, the consistent, large-magnitude superiority of PTV features across all metrics (e.g., AUC difference of 0.162) suggests a “clinically relevant” improvement, potentially underpowered due to sample size.
Incorporating clinical and genomic data alongside radiomics features could enhance predictive capabilities. Recent studies have indicated that radiomics-clinical (RC) models yield higher accuracy compared to radiomics-only models [31, 32]. Similarly, radiomics-genomics (RG) models have shown promise in improving survival predictions [33]. This opens avenues for developing integrated models that utilize multi-modal data sources, enhancing the overall predictive power, such as:
Improvement for a more advanced AI model:
Hybrid frameworks that integrate DL with ensemble approaches will help overcome limitations in DL models seen in this study. While we agree that extended timeframe prediction could offer theoretical insights, we proposed multi-modal integration: adding genomic markers to improve long-term robustness of the AI model [31–33].
More sample size and feature diversity:
Enhance the SEML model using larger and more diverse cohorts, including different demographic and tumor characteristics, to ensure broad clinical applicability and robustness of the model.
External validation/Generalizability
To increase SEML model reliability and ability to apply wider, a multi-step validation approach is proposed. (1) Partnership with international institutions [e.g., TCIA, International Cancer Genome Consortium (ICGC)] to test performance based on a different demographic, and the imaging techniques; (2) Prospective studies undertaken in not less than 3 hospitals using a standard feature extraction of images; (3) Comparison with previous approaches like TNM staging, single-model radiomics; and (4) Enrichment of prediction model incorporating genomic and clinical data. It is expected that outcomes will include generalization confirmation, biases detection, and ways of FDA clearance. The timeline is 6 months for setup, 1 year for retrospective validation, and 2–3 years for prospective trials. This approach ensures rigorous, scalable validation for clinical adoption.
Clinical Deployment Pathway
Integration of the SEML model in clinical practice is likely to launch in multi-centers or institutions, followed by modifications and final implementation in the form of operations in hospital systems to support real-time prognoses. There are challenges that may involve Imaging protocol standardization, clinician training, and practices. One of them is obtaining regulatory approval (e.g., FDA/CE marking). Data privacy (e.g., GDPR/HIPAA), and more efficient computational resource use will also help make deployment easier. The pilot studies and implementation in phases are suggested to fine-tune the model to integrate it with the real-world workflows.
Hyperparameter tuning: In our future study, we adopt a systematic approach to model development that includes an initial exploration of hyperparameter settings for our base learners and the meta-learner. While the specific tuning methods, such as grid search or random search, were not detailed in the manuscript, we will conduct preliminary experiments to identify optimal parameter ranges for each model. For each base learner (DT, RF, SVM, and GLM), we will utilize default settings that are commonly accepted in previous studies, ensuring a strong baseline performance while allowing for model interpretability.
Additionally, for the meta-learner (XGBoost), the parameters were chosen based on best practices and general guidelines from the literature, focusing on performance metrics rather than exhaustive tuning, given the constraints of our dataset size.
To ensure reproducibility, we plan to provide detailed hyperparameter settings and tuning methodologies. We believe that this balance between rigor in model setup and practical application provides a solid foundation for our research findings.
The SEML model can pave the way for personalized treatment strategies by:
Predicting patient-specific survival outcomes to optimize treatment plans.
Integrating into clinical decision support systems for better, but not limited to, head-and-neck cancer management.
Enabling earlier interventions in high-risk cases based on model predictions.
Integrating clinical/genomic data. A study [34] indicated that the integration of pre-treatment CT-derived radiomic biomarkers and TNM stage was predictive of 5-year progression-free survival post-chemoradiation in locally advanced HNSCC (LA-HNSCC) patients, suggesting its utility for clinical risk stratification.
This study is the first to employ a stacking ensemble learning approach in a predictive model for estimating cancer prognosis in HNSCC patients. The SEML model demonstrated high accuracy (93%), sensitivity (100%), and specificity (83%) in predicting five-year survival. The results affirm the effectiveness of the stacking ensemble approach in enhancing prognostic accuracy, laying a foundation for its clinical application and potential to facilitate personalized treatment for cancer patients.
CT: computed tomography
DL: deep learning
DNN: deep neural network
GLM: generalized linear model
GTV: gross tumor volume
HNSCC: head and neck squamous cell carcinoma
ML: machine learning
PTV: planning target volume
RF: Random forest
ROC: receiver operating characteristic
SEML: stacking ensemble machine learning
SVM: support vector machine
TCIA: The Cancer Imaging Archive
TNM: Tumor, Node, Metastasis
1Wavelet Transform is a mathematical tool that breaks down signals (like sound or images) into small wave-like components called wavelets. Since the wavelet transform captures both frequency and timing information, making it great for analyzing signals with sudden changes.
HYTW: Conceptualization, Supervision, Project administration. CX: Methodology, Validation, Formal analysis. FT: Conceptualization, Methodology, Software, Formal analysis, Writing—original draft, Supervision, Funding acquisition. CCYC: Investigation, Writing—original draft. VTYL: Investigation, Resources, Writing—review & editing. SWYL: Investigation, Resources. All authors have read and agreed to the published version of the manuscript.
The authors declare no conflict of interest.
This is a retrospective study using public database. No IRB review is needed.
The data is obtained from public database, no informed consent is needed.
Not applicable.
The image data is available from: https://www.cancerimagingarchive.net/collection/hnscc/.
UGC Research Matching Grant: [2021-02-75 RMGS210201], TWC College Research Grant: [2023-00-51 CRG230204], TWC School Research Grant: [2023-02-52 SRG230203]. The funders had no role in study design, data collection and analysis, decision to publish, or preparation of the manuscript.
© The Author(s) 2026.
Open Exploration maintains a neutral stance on jurisdictional claims in published institutional affiliations and maps. All opinions expressed in this article are the personal views of the author(s) and do not represent the stance of the editorial team or the publisher.
Copyright: © The Author(s) 2026. This is an Open Access article licensed under a Creative Commons Attribution 4.0 International License (https://creativecommons.org/licenses/by/4.0/), which permits unrestricted use, sharing, adaptation, distribution and reproduction in any medium or format, for any purpose, even commercially, as long as you give appropriate credit to the original author(s) and the source, provide a link to the Creative Commons license, and indicate if changes were made.

View: 2138
Download: 22
Times Cited: 0
Yigitcan Cakmak, Ishak Pacal
Suleyman Naral ... Ishak Pacal
Antonio Navarro-Ballester