Original Article

Affiliation:
1Department of Medical Biophysics, University of Toronto, Toronto, ON M5G 1L7, Canada
ORCID: https://orcid.org/0000-0002-0945-4645
Affiliation:
2NetraMark, Toronto, ON M4P 2E5, Canada
3Faculty of Mathematics, David R. Cheriton School of Computer Science, University of Waterloo, Waterloo, ON N2L 3G1, Canada
4Department of Psychiatry and Behavioral Sciences, Leonard M. Miller School of Medicine, University of Miami, Coral Gables, FL 33124, USA
Affiliation:
2NetraMark, Toronto, ON M4P 2E5, Canada
Affiliation:
4Department of Psychiatry and Behavioral Sciences, Leonard M. Miller School of Medicine, University of Miami, Coral Gables, FL 33124, USA
5Department of Biomedical, Metabolic and Neural Sciences, University of Modena and Reggio Emilia, 41121 Modena, Italy
6VeraSci, Durhan, NC 27707, USA
ORCID: https://orcid.org/0000-0001-9273-2839
Affiliation:
2NetraMark, Toronto, ON M4P 2E5, Canada
Affiliation:
2NetraMark, Toronto, ON M4P 2E5, Canada
7Department of Pathology and Molecular Medicine, Queen’s University, Kingston, ON K7L 3N6, Canada
8The Centre for Biotechnology and Genomics Medicine, Medical College of Georgia, Augusta University, Augusta, GA 30912, USA
9The Clarke Center for Human Imagination, University of California San Diego, La Jolla, CA 92093-0021, USA
Email: joseph.geraci@netramark.com
ORCID: https://orcid.org/0000-0003-0967-2164
Explor Med. 2023;4:428–440 DOI: https://doi.org/10.37349/emed.2023.00153
Received: October 17, 2022 Accepted: March 01, 2023 Published: July 26, 2023
Academic Editor: Lindsay A. Farrer, Boston University School of Medicine, USA
Aim: Many small datasets of significant value exist in the medical space that are being underutilized. Due to the heterogeneity of complex disorders found in oncology, systems capable of discovering patient subpopulations while elucidating etiologies are of great value as they can indicate leads for innovative drug discovery and development.
Methods: Two small non-small cell lung cancer (NSCLC) datasets (GSE18842 and GSE10245) consisting of 58 samples of adenocarcinoma (ADC) and 45 samples of squamous cell carcinoma (SCC) were used in a machine intelligence framework to identify genetic biomarkers differentiating these two subtypes. Utilizing a set of standard machine learning (ML) methods, subpopulations of ADC and SCC were uncovered while simultaneously extracting which genes, in combination, were significantly involved in defining the subpopulations. A previously described interactive hypothesis-generating method designed to work with ML methods was employed to provide an alternative way of extracting the most important combination of variables to construct a new data set.
Results: Several genes were uncovered that were previously implicated by other methods. This framework accurately discovered known subpopulations, such as genetic drivers associated with differing levels of aggressiveness within the SCC and ADC subtypes. Furthermore, phyosphatidylinositol glycan anchor biosynthesis, class X (PIGX) was a novel gene implicated in this study that warrants further investigation due to its role in breast cancer proliferation.
Conclusions: The ability to learn from small datasets was highlighted and revealed well-established properties of NSCLC. This showcases the utility of ML techniques to reveal potential genes of interest, even from small datasets, shedding light on novel driving factors behind subpopulations of patients.
The collection of transcriptomic data is expensive, resulting in datasets with a small number of sample sizes (in the hundreds) but thousands of variables. As a result, several techniques that are making significant strides in the imaging space, such as deep neural networks, are not suitable for these datasets, as they require a large number of samples. Furthermore, the heterogeneity of the patient population and the complexity of diseases found in oncology requires going beyond the labels. The development of techniques that can explain the driving variables behind patient subpopulations is tremendously valuable in identifying and developing novel therapeutic agents—this is particularly relevant for mapping out heterogeneous diseases such as lung cancer.
Lung cancer is the leading cause of cancer mortality worldwide, with non-small cell lung cancer (NSCLC) accounting for 85% of all lung cancers [1]. NSCLC can be divided into three histological subtypes with distinct phenotypes and prognoses: adenocarcinoma (ADC), squamous cell carcinoma (SCC), and large cell carcinoma (LCC) [2, 3]. The histological differences across these subtypes suggest that distinct molecular mechanisms underlie the observed phenotypic differences. Although the differential gene expressions across NSCLC subtypes have been of increasing interest, the therapeutic implications on how these pathways interact are only more recently being investigated [4]. The remarkable degree of genetic variability within each histological subtype further highlights the importance of molecular biology and genotyping for NSCLC [5, 6].
Fortunately, machine learning (ML) advancements have served as promising tools for stratifying NSCLC, predicting transcriptional mutations based on histological slides, and discriminating NSCLC subtypes through genomic expression levels. The bulk of ML efforts has focused on image analysis for predicting the stage of NSCLC [7–10]. However, the growing body of evidence highlighting the molecular abnormalities that underlie the genomic subtypes of NSCLC can train ML algorithms to identify novel biomarkers for NSCLC, moving towards precision medicine [11–13]. For instance, previous reports have identified that ADC is associated with increased expression of genes related to protein transport and cell junctions, while SCC is associated with increased expression of genes related to cell division and DNA replication [14]. An analysis of gene expression profiles between ADC and SCC using ML has been previously reported, identifying several genes including cystatin-A (CSTA), tumor protein p63 (TP63), serpin family B member 13 (SERPINB13), chloride channel accessory 2 (CLCA2), bicaudal D cargo adaptor 2 (BICD2), P53 apoptosis effector related to PMP22 (PERP), FAT atypical cadherin 2 (FAT2), basonuclin 1 (BNC1), ATPase phospholipid transporting 11B (ATP11B), family with sequence similarity 83 member B (FAM83B), keratin 5 (KRT5), par-6 family cell polarity regulator gamma (PARD6G), and plakophilin 1 (PKP1) which were differentially expressed in ADC and SCC [15].
Other computational methods for discriminating genetic drivers of NSCLC have been previously investigated. A k-means clustering method was used to classify genetic subtypes of ADC [16]. Healthy and ADC tissue was then classified using a support vector machine followed by input into a self-organizing map neural network. The neurons in the output layer were categorized using a hierarchical clustering method to divide ADC tumours into four genetic subtypes. Two subtypes were found to have high expression levels of immune-related genes, suggesting the existence of heterogenous subpopulations of NSCLC. In another study, researchers also used hierarchal clustering of copy number variations to derive insights into NSCLC drug response [17].
Several ML frameworks have been previously developed specifically tailored for small datasets. A one-shot learning approach called CancerSiamese has been used to predict cancer types while highlighting several marker genes to predict metastatic or primary tumour signatures [18]. A second ML approach has shown promise in deriving insights into immune cell populations in a rare disease application [19].
In order to identify novel driving genes that distinguish these two broad subtypes, a combination of ML tools was designed to learn from patient datasets to analyze gene expression data derived from ADC and SCC NSCLC patients. Because large datasets are critical for most contemporary ML methods such as deep neural networks, there is a need for alternative techniques when data banks are insufficient to train the model. In addition, significant features found within small datasets may become diluted by more obvious statistical features and hence over-represented in large datasets. As such, ML methods must be carefully used and complemented by statistical methods that allow for the discovery of non-linear ways in which groups of genes may interact to drive disease heterogeneity. The methodology presented here is designed for small datasets—a novel way of hypothesizing genetic subpopulations that may result in pathogenesis. For example, the ML framework proposed here has been previously used on a small genetic dataset consisting of Alzheimer’s disease brain samples [20]. Several genetic pathways associated with Alzheimer’s disease were uncovered, suggesting that even with a small dataset, there exists a high degree of genetic complexity within pathophysiology. Similarly, the findings presented here support genes previously reported to distinguish ADC and SCC subtypes. However, the novelty of this work lies in the ability to discover previously unknown subpopulations that are defined by several genes at a time. These findings shed light on the different mechanisms at play within these subtypes.
Two data sets were used, consisting of 40 samples of ADC and 18 samples of SCC (GSE10245) [21] and 14 samples of ADC and 32 samples of SCC (GSE18842) [22] to obtain a total of 104 samples (Table 1). Only GSE10245 was used when analyzing gene expression levels for discriminating differences between sex as this data was omitted from GSE18842. Genetic expression levels denote Robust Multi-Array Average-calculated signal intensity [23].
Characteristics of datasets used to generate NSCLC hypotheses
The methodology was developed to organize the resulting models from several well-known ML methods to explore NSCLC genetic heterogeneity within a small dataset. The only proprietary method used for these results is a novel feature selection tool that is part of the NetraAI system which incorporates systems biology [20, 24, 25] and can help produce clustering diagrams as provided in this paper. This was used to create several reduced datasets with significantly fewer variables, e.g., less than a hundred. These reduced datasets are available upon request to encourage reproducibility and further research. The following algorithm was used based on standard methods to create models and insights (Figure 1). For the work reported in this paper, the following tailored process was utilized after performing the aforementioned feature reduction:
First, variable importance was calculated via ensemble trees (Random Forest) through cross-validation [26, 27]. The dependent variables used were ADC vs. SCC.
Principal components were utilized as a linear unsupervised clustering method to reveal obvious subpopulation structures.
The loadings from the principal components were utilized to reduce the variables further.
Using the t-SNE [28], HDBSCAN [29], and UMAP [30] algorithms, subpopulations were extracted.
Sample IDs were collected from the clusters formed from these two clustering models, then systematically compared each group with the others, and applied statistical methods to determine differentially expressed gene candidates.
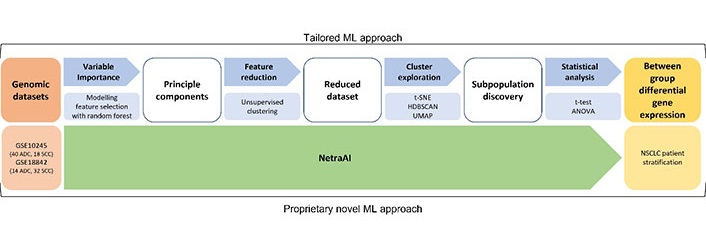
ML approach for small datasets. Using two NSCLC datasets, a tailored ML approach was used consisting of feature selection with random forest, unsupervised clustering, cluster exploration with t-SNE, HDBSCAN, UMAP, and statistical analysis to obtain between group differential gene expression for NSCLC patient stratification. These results were validated using the proprietary NetraAI which generates hypotheses across different groups of patients. t-SNE: t-distributed stochastic neighbor embedding; HDBSCAN: hierarchical density-based spatial clustering of applications with noise; UMAP: uniform manifold approximation and projection; ANOVA: analysis of variance
Clustering was performed via principal components, t-SNE, HDBSCAN, and UMAP as these were the basis of the maps found in this paper. These methods were used to organize the resulting clustering models, in addition to the random forest models, such that the models were capable of being explored interactively to derive a deeper understanding of the driving genes behind the subclusters [20].
A critical shortcoming of working with small data is that it is highly unlikely to represent the totality of the real-world phenomenon it represents, in this case, NSCLC. This means that creating reliable models that are meant to become biomarkers for the disorder is nearly impossible. However, what is possible is the discovery of a subpopulation of patients that all have a set of variables in common, in this case, gene expression. This cluster of patients can be regarded as a hypothesis and therefore classical statistics can be used to evaluate the significance of the findings. In this way, small data sets can be interrogated with the tailored process summarized in Figure 1 in order to extract potentially meaningful discoveries.
The methods here and those described in [20, 24, 25] are designed to address how to extract clear insights about subgroups of patients and their driving variables, while innovative methods found in [31, 32] are well suited to create models for predictions and decision making when sufficient data to do so is available.
Statistical analyses were implemented in order to determine significant differences in gene expression data. The following represents a summary of the statistical methods employed:
Bar plot means values represent the mean expression level while error bars represent the standard deviation (SD) of the pooled data from each probe ID. Bar plot P-values were calculated using an unpaired t-test, where P-values < 0.05 were considered statistically significant.
To determine the significance of a gene, a standard student t-test was used when two subpopulations were compared, and if more than two subpopulations were compared, ANOVA was used. The resulting clusters were plotted for the purpose of illustrating the findings.
Bonferroni corrections were implemented whenever univariate statistics were utilized for feature selection and when initiation comparisons with ANOVA and t-tests.
Using the ADC and SCC tumour gene expression data, this tailored ML approach for small datasets was able to help generate a map distinguishing SCC (blue) and ADC (red) subjects, Loop 1 and Loop 2, respectively (Figure 2). The key genes that were found to have driven this distinction were desmocollin-3 (DSC3), visinin-like protein 1 (VSNL1), solute carrier family 6 member 10 (SLC6A10P), interferon regulatory transcription factor 6 (IRF6), dystonin (DST), CLCA2, desmoglein 3 (DSG3), lysophosphatidylcholine acetyltransferase 1 (LPCAT1), cingulin (CGN), and phyosphatidylinositol glycan anchor biosynthesis, class X (PIGX). Of these, all genes except for LPCAT1 were overexpressed in Loop 1, the SCC subjects. Meanwhile, Loop 2 consisting of ADC subjects was characterized by LPCAT1 overexpression.
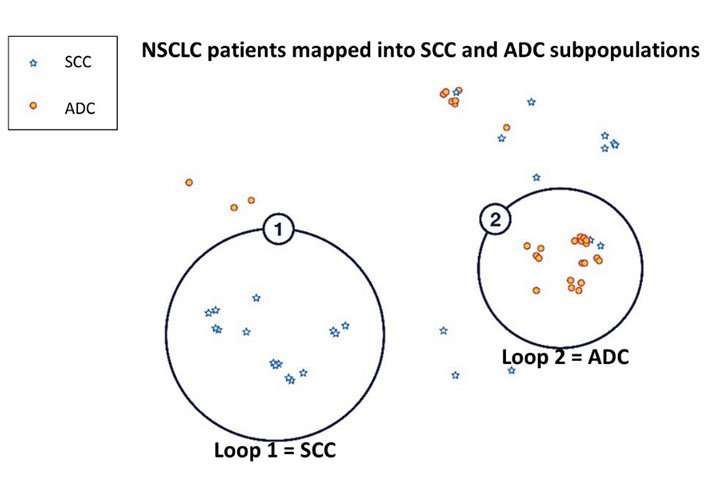
Stratification of NSCLC patients into SCC and ADC using NetraAI. Loop 1 consisting of SCC (blue) subjects and Loop 2 consisting of ADC (red) subjects were delineated by HDBSCAN. These subpopulations were identified by clustering methods that stratified patients due to the statistically significant differential expression of DSC3, VSNL1, SLC6A10P, IRF6, DST, CLCA2, DSG3, LPCAT1, and PIGX between the two loops
Collectively, in the analysis of these two datasets, total of 10 genes were identified that discriminate ADC and SCC patient populations. It is worth mentioning that 9 of the 10 genes identified have been previously reported to be differentially expressed in SCC and ADC (Table 2), further validating the methods used here. The novel gene identified that has not been previously associated with NSCLC populations at the time of this report is PIGX.
Genes discriminating between SCC and ADC
| Gene | Function | Upregulation (SCC/ADC) | Reference |
|---|---|---|---|
| DSC3 | Ca2+-dependent glycoprotein involved in cell adherence | SCC | [22] |
| VSNL1 | Neuronal Ca2+ sensor protein; tumour suppressor gene | SCC | [33, 34] |
| IRF6 | Transcription factor | SCC | [35] |
| DST | Cell adhesion | SCC | [36] |
| CLCA2 | Cell adhesion; tumour suppressor | SCC | [37] |
| PIGX | Tumour suppressor | SCC | - |
| DSG3 | Cell adhesion | SCC | [38–40] |
| LPCAT1 | Cancer progression and metastasis | ADC | [41, 42] |
| SLC6A10 | Neurotransmitter transporter; *pseudogene of SLC6A8 | ADC | [43] |
| CGN | Tight junction | ADC | [21] |
-: blank cell; Ca2+: calcium ion; *: pseudogene of its parent gene SLC6A8
Reports of SCC being characterized by the upregulation of desmosome and gap junction genes and ADC characterized by the upregulation of tight junction genes suggest that NSCLC subtypes are associated with a distinct set of adhesion molecules [21]. Here, SCC was found to be associated with cell adhesion marker DSC3, and ADC was associated with tight junction marker CGN (Figure 3). Specifically, two probes corresponding to DSC3 were identified, 206032_at and 206033_s_at. There was a statistically significant association of both DSC3 probes with SCC (P < 0.0001; Figure 3A). Interestingly, when looking at the dataset including sex, elevated expression of DSC3 was associated with males; however, this was not statistically significant (P = 0.062 for 206032_at and P = 0.077 for 206033_s_at). In contrast, the two probes corresponding to CGN, 223232_s_at, and 223233_s_at were significantly associated with ADC (P < 0.0001; Figure 3B). In contrast, the CGN probes were significantly associated with females (P = 0.014). These results highlight a potential role of sex-based differences in NSCLC that warrant further investigation.
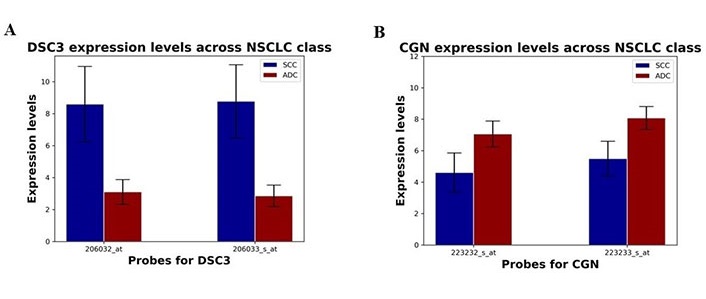
Differential expression of DSC3 and CGN in SCC and ADC NSCLC patient subpopulations. (A) The expression levels of DSC3 probes 206032_at and 206033_s_at (mean ± SD) in SCC and ADC subpopulations; (B) the expression levels of CGN probes 223232_s_at and 223233_s_at in SCC and ADC subpopulations
Further analysis of the two datasets revealed two distinct ADC patient subpopulations (Figure 4). These two loops were distinguished by SLC6A10P, with Loop 2 characterized by overexpression of SLC6A10P (P = 1.3 × 10⁻⁵). The association of SLC6A10P with ADC patients is in line with previous reports [35, 43]. However, increased expression of the pseudogene SLC6A10P in ADC has been associated with increased metastatic risk and reported to be a significant predictor of poor clinical outcome [43]. This suggests that within the ADC patient population there exist unique subpopulations that may be associated with increased aggressive and metastatic propensity.
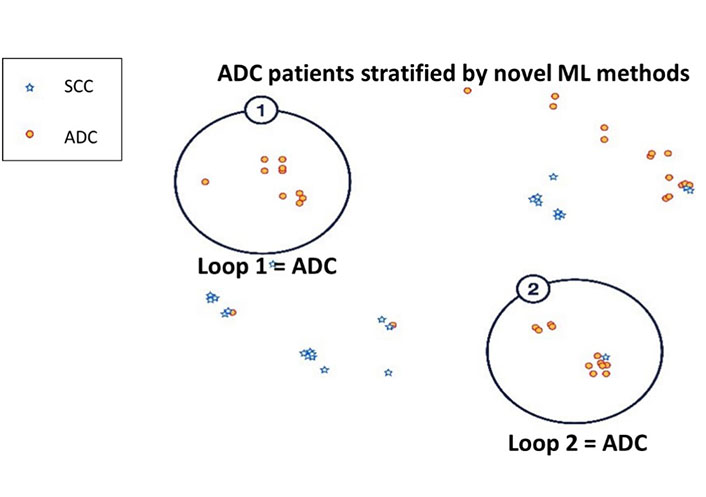
Semi-supervised clustering of ADC patient subpopulations using NetraAI. Analysis of the NSCLC patients revealed two distinct subpopulations of ADC (red) subjects delineated by HDBSCAN. Both Loop 1 and Loop 2 ADC subpopulations were identified by clustering methods that stratified patients due to statistically significant differential expression of SLC6A10P between the two Loops
Not surprisingly, further analysis also revealed two distinct subpopulations of SCC driven by IRF6 and CLCA2 (Figure 5A), which have been previously associated with SCC [35, 37]. IRF6 and CLCA2 expression levels were higher in SCC than in ADC (P < 0.0001; Figure 5B and 5C). Here, Loop 2 was associated with a significantly higher expression of both IRF6 and CLCA2 compared to Loop 1. The significance value between the CLCA2 and IRF6 probes in the two encircled SCC groups were evaluated to be 4.4 × 10⁻⁷, 5.8 × 10⁻³, 9.3 × 10⁻⁷, and 0.046 for the 206164_at, 206165_s_at, 206166_s_at and 1552477_a_at probes, respectively. Considering the strong association of both genes with one specific subpopulation of SCC patients, it highlights an avenue of research focusing on the pathways at play in the etiology of the disease as well as for the identification of novel drugs targeting their combined pathways.
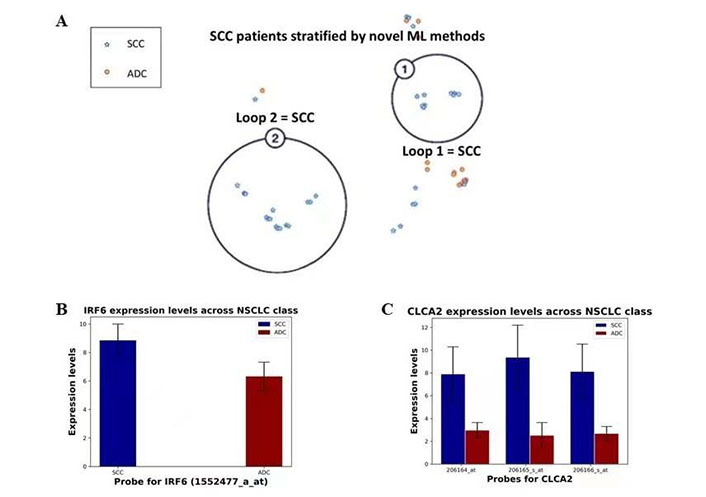
Semi-supervised clustering of SCC patients and differential expression of IRF6 and CLCA2. (A) Analysis of NSCLC patients revealed two distinct subpopulations of SCC (blue) subjects delineated by HDBSCAN within NetraAI. Both Loop 1 and Loop 2 subpopulations were identified by clustering methods that stratified patients due to statistically significant differential expression of IRF6 and CLCA2; (B) the expression levels of IRF6 probe 1552477_a_at (mean ± SD) in SCC and ADC patient subpopulations; (C) the expression levels of CLCA2 probes 206164_at, 206165_s_at, and 206166_s_at (mean ± SD) in SCC and ADC patient subpopulations
Using publicly available NSCLC datasets with a suite of ML techniques appropriate for small datasets had an excellent signal for separating ADC and SCC. The main philosophy followed here is that for smaller datasets, where the patients are unlikely to reflect the distribution of patients in the totality of reality, one can allow ML methods to generate hypotheses about the population available in a small dataset. This allows a researcher to benefit from the power of statistics, in that they can test the hypothesis and derive some measure of confidence. Proprietary methods like the NetraAI empower this hypothesis testing paradigm, but the method described above is also capable of expressing hypotheses in the form of patient clusters.
Here, patient clusters were compared using statistical methods suitable for a dataset with so few samples in order to avoid overfitting that often comes with utilizing contemporary ML methods with small datasets. Further, the transparency of the driving factors is important so that human experience can be used to evaluate what is being ‘discovered’ by the machine.
This study highlights the genetic heterogeneity within NSCLC subtypes. Using this dataset, a set of 10 genes that distinguish ADC and SCC were identified (Table 2). Within these 10 genes, 9 have been previously reported to be associated either with NSCLC or a specific subtype of NSCLC, validating this ML approach. These findings were aligned with previous reports on SCC genes being associated with the organization and assembly of cell and gap junctions, glutathione conjugation and the redox stress response, ECM organization and collagen-related proteins, interferon and cytokine signaling, and HLA downregulation and ADC genes associated with ECM organization proteins and complement, interferon and cytokine signaling, and collagen-related genes and proteins for ECM organization [44]. Another study identified epidermis development, cell division, and epithelial cell differentiation as the most common categories characterizing SCC, and cell adhesion enrichment, biological adhesion, and coagulation for ADC [45]. However, some of the genes identified have not been previously associated with NSCLC or a specific subtype and represent areas that warrant greater investigation for the advancement of precision medicine in NSCLC.
The first of the previously reported NSCLC-associated genes identified was DSC3, which plays a role in epidermal morphology and keratinocyte proliferation [22]. There are several studies that report on DSC3 distinguishing ADC from SCC, with a higher expression in SCC [36, 46–48]. Notably, there has been a report on the association between DSC3 and tumour suppressor activity in NSCLC mediated by inhibition of EGFR [49]. However, there remain contradictory associations between DSC3 and prognosis, with elevated levels associated with increased metastatic risk in melanoma and better prognosis in lung and colon cancer [40]. This suggests that the same protein may have differential effects in the tumour microenvironment (TME), which presents an interesting field of research to understand how DSC3 expression correlates with NSCLC subtypes depending on where they originate in the lung. Reports of upregulation of desmosomes and gap junctions in SCC and tight junctions in ADC suggest that SCC and ADC are characterized by a distinct set of adhesion molecules [21].
In the results presented here, ADC has been reported to be characterized by tight junctions and was identified by CGN and SCC has been characterized by gap junctions and was identified by DSC3 (Figure 3). Males have been reported to have a significantly poorer NSCLC prognosis compared to females, shifting efforts towards sex-based approaches to diagnosis, prognosis, and therapeutic interventions [50, 51]. Additionally, estrogens have been associated with an increased risk of ADC in women despite equal expression of estrogen receptors α and β; however, the role remains unclear [52]. While there are several reports on the sex-based differences in cancer mechanisms, including differences in metabolism, immunity, and angiogenesis, differences in CGN and DSC3 expression have not been previously reported to the best of our knowledge [53]. Gap junction proteins, also known as connexins, serve as channels that connect the interior of adjacent cells, facilitating intracellular homeostasis and coordination of activities via second messengers [54]. Desmosomes primarily provide mechanical strength via a structural network. In contrast, tight junctions form a barrier around the cell, regulating the permeability of the paracellular space [55, 56]. These molecules play critical roles in epithelial-to-mesenchymal transition, a process involved in cancer metastasis. Aside from the current work relating CGN expression to females, no sex-based differences have been previously reported. This presents a unique field of research, as there may be different druggable targets for males and females. The variability of adhesion molecule expression across sex warrants further investigation to elucidate the details of the correlation and advance toward gender related precision medicine.
Interestingly, SLC6A10P was the single gene that was found to distinguish between two specific subpopulations of ADC. SLC6A10P was previously found to be a marker for aggressive ADC [43], and recently, implicated within the Notch signaling pathway [57]. These findings suggest that SLC6A10P warrants further investigation as a genetic biomarker in the context of the ADC patient subpopulation. This demonstrates the power of machine intelligence to reveal etiologies within complex diseases, even when a small number of samples are present. However, the methods must be used to reveal subpopulations that can then be compared using appropriate statistical methods suitable for comparing small groups.
With respect to the SCC patient population, CLCA2 and IRF6 were found to distinguish between two distinct SCC subpopulations. CLCA2 has been reported to be highly expressed in SCC, suggesting that it may serve as a diagnostic marker to differentiate SCC from ADC. Female patients with CLCA2-negative SCC exhibited significantly poorer prognoses [37]. Furthermore, SCC expression was correlated with tumour grade upon histological characterization. In particular, CLCA2-negative samples were associated with poorly differentiated tumours [37].
Most noteworthy, phosphatidylinositol glycan anchor biosynthesis class gene PIGX, was the only gene identified that has not been previously associated with NSCLC. However, there have been reports that PIGX promotes cancer cell proliferation by suppressing EHD2 and ZIC1 in breast cancer [58]. The authors reported that PIGX expression was associated with shorter recurrence-free survival. In the present study, PIGX was found to be a driver of ADC and SCC differentiation, being overexpressed in SCC patients (Figure 2). As a novel gene associated with NSCLC or a specific subtype, this highlights an area that warrants further investigation for the advancement of precision medicine in NSCLC.
In order to create robust predictive models with machine intelligence, large datasets are required, but this study utilized the ability for some of these methods to create hypotheses instead, and then use methods appropriate for small data to test these hypotheses. This method uncovered several genetic subtypes of ADC of SCC, including those driven by SLC6A10P, CLCA2, and IRF6, respectively. Furthermore, these data suggest that the expression levels of adhesion proteins encoded by CGN and DSC3 may play a role in sex-based differences in NSCLC. Finally, this study uncovered a statistically significant driver of NSCLC heterogeneity, PIGX, which warrants further investigation.
This report highlights the use of a novel set of ML techniques that are appropriate for small datasets. The primary aim of using such techniques is to encourage other researchers to explore small datasets that are often otherwise skipped with ML as there may be hidden valuable information within them. Adopting these approaches, one can extract meaningful insights with the techniques described here to move closer toward precision medicine.
ADC: adenocarcinoma
ANOVA: analysis of variance
CGN: cingulin
CLCA2: chloride channel accessory 2
DSC3: desmocollin-3
DSG3: desmoglein 3
DST: dystonin
HDBSCAN: hierarchical density-based spatial clustering of applications with noise
IRF6: interferon regulatory transcription factor 6
LPCAT1: lysophosphatidylcholine acetyltransferase 1
ML: machine learning
NSCLC: non-small cell lung cancer
PIGX: phyosphatidylinositol glycan anchor biosynthesis, class X
SCC: squamous cell carcinoma
SD: standard deviation
SLC6A10P: solute carrier family 6 member 10
t-SNE: t-distributed stochastic neighbor embedding
UMAP: uniform manifold approximation and projection
VSNL1: visinin-like protein 1
JG: Conceptualization, Methodology, Resources, Writing—review & editing, Supervision, Project administration, Funding acquisition. MC: Conceptualization, Visualization. MC and BQ: Methodology, Validation, Formal analysis, Investigation, Data curation, Writing—original draft, Writing—review & editing. JZ, SY and AB: Software. SY: Validation. LP and JG: Writing—review & editing. LP: Project administration.
JG is a major shareholder of NetraMark Corp, where NetraMark is a technology company providing clinical trial support to pharmaceutical companies. LP has previously acted as a scientific consultant for AbbVie USA; Acadia USA; BCG Switzerland; Boehringer Ingelheim International GmbH; Compass Pathways; EDRA-Publishing, Italy; Ferrer Spain; Gedeon-Richter, Hungary; Inpeco SA, Switzerland; Johnson & Johnson USA; NeuroCog Trials USA; Novartis-Gene Therapies, Switzerland; Otsuka USA; Pfizer Global USA; PharmaMar Spain; Relmada Therapeutics USA; Takeda, USA; VeraSci, USA; Vifor Switzerland.
Not applicable.
Not applicable.
Not applicable.
Data was obtained from publicly available datasets GSE10245 https://www.ncbi.nlm.nih.gov/geo/query/acc.cgi?acc=GSE10245 and GSE18842 https://www.ncbi.nlm.nih.gov/geo/query/acc.cgi?acc=GSE18842.
Part of this research was funded by NetraMark Corp in the form of salary for Dr. Joseph Geraci, and computational resources. The funders had no role in study design, data collection and analysis, decision to publish, or preparation of the manuscript.
© The Author(s) 2023.
Copyright: © The Author(s) 2023. This is an Open Access article licensed under a Creative Commons Attribution 4.0 International License (https://creativecommons.org/licenses/by/4.0/), which permits unrestricted use, sharing, adaptation, distribution and reproduction in any medium or format, for any purpose, even commercially, as long as you give appropriate credit to the original author(s) and the source, provide a link to the Creative Commons license, and indicate if changes were made.