 Original Article

Affiliation:
1Amity Institute of Biotechnology, Amity University Maharashtra, Mumbai-Pune Expressway, Bhatan, Post-Somathne, Panvel 41020, Maharashtra, India
ORCID: https://orcid.org/0000-0002-2220-5360
Affiliation:
1Amity Institute of Biotechnology, Amity University Maharashtra, Mumbai-Pune Expressway, Bhatan, Post-Somathne, Panvel 41020, Maharashtra, India
ORCID: https://orcid.org/0000-0002-4017-8722
Affiliation:
2BioRadius Therapeutic Research Pvt. Ltd., Pune 411057, Maharashtra, India
3School of Bioengineering, Bharath Institute of Higher Education and Research, Chennai 600073, Tamil Nadu, India
ORCID: https://orcid.org/0009-0001-7698-8612
Affiliation:
1Amity Institute of Biotechnology, Amity University Maharashtra, Mumbai-Pune Expressway, Bhatan, Post-Somathne, Panvel 41020, Maharashtra, India
2BioRadius Therapeutic Research Pvt. Ltd., Pune 411057, Maharashtra, India
ORCID: https://orcid.org/0009-0004-9825-9164
Affiliation:
1Amity Institute of Biotechnology, Amity University Maharashtra, Mumbai-Pune Expressway, Bhatan, Post-Somathne, Panvel 41020, Maharashtra, India
ORCID: https://orcid.org/0000-0003-0752-6948
Affiliation:
4Amity University Maharashtra, Mumbai-Pune Expressway, Bhatan, Post-Somathne, Panvel 41020, Maharashtra, India
ORCID: https://orcid.org/0000-0002-9208-0153
Affiliation:
1Amity Institute of Biotechnology, Amity University Maharashtra, Mumbai-Pune Expressway, Bhatan, Post-Somathne, Panvel 41020, Maharashtra, India
Email: rsingh1@mum.amity.edu
ORCID: https://orcid.org/0000-0001-5748-5799
Explor Immunol. 2025;5:1003231 DOI: https://doi.org/10.37349/ei.2025.1003231
Received: June 03, 2025 Accepted: November 26, 2025 Published: December 18, 2025
Academic Editor: Danay Saavedra, Center of Molecular Immunology, Cuba
Aim: To determine whether PepTivator® melanoma-associated antigen-A3 (MAGE-A3) primes early T-cell activation and memory skewing in human peripheral blood mononuclear cells (PBMCs).
Methods: PBMCs from 10 donors were stimulated with MAGE-A3 (manufacturer-recommended dose), negative control (NC), or CD3/CD28 and CytoStim™ (PC: positive control). Activation [CD69, CD25, HLA-DR (human leukocyte antigen-DR isotype)], proliferation, cytokines [24 h; GM-CSF (granulocyte-macrophage colony-stimulating factor), IFN-γ (interferon-gamma), IL-2 (interleukin-2), TNF-α (tumor necrosis factor-alpha)], and memory phenotypes (CD45RO/CD27 at days 0/7/14) were quantified by flow cytometry and MACSPlex. Paired statistics used repeated-measures models with Šidák correction; cytokines were analyzed on log10 scale.
Results: MAGE-A3 significantly increased early activation (CD69 ↑, CD25 ↑) and modestly increased proliferation, with selective IL-2/TNF-α rise and minimal IFN-γ and modest HLA-DR. Across two weeks, 6/10 donors showed increased central memory T cell (TCM)/effector memory T cell (TEM) with a corresponding decline in naïve cells relative to NC. Variability across donors was evident.
Conclusions: MAGE-A3 primes partial activation and memory skewing of human T cells in vitro, suggesting utility as a component antigen that likely benefits from professional antigen-presenting cell (APC) presentation and/or costimulation. We discuss limitations (single dose, in vitro context, donor variability) and implications for future dose-response, HLA-stratified, and APC-supported studies.
Lung cancer is the leading cause of death among men and women, with approximately 2 million cases being diagnosed every year [1]. The majority of patients are diagnosed at later stages because of a lack of early symptoms; hence, they are diagnosed at stages where they have already metastasized, thereby decreasing the survival rate [2]. Chemotherapy has been a commonly employed treatment regimen for the past 70 years; however, there has been a recent rise in immunotherapies for cancer. Immunotherapies harness the potential of the immune response and direct targeted antibodies and immune cells against the tumor [3].
T lymphocytes play a crucial role in preventing tumorigenesis and act as key mediators in the immune response against cancer cells [4]. Cancer cells present tumor antigens to T lymphocytes and activate them. However, this immune activation is often impaired by the immunosuppressive tumor microenvironment. Tumor cells have an immune escape mechanism, which is governed by the immunosuppressive tumor microenvironment [5]. Cancer cells downregulate or lose the expression of such tumor antigens, which can be recognized by the immune cells, thus escaping the immune response [6].
Melanoma-associated antigen-A3 (MAGE-A3) is widely expressed across various tumors, including those derived from epithelial and stem cell origins such as lung, ovarian, melanoma, breast, and brain cancers [7]. Its expression is mainly found in tumor tissue but not in normal tissue, other than the human testis and placenta. In germline cells, the lack of MHC I ensures that MAGE-A3 is not presented and the immune cells do not recognize this antigen, unless expressed in aberrant cells [8]. Independent studies have shown that MAGE-A3 inhibits apoptosis of cancer cells, hence favouring tumor formation. This expression of MAGE-A3 by cancer cells can be harnessed to stimulate cytotoxic T lymphocytes against MAGE-A3-expressing cancer cells [7].
MAGE-A3 expression in cancer, such as head and neck squamous cell carcinoma, has shown better disease-free survival, hence independently acting as a prognostic factor. In various other types of cancer, further studies are needed to comment on the prognosis associated with MAGE-A3 expression [9]. In our systematic review, we summarized the experimental and clinical evidence for MAGE-A3, including tumor-restricted expression, epitope breadth, and the recurring requirement for optimized antigen presentation and co-stimulation to achieve durable T-cell responses [10]. Complementing this, our recent in-silico analysis in lung adenocarcinoma reported frequent MAGE-A3 transcripts alongside heterogeneous antigen-presentation module activity (HLA-I/B2M/TAP) and context-dependent associations with CD8 memory/exhaustion states [11]. These observations support a focused in vitro test of MAGE-A3 immunogenicity and help define realistic expectations in the absence of professional antigen-presenting cell (APC) support.
While prior studies and trials of MAGE-A3 vaccines have been inconclusive, detailed cellular and molecular mechanisms remain poorly understood. Professional APCs integrate signal 1 (peptide-MHC), signal 2 (co-stimulation), and signal 3 (polarizing cytokines). Peptide-only systems, therefore, tend to yield partial activation unless APC help is provided. Guided by our systematic review and in silico findings [10, 11], our study isolates the antigenic effect of MAGE-A3 in this APC-free context and uses donor-level kinetics to examine whether a single exposure can seed memory-like states. Contemporary DC-targeting, vector-based delivery, and adjuvant strategies improve MAGE-epitope presentation and have yielded stronger CD4+/CD8+ responses in vitro and early clinical contexts, motivating the optimization steps we outline here. Therefore, we conducted an in-depth analysis of how MAGE-A3 exposure alters T-cell activation, proliferation, cytokine secretion, and differentiation. This study aims to characterize the cellular and molecular impact of MAGE-A3 on T cells to inform future immunotherapeutic strategies.
Peripheral blood mononuclear cells (PBMCs) were obtained from 10 healthy adult donors (8 males, 2 females; age range 26–35 years), procured from BioRadius Therapeutic Research Pvt. Ltd., Pune, India (Batch No: PB/BL/02). All donors underwent standardized screening procedures, including laboratory serology, medical history, vital signs, and physical examination, and met the predefined inclusion criteria: non-smoking, healthy, and aged between 18 and 45 years. Written informed consent was obtained in accordance with SOPs (CR006-05, CD013-03, CR002-02, and CR009-01), as approved by the Institutional Ethics Committee of BioRadius. Full donor metadata and certification are provided in Figure S1. PBMCs were cultured in TexMACS medium (Miltenyi Biotec, Bergisch Gladbach, Germany) supplemented with 10% heat-inactivated fetal bovine serum (Cat. No. RM10951; HiMedia Laboratories, Mumbai, India) and 1% antibiotic-antimycotic solution (Cat. No. 15240062; Gibco, USA).
PBMCs (1.5 × 10⁶ per well) were stimulated with PepTivator® MAGE-A3 (premium grade, human; stock 30 nmol/mL; Cat. No. 130-095-384; Miltenyi Biotec, Germany) at 1 nmol of each peptide per mL, per manufacturerʼs instructions for peptide-pool restimulation for 24 h. For 15-mer peptides, this corresponds to ≈ 1.67 μg/mL per peptide. Because PepTivator® products are peptide pools, mass/volume is reported per peptide; the aggregate pool mass depends on peptide count. Activation markers were assessed at 6 h (CD69), 18 h (CD25), and 24 h (HLA-DR: human leukocyte antigen-DR isotype) post-stimulation.
Flow cytometry was performed on a MACSQuant® Analyzer 10 (Model 130-096-343; Miltenyi Biotec, Germany) using the following antibodies (all Miltenyi Biotec, Germany): CD3-PE (Clone REA613; Cat. No. 130-113-139), CD69-FITC (Clone REA824; Cat. No. 130-112-612), CD25-APC (Clone REA570; Cat. No. 130-113-284), HLA-DR-FITC (Clone REA805; Cat. No. 130-111-788).
PBMCs were labeled with CellTrace™ CFSE Cell Proliferation Kit (Cat. No. C34554; Thermo Fisher Scientific, Waltham, MA, USA; CFSE: carboxyfluorescein succinimidyl ester) before stimulation to assess proliferation. CD3⁺ lymphocytes were gated for analysis. For activation controls, the T Cell Activation/Expansion Kit, human (Cat. No. 130-091-441; Miltenyi Biotec, Germany) containing anti-CD3/CD28 and CytoStim™ (Cat. No. 130-092-173; Miltenyi Biotec, Germany) was used as the positive control (PC), and untreated cells served as the negative control (NC), a soluble polyclonal T-cell activator. Thus, “CD3/CD28” and “PC” represent two distinct positive control reagents and are plotted as separate groups in all figures. Cytokine analysis [IL-2 (interleukin-2), TNF-α (tumor necrosis factor-alpha), IFN-γ (interferon-gamma), GM-CSF (granulocyte-macrophage colony-stimulating factor)] was performed on culture supernatants after 24 h using the MACSPlex Cytokine 12 Kit, human (Cat. No. 130-099-169; Miltenyi Biotec, Germany).
PBMCs from the same donors were stimulated with PepTivator® MAGE-A3 and analyzed for memory T cell marker expression on days 0, 7, and 14 in the presence of IL-2 (50 U/mL replenished every 48 h). Only 6 of 10 donors showed measurable memory T cell induction and were included in kinetic analysis. T cell subsets were defined as: Naïve = CD3+CD45RO–CD27+, Central memory = CD3+CD45RO+CD27+, Effector memory = CD3+CD45RO+CD27–. Memory marker staining was performed using: CD27-APC (Clone REA499; Cat. No. 130-113-636; Miltenyi Biotec, Germany) and CD45RO-PE (Clone REA611; Cat. No. 130-113-559; Miltenyi Biotec, Germany).
PBMCs were stained with directly conjugated antibodies to CD3, CD69, CD25, HLA-DR, CD45RO, and CD27 (clones/fluorochromes/catalog numbers in Table S1). Data were acquired on a MACSQuant® cytometer with compensation from single-stained controls and analyzed using a uniform template across donors and conditions. Gating proceeded as follows (see Figure 1A and Figure 3A for representative plots): (i) lymphocytes by FSC-A vs. SSC-A; (ii) singlets by FSC-H vs. FSC-A; (iii) CD3+ T cells as the parent gate. Activation readouts were calculated on the CD3+ gate as %CD3+CD69+, %CD3+CD25+, and %CD3+HLA-DR+, with positivity set from matched fluorescence-minus-one (FMO) and unstimulated (NC) controls and then applied uniformly to all conditions. For memory phenotyping, the CD3+ gate was plotted as CD45RO vs. CD27 (bi-exponential display for visualization only); quadrant boundaries were defined with FMOs on Day 0 and held constant for Day 7 and Day 14 within each donor to avoid threshold drift. Subsets were defined as naïve-like (CD45RO–CD27+), central memory-like (CD45RO+CD27+), effector memory-like (CD45RO+CD27–), and effector-like (CD45RO–CD27–). Proliferation indices (PIs; CFSE) were computed on CD3+ cells using the software’s default proliferation model.
Flow cytometry data were acquired on a MACSQuant® Analyzer 10 and analyzed in FlowJo v10.1.0. Analyses were performed in GraphPad Prism v8.4.2. Because each donor contributed to all conditions (within-subject), we used paired/repeated-measures models. Cytokines were analyzed after log10 transformation (values < LOD set to LOD/√2 before transform) but are graphed as pg/mL on log10 axes. Percentages were analyzed on the original scale. Decision rule: if any group for an endpoint failed normality (Shapiro-Wilk), that endpoint was tested with Friedman’s matched test and Dunn’s multiplicity-adjusted comparisons; otherwise, we used one-way repeated-measures ANOVA with Šídák post-hoc tests. Two-way designs (memory kinetics) used two-way repeated-measures ANOVA (condition × time) with Šídák simple-effects comparisons; Geisser-Greenhouse correction was applied when sphericity was violated. If any cell was missing, a mixed-effects model (REML or restricted maximum likelihood) replaced RM-ANOVA. Wilcoxon signed-rank tests were used for prespecified paired contrasts when noted. Exact two-sided P values are reported; α = 0.05. Data are shown as mean ± SD in the main figures and mean ± SEM in Figure S2, with individual donor values overlaid. Raw data is provided in Table S2, and full ANOVA tables and multiplicity-adjusted comparisons are provided in Table S3.
We first assessed early activation after a single exposure to PepTivator® MAGE-A3. Across conditions, activation marker frequencies differed significantly (one-way repeated-measures ANOVA with Geisser-Greenhouse). For CD3⁺CD69⁺ at 6 h there was a robust overall effect, F(1.556, 14.00) = 440.1, P < 0.0001 (Figure 1; Table S3). Pairwise Šidák tests showed MAGE-A3 > NC (P = 0.0004) and MAGE-A3 < CD3/CD28 (P < 0.0001); PC vs. CD3/CD28 was not different (P = 0.9672). For CD3+CD25+ at 18–24 h, the overall effect remained significant, F(1.434, 12.90) = 354.6, P < 0.0001; MAGE-A3 > NC (P < 0.0001) and MAGE-A3 < CD3/CD28 (P < 0.0001), while PC vs. CD3/CD28 was not different (P = 0.5381). In contrast, CD3+HLA-DR+ at 24 h showed an overall effect, F(2.094, 18.85) = 127.8, P < 0.0001, but MAGE-A3 vs. NC was not significant (P = 0.636), whereas MAGE-A3 < CD3/CD28 (P < 0.0001) and PC < CD3/CD28 (P = 0.0092) (Figure 1B; Table S3). Donor-level values are shown as mean ± SD with individual points (n = 10); raw data are provided in Table S2.
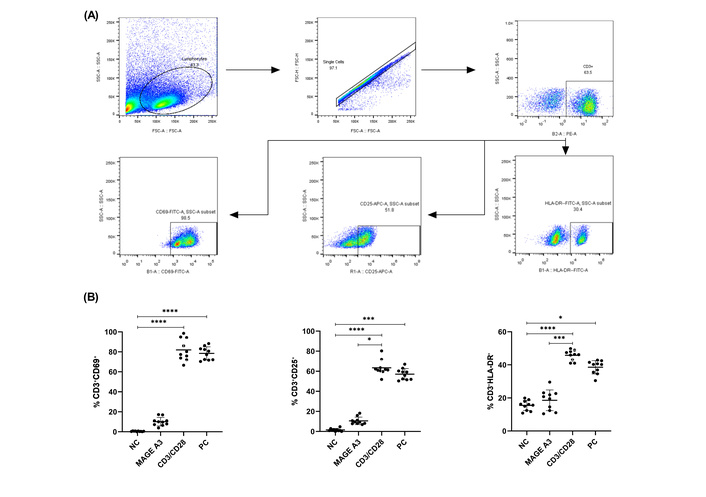
CD69, CD25, and HLA-DR expression on CD3+ cells after MAGE-A3 stimulation. (A) Representative gating: FSC/SSC→singlets→live→CD3+; example gates for CD69, CD25, and HLA-DR. (B) Frequencies of CD3+CD69+ (6 h), CD3+CD25+ (18–24 h), and CD3+HLA-DR+ (24 h) after stimulation with NC, MAGE-A3 (PepTivator®, 1 nmol of each peptide per mL), CD3/CD28, and CytoStim™ or PC. Symbols show individual donors with mean ± SD (n = 10). Statistics: paired RM-ANOVA (Geisser-Greenhouse) with Šídák (primary); where any group failed normality (Shapiro-Wilk), paired Friedman with Dunn’s post-hoc is reported. *P < 0.05; ***P < 0.001; ****P < 0.0001. Shown brackets; CD69: NC vs. CD3/CD28, NC vs. PC; CD25: NC vs. CD3/CD28, NC vs. PC, CD3/CD28 vs. MAGE-A3; HLA-DR: NC vs. CD3/CD28, NC vs. PC, CD3/CD28 vs. MAGE-A3. Not all significant contrasts are drawn as brackets. HLA-DR: human leukocyte antigen-DR isotype; MAGE-A3: melanoma-associated antigen-A3; NC: negative control; PC: positive control.
The PI (CFSE) differed across conditions (one-way repeated-measures ANOVA, Geisser-Greenhouse), F(2.076, 18.69) = 1,481.0, P < 0.0001; Šidák tests indicated MAGE-A3 > NC (P < 0.0001) and MAGE-A3 < CD3/CD28 (P < 0.0001) (Figure 2A; Table S3; n = 10).
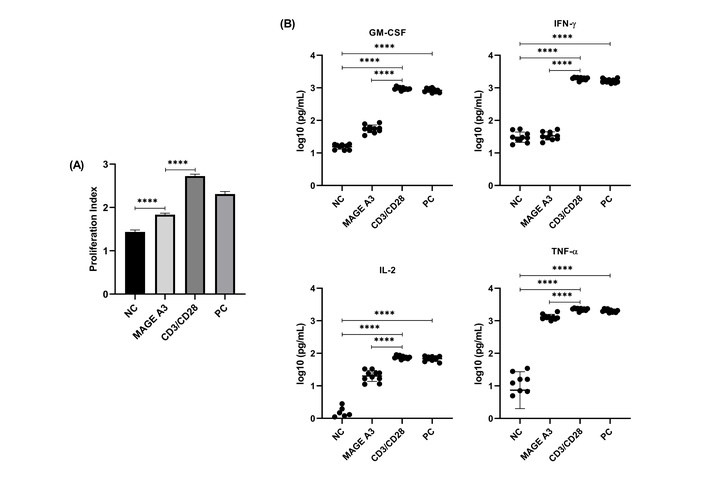
Proliferation index (PI) and cytokine secretion in PBMCs following MAGE-A3 stimulation. (A) PI (CFSE) across conditions. Data are mean ± SD with individual donors (n = 10). (B) Cytokines at 24 h (MACSPlex). All panels use log10 axes with common lower bound = 0.1 pg/mL; points = donors, bars = mean ± SD (n = 10). Statistics: Friedman + Dunn for endpoints with any non-normal group; otherwise RM-ANOVA + Šídák. Exact adjusted P values are in Table S3; asterisks on plots denote multiplicity-adjusted comparisons shown (****P < 0.0001). CFSE: carboxyfluorescein succinimidyl ester; GM-CSF: granulocyte-macrophage colony-stimulating factor; IFN-γ: interferon-gamma; IL-2: interleukin-2; MAGE-A3: melanoma-associated antigen-A3; NC: negative control; PC: positive control; TNF-α: tumor necrosis factor-alpha.
Cytokines were analyzed on log10-transformed values (graphs show raw pg/mL on a log10 axis; values < LOD set to LOD/√2 before analysis; Figure 2B). All four cytokines showed significant overall effects (one-way repeated-measures ANOVA with Geisser-Greenhouse; Figure 2B; Table S3; n = 10). For GM-CSF, F(2.42, 21.8) = 807.0, P < 0.0001; MAGE-A3 > NC and MAGE-A3 < CD3/CD28 (both P < 0.0001), while PC vs. CD3/CD28 was not different (P = 0.522). For IFN-γ, F(1.466, 13.19) = 1,090.0, P < 0.0001; MAGE-A3 vs. NC was not significant (P = 0.718), whereas MAGE-A3 < CD3/CD28 (P < 0.0001) and PC vs. CD3/CD28 was not different (P = 0.0827). For IL-2, F(1.639, 14.75) = 255.7, P < 0.0001; MAGE-A3 > NC and MAGE-A3 < CD3/CD28 (both P < 0.0001), with PC vs. CD3/CD28 not different (P = 0.4556). For TNF-α, F(1.067, 9.602) = 175.6, P < 0.0001; MAGE-A3 > NC and MAGE-A3 < CD3/CD28 (both P < 0.0001), and PC vs. CD3/CD28 not different (P = 0.3448).
To visualize donor-level variability and the magnitude of the difference between stimuli, we computed per-donor Δlog10(pg/mL) = CD3/CD28 − MAGE-A3 and tested against zero. Δ values were strongly positive for all four cytokines [GM-CSF mean Δ 1.24 (95% CI 1.15–1.32), IFN-γ 1.76 (1.67–1.85), IL-2 0.58 (0.46–0.70), TNF-α 0.24 (0.18–0.29); all P < 0.0001], corresponding to ~17-, 58-, 3.8-, and 1.7-fold higher secretion with CD3/CD28 (Figure S1).
We next quantified naïve-like (CD45RO–CD27+), central memory-like [central memory T cell (TCM)-like; CD45RO+CD27+], and effector memory-like [effector memory T cell (TEM)-like; CD45RO+CD27–] frequencies over Day 0, Day 7, and Day 14 under NC, MAGE-A3, and CD3/CD28 (n = 6). Two-way repeated-measures ANOVA (condition × time, Geisser-Greenhouse) detected significant time-dependent changes for all three subsets (Figure 3; Table S3). For TEM-like cells, simple-effects Šidák tests at Day 14 showed MAGE-A3 > NC by 12.6 percentage points (95% CI 10.0–15.2; P < 0.0001) and MAGE-A3 < CD3/CD28 by 17.4 points (95% CI 14.7–20.1; P < 0.0001). For TCM-like cells, Day 14 comparisons indicated MAGE-A3 > NC (P = 0.0011) and MAGE-A3 < CD3/CD28 (P < 0.0001). For naïve-like cells, the condition × time interaction was not significant (P = 0.0924), but Day 14 simple effects showed MAGE-A3 < NC (P = 0.0224) and MAGE-A3 < CD3/CD28 (P = 0.0071), with NC vs. CD3/CD28 not different (P = 0.7439). Full per-timepoint pairwise tables (Day 0 and Day 7) and ANOVA outputs are provided in Table S3; donor-level values are in Table S2.
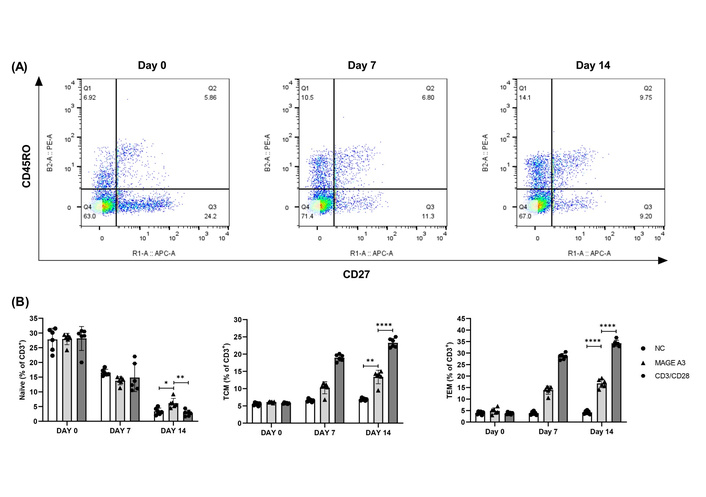
Memory T cell kinetics over 14 days following MAGE-A3 stimulation. (A) Representative CD45RO/CD27 density plots (FlowJo). Default quadrant overlays are shown; the lower-left double-negative quadrant is displayed for context but was not analyzed. (B) Memory subset composition (% of CD3+) at Day 0/7/14. Points = donors; mean ± SD. *P < 0.05; **P < 0.01; ****P < 0.0001. Statistics: two-way RM-ANOVA (condition × time) with Šídák simple effects; for clarity, only Day 14 pairwise results are annotated on the plots, with full Day 0/7 in Table S3. See Figure S2 for line-plot trajectories (mean ± SEM) of Naïve, TCM, and TEM over time. MAGE-A3: melanoma-associated antigen-A3; NC: negative control; TCM: central memory T cell; TEM: effector memory T cell.
To aid visualization of the kinetics, we added line plots of group means ± SEM across time (Figure S2). Naïve cells declined from ~27–30% at Day 0 to ~2–7% by Day 14 across all conditions. TCM rose from ~5–6% at Day 0 to ~13–14% with MAGE-A3 and ~22–24% with CD3/CD28, while remaining ~6–7% in NC. TEM increased from ~4–5% at baseline to ~17–18% with MAGE-A3 and ~33–35% with CD3/CD28 by Day 14, with NC staying ~4–5%. These trajectories mirror the bar-with-points summaries in Figure 3B and are concordant with the two-way repeated-measures ANOVA (condition × time) and Šidák post-hoc tests (Table S3).
PepTivator® MAGE-A3 elicited a rapid activation profile, early CD69 followed by CD25, and was accompanied by modest proliferation and increases in IL-2 and TNF-α at 24 h, whereas HLA-DR and IFN-γ remained limited. This pattern aligns with established kinetics of CD69/CD25 on recently stimulated human T cells [12, 13] and with the roles of IL-2 and TNF-α in clonal expansion and helper function [14–16]. By Day 14, a subset of donors exhibited shifts toward TCM/TEM, consistent with antigen-experienced differentiation trajectories in humans [17]. These outcomes indicate antigen recognition and priming without full effector licensing within the 24 h window. The trajectories in Figure S2 make this pattern explicit—MAGE-A3 drives a gradual Naïve→TCM/TEM transition that is directionally similar to CD3/CD28 but lower in magnitude, consistent with partial activation in the absence of strong costimulation.
The APC-free design explains much of the “partial activation” signature. In the absence of professional APCs, costimulatory “signal 2” and polarizing “signal 3” are constrained, limiting rapid HLA-DR up-regulation and IFN-γ despite measurable activation and proliferation [12–15, 17]. Inter-donor heterogeneity is expected: several immunodominant MAGE-A3 epitopes are presented by HLA-DRB1*04/*07 [18, 19], so natural variation in class II alleles, precursor frequency, and immune history likely produced the responder/non-responder pattern we observed.
These data sit comfortably with prior strategies that enhance class II presentation or add costimulation. Engineering peptide presentation (e.g., invariant-chain fusions, optimized loading) and dendritic cell platforms have increased functional readouts for tumor antigens, including MAGE family members, in preclinical and clinical settings [20, 21]. Our findings support using MAGE-A3 peptide pools as a priming module and then layering APC support and/or agonistic costimulation to drive fuller effector programs.
Dose is an important practical variable. We used the manufacturer-recommended concentration (1 nmol of each peptide per mL; μg/mL equivalence reported in Materials and methods), which standardizes across donors but does not define a biological optimum. Formal dose–response work could test whether higher or lower loads shift the balance between early activation and durable effector function, and whether particular epitopes dominate within distinct HLA backgrounds [18, 20, 21]. Extending cytokine readouts beyond 24 h (e.g., 48–72 h) or adding intracellular cytokine staining may also reveal later IFN-γ dynamics that are muted at 24 h. Inter-donor heterogeneity is expected given HLA class II-restricted presentation, precursor frequency, and immunological history.
Our use of a single manufacturer-recommended dose of PepTivator® MAGE-A3 precludes defining dose–response relationships; peptide abundance influences T-cell activation thresholds, cytokine profiles, and fate decisions [17, 18]. Although 6/10 donors showed measurable memory induction, others did not, highlighting inter-donor heterogeneity consistent with HLA class II restriction, precursor frequency, and immune history; in a modest cohort, this introduces potential selection bias toward donors with pre-existing cross-reactivity [17, 20, 21]. The in vitro PBMC system also lacks tumor-microenvironmental suppression; consequently, effect sizes observed here may not directly translate to in vivo settings [20, 21]. Finally, antigen presentation relied on endogenous APCs without deliberate licensing/co-stimulation; the relative absence of signal 2 (CD80/86-CD28) and signal 3 (e.g., IL-12) helps explain the observed partial activation phenotype (CD69/CD25 ↑ with no HLA-DR induction and minimal IFN-γ at 24 h) [20, 21].
These data position MAGE-A3 as an immunogenic module that reproducibly primes early activation and can skew memory, while pointing to concrete optimizations: (i) a dose-titration series (e.g., ~0.1–10 μg/mL equivalent, reported alongside nmol/mL) to map activation and memory set-points [17, 18]; (ii) HLA-typed, stratified cohorts and epitope mapping to resolve allele-linked responsiveness [17]; (iii) APC/co-stimulatory augmentation (e.g., DC-targeting, TLR/CD40 agonists, or IL-12/IL-2 support) to convert partial activation into a Th1-skewed signature and enhance HLA-DR/IFN-γ [20, 21]; and (iv) tumor co-culture and checkpoint-modulated assays (e.g., PD-1/PD-L1 axis) to model durability and function under immunosuppression [20, 21]. Other factors that should be considered for the observed result are donor age, sex, prior antigen exposure, and overall immune fitness, which may also have influenced the magnitude of the observed responses, although all donors were healthy adults within a narrow age range.
In summary, MAGE-A3 peptide stimulation reproducibly triggered early activation (CD69, CD25), modest proliferation, and selective IL-2/TNF-α secretion at 24 h, and in a subset of donors shifted memory composition toward TCM/TEM over two weeks. Read together with prior presentation and vaccine studies [18, 20, 21], these results position MAGE-A3 as a rational antigenic component within modular immunotherapy pipelines, particularly when paired with dendritic cell presentation or costimulatory augmentation, and to exploit the tumor-restricted expression of cancer-testis antigens while accommodating donor-level heterogeneity in human T-cell memory biology [8, 9, 17].
APC: antigen-presenting cell
CFSE: carboxyfluorescein succinimidyl ester
FMO: fluorescence-minus-one
GM-CSF: granulocyte-macrophage colony-stimulating factor
HLA-DR: human leukocyte antigen-DR isotype
IFN-γ: interferon-gamma
IL-2: interleukin-2
MAGE-A3: melanoma-associated antigen-A3
NC: negative control
PBMCs: peripheral blood mononuclear cells
PC: positive control
PIs: proliferation indices
TCM: central memory T cell
TEM: effector memory T cell
TNF-α: tumor necrosis factor-alpha
The supplementary figures for this article are available at: https://www.explorationpub.com/uploads/Article/file/1003231_sup_1.pdf. The Table S1 for this article is available at: https://www.explorationpub.com/uploads/Article/file/1003231_sup_2.xlsx. The Table S2 for this article is available at: https://www.explorationpub.com/uploads/Article/file/1003231_sup_3.xlsx. The Table S3 for this article is available at: https://www.explorationpub.com/uploads/Article/file/1003231_sup_4.xlsx.
The authors acknowledge the support of BioRadius Therapeutic Research Pvt. Ltd. for providing human PBMC samples and laboratory infrastructure. We also thank Amity Institute of Biotechnology, Amity University Mumbai, for research guidance and administrative support.
GT: Conceptualization, Methodology, Investigation, Formal analysis, Visualization, Writing—original draft. SM: Investigation, Data curation, Visualization, Writing—review & editing. AS: Methodology, Investigation, Validation, Writing—review & editing. SK: Methodology, Investigation, Validation, Writing—review & editing. AWSK: Resources, Methodology, Validation, Supervision, Writing—review & editing. SB: Resources, Validation, Supervision, Writing—review & editing. RS: Conceptualization, Methodology, Project administration, Supervision, Writing—review & editing. All authors read and approved the submitted version.
The authors declare that there are no conflicts of interest.
All PBMC samples used in this study were obtained from healthy adult donors through BioRadius Therapeutic Research Pvt. Ltd., Pune, India, under appropriate ethical oversight. And procedures followed institutional SOPs aligned with ethical standards compliant with the Declaration of Helsinki (2013).
Informed consent to participation in the study was obtained from the participant.
Not applicable.
All data generated or analyzed during this study are included in the Supplementary materials. Further datasets are available from the corresponding author upon reasonable request.
Not applicable.
© The Author(s) 2025.
Open Exploration maintains a neutral stance on jurisdictional claims in published institutional affiliations and maps. All opinions expressed in this article are the personal views of the author(s) and do not represent the stance of the editorial team or the publisher.
Copyright: © The Author(s) 2025. This is an Open Access article licensed under a Creative Commons Attribution 4.0 International License (https://creativecommons.org/licenses/by/4.0/), which permits unrestricted use, sharing, adaptation, distribution and reproduction in any medium or format, for any purpose, even commercially, as long as you give appropriate credit to the original author(s) and the source, provide a link to the Creative Commons license, and indicate if changes were made.

View: 1720
Download: 44
Times Cited: 0
