 Original Article

Affiliation:
1Laboratory for Food Safety, ANSES, 94701 Maisons-Alfort, France
2UMR 7182, ICMPE, CNRS, University Paris-Est Créteil, 94320 Thiais, France
ORCID: https://orcid.org/0000-0001-5583-8976
Affiliation:
3Direction of Regulated Products Evaluation, ANSES, 94701 Maisons-Alfort, France
ORCID: https://orcid.org/0000-0003-2445-6996
Affiliation:
3Direction of Regulated Products Evaluation, ANSES, 94701 Maisons-Alfort, France
Affiliation:
3Direction of Regulated Products Evaluation, ANSES, 94701 Maisons-Alfort, France
ORCID: https://orcid.org/0000-0002-5034-3795
Affiliation:
3Direction of Regulated Products Evaluation, ANSES, 94701 Maisons-Alfort, France
Affiliation:
3Direction of Regulated Products Evaluation, ANSES, 94701 Maisons-Alfort, France
ORCID: https://orcid.org/0009-0004-4076-5427
Affiliation:
2UMR 7182, ICMPE, CNRS, University Paris-Est Créteil, 94320 Thiais, France
ORCID: https://orcid.org/0000-0001-8358-9903
Affiliation:
1Laboratory for Food Safety, ANSES, 94701 Maisons-Alfort, France
Email: julien.parinet@anses.fr
ORCID: https://orcid.org/0000-0003-0119-0929
Explor Foods Foodomics. 2025;3:101086 DOI: https://doi.org/10.37349/eff.2025.101086
Received: January 07, 2025 Accepted: May 15, 2025 Published: June 24, 2025
Academic Editor: Zhaowei Zhang, Oil Crops Research Institute of the Chinese Academy of Agricultural Sciences, China
Aim: The present work aims to propose an alternative analytical protocol for assessing the thermal stability of plant protection products between 90°C and 240°C. In that view, this work seeks to identify any degradation products that may be overlooked during regulatory hydrolysis studies. Thus, we evaluate if a new regulatory approach is necessary and how this could be done by academic research. This requires working under similar conditions.
Methods: A comprehensive analytical workflow was designed and implemented for ten active substances to study and investigate their overall degradation behaviour and volatilisation. The results were then compared with those reported in the regulatory studies.
Results: The ratio of detected degradation products to active substances ranged from 0.5% to 50%. Volatilization products were identified for all compounds analyzed using TGA-GC-MS. This confirmed the pattern of degradation followed by volatilisation, except for tetraconazole, which volatilises before degradation. Some of the detected compounds were not reported at all in regulatory studies, or were detected at higher concentrations, such as IN-EQW78 and 500M07.
Conclusions: This study confirmed the feasibility of conducting thermodegradation studies without relying on radiolabelled substances. It also identified two overlooked products and emphasised the importance of conducting studies exceeding 120°C.
Plant protection products (PPPs) are used to protect crops against disease and infestation [1]. These PPPs are made of at least one active substance (AS), which can persist in small quantities within the raw agricultural commodity (RAC). Under regulation (EC) No. 1107/2009 [2], consumer exposure via ingestion is estimated for risk assessment by considering both the AS and its metabolites, degradation products (DPs), and reaction products (collectively referred to as “pesticide residue”) [3]. These break-down products occur either in food or in contaminated feed commodities through various different transformation pathways. Their identification and quantification are established according to a complex regulatory framework, from various datasets derived from field trials, controlled experiments on plants and livestock, monitoring studies, modelling estimations, and tests (storage, thermal transformation). These tests are mandatory before the AS is placed on the market. The DPs detected in these tests are described in the European assessment reports of ASs. Some DPs can also be formed during the thermal processing of contaminated food commodities [4]. In that respect, the required degradation studies involve hydrolysis studies, as outlined in OECD guideline No. 507 [5]. These studies cover the majority of relevant processes as follows: (i) pasteurisation (90°C, 30 min, pH 4), (ii) baking, brewing, boiling (100°C, 60 min, pH 5) and (iii) sterilisation (120°C, 20 min, pH 6). During these studies, buffer solutions containing pure compounds are used. According to the OECD guideline No. 507 [5], “the substrate itself is not likely to have a major effect upon the processing procedure (apart from governing the pH level in some situations) [5]. If this statement needs to be tested with new experimental evidence, there is no doubt that analysis on complex matrices appears as hazardous in the context of a first-step regulatory approach. Such a choice would raise tricky questions (such as to understand which matrix extraction protocol guarantees a minimum efficiency), which cannot be easily solved within a systematic framework. These hydrolysis studies play a crucial role in understanding the fate of AS and potential DPs. Moreover, these hydrolysis studies are performed using radiolabelled molecules (most often 14C standards) to mitigate possible cross-contamination from the environment as well as to increase the sensitivity, identification, and quantification of the AS itself and its DPs. Every DP detected above 10% of the total radioactive residue (TRR) is characterised and reported in regulatory studies. While most thermal processes fall within these specified conditions, other heating methods—such as conventional or microwave ovens, grilling, or frying—can reach temperatures exceeding 120°C. OECD guideline 507 [5] highlighted that it would be impossible to conduct a processing study using radiolabelled chemicals in a manner that accurately reflects industrial or domestic practices. Likewise, it would not be readily practicable and yet expensive to process samples with incurred radiolabelled residues from the nature of the residue studies in plants or livestock. In addition, OECD guideline 507 [5] addresses this issue with the example of the deodorisation process during oil refining and states that “the necessity for these studies should be discussed on a case-by-case basis with regulatory authorities”. These studies are rarely required and provided by manufacturers during (re) evaluation of the AS. Therefore, it is relevant to investigate potential new DPs when the temperature exceeds 120°C. A recent review [6] aimed to compare research and regulatory studies conducted both below and above 120°C. The objective was to determine whether some DPs might be overlooked by regulatory studies that limit their investigation to temperatures up to 120°C. This study underscores the importance of considering elevated temperatures when assessing pesticide residues and the potential formation of novel DPs. Recent research has shown that new DPs can form when heating above 120°C. These compounds may result either from the degradation of the AS, even when also detected in raw matrices [7], or from reactions between the AS and the matrix (e.g., oil) [8]. However, there remains a significant gap in studies involving spiked buffer solutions heated above 120°C. This lack of data currently prevents definitive conclusions about whether some DPs might be overlooked under existing European regulations. Further investigation is needed to fill this knowledge gap and improve our understanding of potentially overlooked DPs. As highlighted in the review by Dubocq et al. [6], recent advancements in analytical techniques have enabled the characterization and quantification of breakdown products without the use of radiolabelled compounds. Given the limitations associated with radiolabelled molecules—such as high cost, complex handling requirements, and the need for specialized accreditation—most studies rely on native compounds for degradation testing. Additionally, while many of these studies focus on processing factors, there is growing concern about identifying specific DPs [9]. Therefore, the development of a robust analytical workflow tailored to studies using native compounds is crucial for advancing our understanding of pesticide fate in cooked food. The aim of this work is thus to develop a novel and comprehensive workflow to detect and attempt to identify DPs and volatilisation products (VPs) from ASs below and over 120°C using native compounds. In addition, studying the volatilisation part could shed light on the AS’s overall behaviour and identify some of the DPs that would volatilise when the temperature is raised. It could also highlight contamination for the cooking person from breathing the air containing AS and/or its DPs. Cooking studies were conducted using conventional and microwave ovens at various temperatures and times to study the impact of these conditions on the formation of DPs. These tests were conducted using pure native compounds diluted in solvent, following standard practices in regulatory studies. Analyses were carried out using liquid chromatography coupled with high-resolution mass spectrometry (LC-HRMS). Data processing included both suspect screening analysis (SSA) and non-target analysis (NTA), enabling the exploration of known and unknown DPs. The use of HRMS in this study provides a comprehensive chemical profile of the samples, thereby improving the detection and identification of formed DPs. Volatilisation studies were performed using thermogravimetric analysis (TGA) alone and coupled with GC-MS (TGA, TGA-GC-MS) and differential scanning calorimetry (DSC). This determined the melting, volatilisation, and decomposition temperatures and was also used to tentatively identify possible VPs. Combining state-of-the-science analytical tools is a key to determine both DPs and VPs (rarely investigated) resulting from ASs, to increase knowledge about overall exposure and to better evaluate risk assessment. This workflow was tested for ten ASs to estimate whether novel DPs discovered at temperatures over 120°C could have been overlooked because they were not observed below 120°C.
A total of 1,478 ASs are listed in the EU Pesticide Database [EUPD, (European Commission)]. As it is not feasible to perform cooking studies on each substance, a priority list of 24 substances was investigated [10]. All 24 compounds were purchased from Dr. Ehrenstorfer (LGC Labor GmbH, Augsburg, Germany). Information about CAS number, name, formula, melting, volatilisation, and decomposition temperatures is available in Table S1. About 10 mg of the AS was dissolved in 10 mL of acetonitrile, except for chlorantraniliprole, for which an additional volume of 4 mL of acetone was added to improve its solubility (later mentioned as standard solution). A mixture of the 24 molecules at a final concentration of about 100 µg/L (later mentioned as “Mix24”) was prepared in an LC amber vial and injected into a UHPLC-MS instrument to study their intensity. Following injection of the “Mix24” into the UHPLC-MS system, the ten molecules with the highest intensity (azoxystrobin, boscalid, chlorantraniliprole, difenoconazole, fenhexamid, fenoxaprop-P, fluxapyroxad, hexythiazox, pyraclostrobin, and tetraconazole) were selected to perform degradation and volatilisation studies. Accurate concentrations for these ten molecules in the “Mix24” are available in Table S2.
Some tentatively identified DPs were also purchased for confirmation when available, such as CGA-205374, AE F054014, PT-1-3, 500M07 and 500M04 from Dr. Ehrenstorfer (LGC Labor GmbH, Augsburg, Germany), IN-F6L99 from Toronto Research Chemicals (North York, ON, CA), IN-EQW78 and AE F040356 from Benchchem (Austin, TX, USA) and AE F096918 from Merk (Darmstadt, Germany). Information is available in Table S1.
HPLC-MS-grade acetonitrile (ACN), HPLC-grade hexane, HPLC-grade acetone, and formic acid (FA) were obtained from Thermo Fisher Scientific (Illkirch, France). Ultrapure water (18.2 MΩ·cm) for sample and mobile phase preparation was obtained through a Millipak 40 Gamma Gold Filter (pore size 0.22 μm) using a Milli-Q Ultrapure and Pure water system purchased from Merck Millipore (Saint-Quentin-en-Yvelines, France). Positive and negative calibration solutions were purchased from AB Sciex Technology (Framingham, MA, USA).
A conventional oven (Brandt FC217MS, France), a microwave oven (Samsung MS23K3515AK, Frequency 2400 Hz and total power 1,150 Watt, South Korea), a deep-fryer (Kenwood DF 280, Japan), and a fan (Rowenta VU5840, Germany) were purchased from Darty pro (Bondy, France). Temperatures were monitored using an infrared thermometer FZ500 from JRI (Paris, France). Amber vials of 16 mL were purchased from Thermo Fisher Scientific (Illkirch, France).
Degradation studies were performed to check the behaviour of analytes under various thermal conditions. These tests were conducted by heating spiked solvent in an oven or microwave. Other tests were conducted on spiked sunflower oil to study the impact of the matrix when frying the oil.
Oven tests were conducted after pouring 50 µL of the standard solution into a 16 mL amber flask. Pierced aluminium foil was placed over the top of the flask to limit cross-contamination between flasks while not hindering possible volatilisation of the AS or its DPs. The oven was cleaned with a mixture of hexane: acetone 1:1 between each test. Once the rinsing solvent had evaporated, the oven was pre-heated for 30 min. The ten molecules were tested individually at 90, 120, 150, 180, 210, and 240°C for 30 min in each experiment, and for 5, 10, 15, 20, and 30 min at a single and constant temperature of 240°C. For each test, a blank flask was added to the oven to confirm there was no contamination during the heating process. The lowest temperature was 90°C to compare the method developed in this study (using 12C compounds) with the one currently used in regulatory hydrolysis studies (with 14C compounds) and confirm that the same DPs are detected between 90°C and 120°C for both methods. All the remaining percentages of chromatographic peaks for each temperature and time are reported in the supplementary materials (Table S7). They were reported as a ratio value (R) calculated by dividing the chromatographic peak area of the cooked AS/DP with the one of the NC AS. To calculate this ratio, a standard solution containing the “Mix24” was injected at the beginning and at the end of each analytical batch to check the good performance of the analytical instrument.
Moreover, triplicate samples were exposed to 150°C and 240°C for 30 min, in both cases, to study the repeatability of the sample preparation and analytical method. The temperatures for each test were monitored on the surface of a flask and are reported in Table S3. Following the thermal tests, all the acetonitrile added at the beginning had evaporated, so an extra 10 mL of acetonitrile was added to the flask, and by diluting by a factor of 50, a final concentration of 100 µg/L was reached in an amber vial for LC injection.
During injections, the chromatographic peak area for the target analyte (either AS or degradation product) was compared for each time and temperature condition as described in Degradation pattern. A drop in the LC chromatographic signal for the analysed substance when the temperature was increased or the time extended highlighted a degradation or volatilisation of the studied compound. From henceforth, the manuscript will mention three specific temperatures as (i) T1: the temperature at which the LC signal did not drop, (ii) T2: the temperature at which the drop in LC signal was observed and (iii) T3: the temperature at which the LC signal stabilised again or was no longer observed (background noise).
Microwave tests were conducted by adding a 50 µL volume of the standard solution to a 16 mL amber flask with 50 µL of Milli-Q water. A screw lid specific to the flask was placed on top of the flask to limit cross contamination between flasks without actually sealing the flask so as not to interfere with possible volatilisation of the analysed substances. The microwave oven was cleaned with a mixture of hexane: acetone 1:1 between tests, and we waited for the solvent to evaporate. Degradation studies were performed for 1, 2, 3, 4, and 5 min at 800 W, in two separate runs of five substances each (by alphabetical order). Temperatures were recorded for each time and each run on the surface of a flask at the end of each test and are reported in Table S4. Blank tests were conducted at 800 W and for a cooking time of 3 min to confirm the absence of contamination for all molecules. Following thermal tests, 10 mL of acetonitrile was added to the flask, and further dilution with acetonitrile was conducted to reach a final concentration of 100 µg/L in an amber vial for LC injection. Following injection, each (semi-)quantified concentration ratio (R) was reported in Table S7 dividing the chromatographic peak area of the experimental conditions by that of the non-cooked (NC) standard injection.
Frying tests were conducted by spiking 5 mL of sunflower oil purchased on a local market with 50 μL of the standard solution in a 16 mL amber flask, waiting at least one hour, and then frying for 15 min at 190°C. The stability of the molecules in oil during this period of time was presumed since low temperature (room temperature) and a short period of time. Unlike oven and microwave tests conducted on spiked acetonitrile, this study required a sample preparation step to mitigate matrix effects from oil.
In this case, a dilute and shoot method (consisting of a simple dilution before chemical analysis) was conducted as follows: 200 µL of processed oil and 1.8 mL of ACN were sampled in a 50 mL PTFE tube (VWR, Radnor, PA, USA). The mixture was vortexed for 2 min and filtered through a 0.22 µm PTFE filter (UCT, Bristol, PA, USA). Finally, 150 µL of the filtrate was added with 1.35 mL of ACN in an amber vial for injection. This dilute and shoot method was adapted from von Eyken and colleagues [11], developed for honey (another complex matrix) with the aim to demonstrate it is also working for oil analysis. The method is used for the first time on oil samples. To verify the adequacy of the method, recovery tests were conducted on 100 µg/L spiked oil. Recovery tests were performed by spiking the mix containing the ten analysed molecules in fried and non-fried oil and conducting the dilute and shoot method. Comparison was performed between the chromatographic peak area for the standard injection and the injection following the dilute and shoot method. To mitigate bias during semi-quantification due to instrument variability over days, a standard injection was performed at the beginning and the end of each analytical batch. Tests were performed both on fried oil (heating using the cooking process) and non-fried oil to confirm that frying oil does not have a critical effect on the recoveries. These tests confirmed the suitability of the sample preparation method since recoveries were between 85% and 128% for the non-fried oil and between 85% and 110% for the fried oil for all ten molecules, using both positive and negative ionisations (Figure S1).
Regulatory studies are conducted on radiolabelled substances in a closed system where the desired goal is the identification and characterisation of at least 90% of the remaining TRR. In standard OECD 507 studies, volatilisation components are only investigated when recoveries are below 90%. In contrast, this study aims to be more representative of everyday life cooking methods and could shed light on the overall behaviour of each AS in addition to identifying some of the DPs volatilised when the temperature is increased. Various methods were thus developed to estimate the possible volatilisation of the AS and tentatively identify the VPs.
The TGA was conducted with a LabSys evo instrument (Radaco, Casablanca, Morocco). About 5 mg of the pure substance was weighed out into a ceramic crucible. Isothermal analysis was conducted for 30 min (to mimic oven tests) at three different temperatures consecutively (T1, T2, and T3) within the same run. Tests were conducted under an argon atmosphere (Argon 4.5, Linde, Dublin, Ireland) at 1.6 bar to limit oxidation under an oxygen flow at high temperatures. This enabled us to study only the impact of the temperature on AS volatilisation.
DSC was conducted on a TA DSC 250 instrument (Waters Corporation, Milford, USA). About 5 mg of the pure substance was weighed into a non-sealed DSC aluminium crucible to mimic the possible volatilisation of substances when cooking. A temperature ramp was applied from 20°C to 300°C at 20°C/min. The main investigations were conducted on endothermic and exothermic peaks to check whether any of them could explain the drop in the LC area chromatographic signal. Data were processed using Trios software version 5.0 (Waters Corporation, Milford, USA).
The TGA-GC-MS experiments were conducted on a TGA 8,000 coupled with a GC Clarus 680 and a Clarus SQ 8T single quadrupole instrument (PerkinElmer, Wellesley, MA, USA). Data were processed with Pyris Series software version 13.4 for TGA data and TurboMass version 6.1.2 for GC data (PerkinElmer, Wellesley, MA, USA). Experimental mass spectra were compared with the National Institute of Standards and Technology database version 23 (NIST, Gaithersburg, MD, USA). TGA was conducted between 30 and 415°C at 20°C/min under a helium flow (Helium 6.0 Alphagaz 2, Air Liquide, Paris, France) so as to be in the same atmosphere as the GC instrument and limit oxidation, which occurs with an oxygen flow at high temperatures. This enabled us to study only the impact of the temperature on AS volatilisation. The aim of these TGA-GC-MS experiments was to determine the temperature of volatilisation of the studied substances as well as to tentatively identify VPs. Analysing volatilisation of the AS up to 415°C (above the 240°C used for the degradation studies) would provide a basis for estimating the behaviour of the molecule at higher temperatures for further studies investigating degradation above 240°C.
GC analysis was started during the maximum weight loss rate (verified with the weight loss curve derivative). A GC loop was filled over 20 seconds before being injected into the GC instrument. The temperature of the oven started at 60°C for 2 min, was gradually increased to 280°C at 15°C/min, and was then maintained at 280°C for 2.33 min. Analysed mass range was between m/z 30 and m/z 500. The inlet temperature, TGA-GC transfer line, GC-MS transfer line, and MS source temperatures were set at 250°C, 250°C, 300°C, and 250°C, respectively. The helium flow was set at 2 mL/min in the GC part.
Chemical analysis was conducted using a UHPLC-QToF system (TripleToF 5,600 System, Thermo Fisher Scientific, Waltham, USA, for the LC system and TripleToF 5,600™, AB Sciex, Darmstadt, Germany for the mass spectrometer) using an Aqua® C18 column (L 150 mm × ID 2 mm, particles of 3 µm). Ionisation was conducted using electrospray (ESI) mode, both in positive and negative polarity. Data were acquired using Analyst software version 1.7.1 (AB Sciex, Darmstadt, Germany). All the information regarding LC and MS parameters is available in Table S5.
The LC system was tuned and calibrated manually using APCI-positive and -negative calibration solutions in MS (recommended calibration solution for both APCI and ESI ionisation modes) and high-sensitivity MS/MS modes before each batch. Automatic calibration was also scheduled during the batch every five samples using the automated calibration device system (CDS), and data were acquired using Analyst software (version 1.7) from AB Sciex. Each analytical batch started and ended with a “Mix24” injection to check for retention times and intensities. Confirmation criteria were set at 10 parts-per-million (ppm) for the mass and 0.25 min for the retention time. Fragmentation spectrum (MSMS) was also used as confirmation criteria. Moreover, batch injections were randomised to mitigate bias between injections. Acetonitrile was injected every five injections to confirm the lack of memory effect between samples.
LC data were processed using MasterView software version 2.2 (AB Sciex technology, Framingham, MA, USA). An initial suspect list was created by listing all the DPs reported in the regulatory studies (Table S6). This list was built up both with DPs detected following regulatory hydrolysis studies and DPs detected with other processes (environmental and biotic degradation). Compound detection was supported by the molecule’s m/z, and identification was supported by adding the isotopic pattern and at least two fragment ions from the MS/MS spectra. When available, the appropriate standard was used to confirm criteria and retention time (Table S13).
Data obtained from the LC instrument were converted to mzML format with a peak-picking filter (Vendor algorithm, MS Levels: 1-) using MSConvert GUI (64-bit) software version 3.0.21193 (Proteowizard, Palo Alto, CA, USA). Converted data were processed using MS-Dial version 4.70 (RIKEN Center for Sustainable Resource Science, Japan). Aligned data were investigated for (i) peaks detected in processed samples but not in the blank and (ii) peaks with the highest fold change (i.e., the greatest ratio in intensity between samples, determined with the p-value). An intensity that decreases as temperature and time increase highlights the degradation or volatilisation of the AS, while an intensity that increases highlights the formation of a possible DP.
Molecular networking was also conducted via MSDIAL software with the help of the global natural product social (GNPS) molecular networking site [12] to study the correlation between the analysed substance and its DPs. All the molecular networks are available in the Table S11–S12 for the ten analysed ASs.
Tentatively identified DPs and VPs are reported with an identification confidence level (ICL) ranging from one to five according to [13].
Level 1 (confirmed structure) is the highest ICL because an authentic standard is available, whereas level 5 (exact mass of interest) indicates the lowest ICL with only the accurate m/z available. Level 4 (unequivocal molecular formula) is selected when not enough product ions are detected to determine the final structure of the molecule. Level 3 [tentative candidate(s)] is a selection of possible isomers, and level 2 (probable structure) is the confirmation of a formula using either a library spectrum match (2a) or diagnostic evidence (2b).
To detect and identify DPs and VPs from an AS following cooking studies, it is necessary to develop a comprehensive workflow that considers each different possible scenario. Six scenarios are proposed herein, going from molecular stability ① to partial degradation ② or partial volatilisation ③ of the AS, to total degradation ④ or total volatilisation ⑤ of the AS, and both degradation and volatilisation ⑥ of the AS (Table 1). Table S7 summarises all the degradation and volatilisation parameters considered for the different scenarios. Each AS investigated is included in one of these scenarios when heated between 90 and 240°C. It is thus important in future studies to report the temperature range since the association between the AS and the scenario can vary with temperature.
Volatilisation and degradation parameters for each scenario
| Scenario | Volatilisation study (TGA) | Detection of volatilisation products in TGA-GC-MS? | Degradation study (LC/GC-HRMS) | Detection of degradation products in LC/GC-HRMS? |
|---|---|---|---|---|
| ① | Weight loss < 10% | No | Decreasing chromatographic intensity < 10% | No |
| ② | Weight loss < 10% | No | Decreasing chromatographic intensity > 10% and < 90% | Yes |
| ③ | Weight loss > 10% and < 90% | Only AS | Decreasing chromatographic intensity > 10% and < 90% | No |
| ④ | Weight loss < 10% | No | Decreasing chromatographic intensity > 90% | Yes |
| ⑤ | Weight loss > 90% | Only AS | Decreasing chromatographic intensity > 90% | No |
| ⑥ | Weight loss > 10% and < 90% | Degradation products and possibly AS | Decreasing chromatographic intensity > 10% | Yes |
AS: active substance; GC: gas chromatography; HRMS: high-resolution mass spectrometry; LC: liquid chromatography; TGA: thermogravimetric analysis
Two different workflows are proposed for determining DPs and VPs, represented by two flowcharts. The first one (Figure 1) is a complete, comprehensive workflow starting with the detection and tentative identification of DPs, followed by the identification, when necessary, of VPs. However, state-of-the-science analytical methods involving HRMS are expensive, and thus this study also proposes an alternative workflow starting with volatilisation studies (Figure 2). Determining the VPs first is a primary cost-efficient screening method. If the VPs detected differ from the AS, it can be assumed that they are DPs of the AS. Thus, these could be investigated as degradation using mass-spectrometry. Moreover, even if this study was conducted using LC-HRMS, the same experiments could be conducted using GC-HRMS when available, which would give more information about non-polar DPs, which are more difficult to analyse using LC. The overall workflow was conducted on pure substances to answer as best as possible the regulatory problematics assessed by the OECD guideline No. 507 [5], also conducted on pure compounds. This study is also one of the first investigating the behaviour of ASs as such temperatures and to propose overall workflow to detect and identify DPs. Thus, this first step study is necessary and could be used as a reference in future to study to investigate the behaviour of the substance in food commodities.
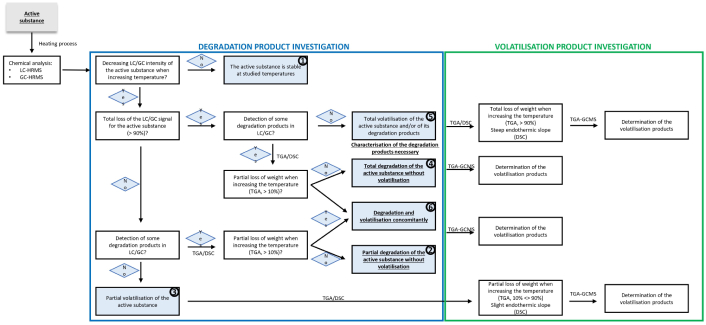
Comprehensive flowchart for determining degradation and volatilisation products from an active substance following thermodegradation processes. DP: degradation product; DSC: differential scanning calorimetry; GC: gas chromatography; HRMS: high-resolution mass spectrometry; LC: liquid chromatography; TGA: thermogravimetric analysis
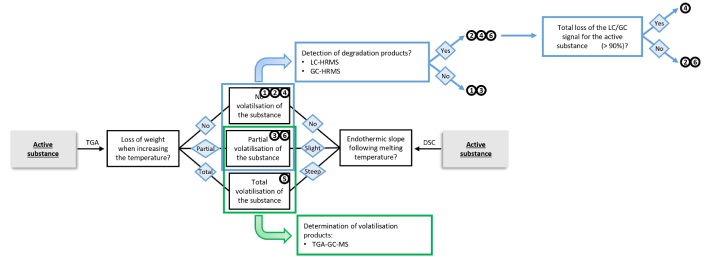
Alternative cost-efficient flowchart for determining volatilisation and degradation products from an active substance following thermodegradation processes. DP: degradation product; DSC: differential scanning calorimetry; GC: gas chromatography; HRMS: high-resolution mass spectrometry; LC: liquid chromatography; TGA: thermogravimetric analysis
The volatilisation studies in this research project provided information on the overall evaporation capacity of the AS and its DPs. DSC studies could be conducted on all solid ASs (with the exception of tetraconazole) to confirm that the endothermic peak corresponding to the AS’s melting point (Table S9) lies at a temperature close to that reported in the literature. All experiment-based melting temperatures are close to those reported in the regulatory reports, except for fenoxaprop-P. This difference can be explained by the fact that tests conducted during regulatory studies are performed on fenoxaprop-P-ethyl, while this study focused on fenoxaprop-P. Moreover, the endothermic slope observed following the melting point corresponds to the volatilisation of the AS or its DPs. Only hexythiazox and fenhexamid had a steep endothermic slope after the melting temperature and up to 240°C, which illustrates their high volatilisation. The endothermic peak of some other compounds, such as azoxystrobin, boscalid, chlorantraniliprole, difenoconazole, and fenoxaprop-P, starts around 240°C or above. This also confirms the AS’s volatilisation, but outside the temperature range studied in this project. It could, however, still be relevant information for further studies designed to investigate other thermodegradation behaviours at higher temperatures. Pyraclostrobin is the only AS with a steep exothermic slope following the melting point (between 180°C and 260°C) that reflects a presumed chemical reaction that cannot be explained only using DSC.
TGA also confirmed volatilisation of the compound within the same temperature range as the DSC (available in the Table S8). It was determined that volatilisation patterns are similar (considering volatilisation temperatures and percentages of AS loss) whether the AS is heated at the same temperature for 30 min or heated at 20°C/min. However, this volatilisation pattern occurs around 20°C earlier when heating the compound for 30 min, most probably because extended heating promotes volatilisation. These volatilisation conditions at atmospheric pressure and under a gas flow are representative of home cooking processes.
TGA coupled with GC-MS was also used to detect and tentatively identify various VPs. The experimental mass spectrum was compared with the NIST library for identification purposes. Confirmation using NIST Library was performed if the match and reverse match scores were over 800. Since AS degradation and VP mass spectra are not always reported in the library, the structure proposed by the library did not always match the AS structure. In these cases, the formulas proposed by the library and reported in the GC-MS spectra in the SM were slightly adjusted to match the AS’s overall structure. When the structure by the NIST library matched the structure of the AS, it enabled reaching the Level 2 in identification confidence, and it was Level 3 otherwise. Apart from chlorantraniliprole, which could not be analysed by TGA-GC-MS (due to recrystallisation in the transfer line, making GC-MS analysis impossible), reported VPs are available in Table S10.
In this study, only tetraconazole was detected in the gas phase without detecting any VPs. This confirmed that tetraconazole did not degrade and only volatilised in the gas phase starting around 150°C. Other ASs, such as fenhexamid and pyraclostrobin, were also detected in the gas phase, even though various tentatively identified DPs were also detected. Four compounds other than the AS were tentatively identified for fenhexamid, none of them having been reported in regulatory hydrolysis studies. Ten VPs were detected for pyraclostrobin, including 500M49 and MMP reported in regulatory studies, but in residue sections other than hydrolysis (in plants, livestock, humans, animals, or during storage). This AS could not be detected in the gas phase, but various compounds assumed to be its DPs were reported in the GC-MS chromatograms (Table S10). Five VPs were detected for azoxystrobin, six for boscalid, eleven for difenoconazole, four for fenoxaprop-P, two for fluxapyroxad, five for hexythiazox, and ten for pyraclostrobin. Some of the identified compounds were reported in the assessment report as DPs and thus included in the initial suspect list in Table S6. This was the case for M18 (reported for azoxystrobin), M510F52 (for boscalid), CGA71019 (for difenoconazole), AE F054014 (for fenoxaprop-P) and PT-1-3 (for hexythiazox). Only AE F054014 and PT-1-3 were reported in the hydrolysis section of the ASs; the other compounds were reported in other sections of the regulatory studies. The compounds that were reported as DPs in the regulatory studies and detected as VPs in this study confirm the pattern of degradation followed by volatilisation for most of the analysed compounds. However, it was not possible to estimate whether these compounds are formed over 10% of the initial AS concentration (the regulatory studies’ threshold for characterisation and reporting) due to a lack of quantification, so no clear conclusion could be drawn about the possibility that these compounds could be overlooked in regulatory studies. One limitation in this study was the impossibility of conducting GC-HRMS studies to quantify non-polar compounds, so future studies could fill this gap by estimating the percentage of DPs that can only be detected using GC. Every compound reported in the GC-MS was added to the initial suspect list (Table S6) to investigate their presence in the following degradation studies.
For each degradation study, Table S7 reports the DP ratio detected using LC for each temperature and each time compared with the NC AS. Heating in a conventional oven was determined to be the method that decreased the most chromatographic peak intensities, leading to most of the ASs not being detected (or at a really low percentage of the initial intensity) at 240°C (Table 2). Both temperature and time significantly decrease peak intensities, thus revealing that DPs and VPs continue to be formed as time and temperature increase. The same observation was established concerning the formation of DPs, which continues until some of them are either degraded again or are volatilised when the temperature is increased. On the other hand, the microwave oven did not decrease AS intensities as much as the conventional oven. This was expected, since this method was determined not to provide enough energy to break chemical bonds [14], and the temperatures reached are not high enough and for long enough to lead to volatilisation. Using fold changes and molecular networking (Table S11) were highlighted the formation of DPs for seven out of the ten ASs. Table S7 compiles all detected DPs and VPs. All the DPs were detected in the conventional oven study except chlorantraniliprole DP8, which was only detected in the microwave oven study.
Summary of detected degradation products for the 10 AS
| Active substance | Degradation product number | Detection | Formula | Molecular weight (g/mol) | Retention time (min) | Identification | ICL | (Semi)- Quantification (ESI+/ESI-) | Ratio DL50 rat oral |
|---|---|---|---|---|---|---|---|---|---|
| Azoxystrobin | - | ||||||||
| Boscalid | 1 | Oven | C18H13ClN2O2 | 324.0666 | 5.72 | c | 3 | 0.7%/9.2%** | 439.2%† |
| Chlorantraniliprole | 12345678 | OvenOven/MicrowaveOvenOvenOvenOven/MicrowaveOvenMicrowave | C5H6BrN3OC18H12BrCl2N5OC17H10BrClN4O3C18H13BrClN5O2C17H9BrCl2N4O2C17H11BrCl2N4O3C18H14Cl3N5O2C13H9ClN2O2 | 202.9694462.9602431.9625444.9941449.9286467.9392437.0213260.0353 | 2.217.415.144.897.845.755.596.23 | IN-F6L99aIN-EQW78acIN-LBA22bcIN-GKQ52bcc | 11333333 | 32.7%/33.0%*20.3%/ND*0.5%/4.5%**0.8%/3.4%**0.2%/ND**0.4%/11.2%**1.4%/3.5%**ND/0.4%** | 40.2%††16.1%†72.0%†13.6%†85.5%†47.5%††41.4%†17.0%†† |
| Difenoconazole | 1 | Oven | C16H11Cl2N3O2 | 347.0228 | 6.32 | CGA205374b | 1 | 0.7%/1.0%* | 32.3%† |
| Fenhexamid | - | ||||||||
| Fenoxaprop-P | 12345 | OvenOvenOven/Deep-fryerOvenOven | C15H10ClNO3C13H8ClNO3C7H4ClNO2C15H10ClNO4C9H10O4 | 287.0349261.0193168.9931303.0298182.0579 | 7.766.074.206.982.39 | cAE F040356bAE F054014bcAE F096918b | 31131 | 0.3%/ND**5.1%/4.8%*7.0%/8.0%*0.9%/ND**ND/4.7%* | 82.4%†123.2%†37.6%†63.0%†47.9%† |
| Fluxapyroxad | 1 | Oven | C18H12F3N3O2 | 359.0882 | 6.62 | c | 3 | 0.7%/5.1%** | 95.8%†† |
| Hexythiazox | 1 | Oven/deep-fryer | C10H10ClNOS | 227.0172 | 5.39 | PT-1-3a | 1 | 50.4%* | 86.5%†† |
| Pyraclostrobin | 12345 | Oven/deep-fryer Oven/deep-fryerOven/deep-fryer OvenOven | C19H18ClN3O4C18H16ClN3O3C19H18ClN3O4C19H26Cl2N4O5C9H7ClN2O | 387.0986357.0880387.0986460.1280194.0247 | 6.717.236.998.784.61 | 500M54b500M07b500M54bc500M04a | 31341 | 1.4%/ND**14.8%/ND*0.5%/ND**0.5%/ND**1.0%/ND* | 277.3%††255.9%††289.7%††-193.1%†† |
| Tetraconazole | - |
-: no degradation product, a: reported in the hydrolysis section of the regulatory report, b: reported in regulatory report in other sections that hydrolysis section, c: not reported in the regulatory report, ICL: identification confidence level according to Schymanski scale, *: quantified using standard, **: semi-quantified, ND: Not detected, †: estimated using “hierarchical clustering” method and ††: estimated using the “nearest neighbor” method. AS: active substance; ESI: electrospray
The regulatory studies reported compounds detected at a level higher than 10% of the TRR between 90 and 120°C (Table S6).
For the ten ASs studied in the hydrolysis section, IN-F6L99 (DP1) and IN-EQW78 (DP2) were reported to be DPs of chlorantraniliprole, PT-1-3 of hexythiazox (DP1) and both 500M07 (DP2) and 500M04 (DP5) of pyraclostrobin. The detection and identification of these compounds in the present study confirmed the relevance of the overall workflow without using radiolabelled molecules. Other DPs detected in this study have already been reported in the regulatory studies, but in sections other than hydrolysis. This was the case for IN-LBA22 (DP4) and IN-GKQ52 (DP6) for chlorantraniliprole, CGA205374 (DP1) for difenoconazole and AE F040356 (DP2), AE F054014 (DP3) and AE F096918 (DP5) for fenoxaprop-P.
Some other DPs, reported as boscalid DP1, chlorantraniliprole DP3, DP5, DP7, and DP8, fenoxaprop-P DP1 and DP4, fluxapyroxad DP1 and pyraclostrobin DP1, DP3, and DP4, were detected and tentatively identified in this study, although they had not been reported in the relevant regulatory studies. Since most of the ASs have chlorine atoms, some chlorine atoms are release with temperature and react with other DPs. This explains why some DPs have more chlorine atoms than the initial ASs.
Pyraclostrobin is the only AS with isomerisation products (DP1 and DP3), which means compounds that have the same formula as the AS but not the same chemical structure. This isomerisation step could be one explanation of the exothermic peak detected in the DSC. The low intensity of these compounds and the lack of standards available for purchase make identification difficult. However, an isomerisation product named 500M54 was reported in the pyraclostrobin regulatory study. It has an O–CH3 group on an aromatic ring, but the placement of this group (ortho, meta, or para) is not well defined. Since both isomerisation products have really close fragmentation spectra together with a similar retention time, it is expected that both are 500M54 with the O–CH3 being at two different locations in the aromatic ring. This hypothesis is consolidated by the loss of m/z 32.0262, corresponding to CH3OH in the fragmentation spectra of both isomers, which is not present in the pyraclostrobin fragmentation spectra. In the microwave studies, DPs were detected from only three ASs since DP2, DP6 and DP8 for chlorantraniliprole, DP3 and DP5 for fenoxaprop-P and DP1 for hexythiazox were detected. The main hypothesis about this cooking method is that it degrades only ASs that are less stable in response to increasing temperature and only require low energy can be broken down. The concentrations of DPs found in the microwave studies were quite low, none of them being detected above 10% of the initial AS concentration.
All the DPs that had a standard able to be purchased could be identified by comparing this standard with the processed sample as regards m/z, retention time, isotopic pattern, and fragmentation pattern. Two of them (IN-F6L99 and AE F040356) were confirmed using both ionisation methods, five of them (IN-EQW78, CGA205374, PT-1-3, 500M07, and 500M04) were confirmed using positive electrospray ionisation, and the last two compounds (AE F054014 and AE F096918) were confirmed using negative electrospray ionisation. Quantification could also be based on a comparison between the chromatographic peak area of the samples and those from the calibration curve built with the standard. Four compounds (IN-F6L99, IN-EQW78, PT-1-3 and 500M07) could be quantified as being over 10% of their respective ASs.
IN-F6L99 and PT-1-3 had already been reported as being detected at a level over 10% in their respective hydrolysis studies [15, 16].
However, IN-EQW78 was detected at a maximum percentage of 3.5% in regulatory studies [16] and up to 20.3% in this study, which shows that concentrations increase when tests are conducted over 120°C. The last compound (500M07) was not reported in studies up to 120°C but was in deodorisation tests of pyraclostrobin between 190°C and 240°C [17]. The identification of this compound up to 14.8% at 210°C in this study also demonstrates that new DPs can be detected when studies are conducted at temperatures over the one studied in regulatory studies.
Compounds that do not have a standard available for purchase were tentatively identified with an ICL of 3, except for pyraclostrobin DP4, which did not have an MS/MS spectrum available. Semi-quantification was conducted on DPs following the method published by Liigand et al. [18], developed to estimate the concentration of analytes using NTA without having the relevant standard available – an in silico approach.
Both quantification and semi-quantification were applied to areas of the transformation products. Table S7 reports the ratio (R) in concentration between the DP concentrations (semi-)quantified in the samples and the initial concentration of the AS for both cooking methods. A conversion was also performed to estimate the TRR by multiplying concentration percentages by the ratio between the AS’s molar mass and the degradation product’s molar mass (a percentage described as “converted maximum TRR ratio” in Table S7).
Calculating the radioactivity ratio makes the direct comparison with the one provided in the regulatory studies possible. Conclusions from this study and from the regulation studies are the same, with the exception of one DP, reported as AE F054014, whose radioactivity percentage was below 10% in the regulation report while being above 10% in this study. This DP thus merits further investigation since it was not reported in the hydrolysis section of the regulatory studies on fenoxaprop-P.
The percentage of ratio concentration variabilities among semi-quantified compounds, depending on whether positive or negative ionisation is used, shows the need to use standards to obtain accurate concentrations, but the developed method proved to be acceptable when a standard is unavailable. This confirms the need to market tentatively identified compounds so that their detection percentages can be estimated more accurately and be compared with the 10% threshold value established by European regulations. Without a standard, it is not possible to draw a conclusion as to whether these DPs are being overlooked by regulatory hydrolysis studies.
In keeping with the degradation and volatilisation studies carried out between 90 and 240°C, the ten ASs analysed were classified into the following scenarios:
- Scenario ①: none of the ASs
- Scenario ②: azoxystrobin, fenoxaprop-P
- Scenario ③: none of the ASs
- Scenario ④: boscalid, difenoconazole, fluxapyroxad
- Scenario ⑤: tetraconazole
- Scenario ⑥: chlorantraniliprole, fenhexamid, hexythiazox, pyraclostrobin
The parameters considered for each scenario, as well as both flowcharts, have been tailored to classify an AS depending on its volatilisation and/or degradation. Here we considered at the same time both DP products from regulatory assessment reports and VPs from TGA-GC-MS.
Except tetraconazole, which volatilises before degradation, all the ASs analysed appear to follow the same pattern of degradation followed by volatilisation. This pattern is illustrated in the Table S7 through the intensities of ASs and DPs. The intensity of most of the DPs increases with temperature up to the maximum intensity and then decreases. This was the case for chlorantraniliprole DP1, DP2, DP4, DP5, DP6 and DP7, difenoconazole DP1, fenoxaprop-P DP3 and DP5, hexythiazox DP1 and pyraclostrobin DP1, DP2, DP3 and DP4. The intensity of some DPs increases up to 240°C but is hypothesised to follow the same pattern above this temperature (not tested). This pattern of degradation followed by volatilisation was confirmed by TGA-GC-MS with the acquisition of the GC-MS for vapours at temperatures above 240°C. The volatilisation study during this project enabled us to go beyond detecting and tentatively identifying DPs formed at lower temperatures, as further investigations were carried out in the gas phase. The combination of degradation and volatilisation studies also sheds light on the issue of whether the decreasing chromatographic peak for DPs at higher temperatures corresponds to volatilisation (e.g., PT-1-3 for hexythiazox) or further degradation (e.g., 500M07 further degrades into 500M04 for pyraclostrobin). Some of the VPs tentatively identified in TGA-GC-MS were also detected in degradation studies using LC-HRMS, such as AE F054014 for fenoxaprop-P, PT-1-3 for hexythiazox, and 500M04 for pyraclostrobin. However, most of the compounds detected in TGA-GC-MS were not detected in LC-HRMS and thus are expected to be detected when analysing degradation samples by GC-HRMS. These compounds could also be expected to be detected with other ionisation methods in LC, such as atmospheric pressure chemical ionisation (APCI) or atmospheric pressure photoionisation (APPI). This demonstrates the need for future studies to investigate DPs both using LC and GC-HRMS, with different ionisation methods for LC analysis. Fortunately, this problem was overcome because these products were detected through TGA-GC-MS.
The robustness of the workflow was demonstrated for degradation up to 240°C, but could also be used for higher temperatures in the event that future studies investigate other heating methods. This is supported by the DSC and TGA-GC-MS conducted up to 300°C and 415°C, which can be used to consolidate degradation results above 240°C.
14C- test using radiolabeled compounds shows several practical advantages. In OECD 507 studies, the use of radiolabelled active ingredients aims to elucidate the possible degradation pathway and quantify the extent of degradation. 14C is the preferred isotope, although 32P, 35S, or other radioisotopes may be used if the molecule contains only labile carbon side chains. Moreover, the identification of DPs by various spectroscopic methods is conducted by using stable isotopes such as 13C, 15N, or deuterium 2D (non-exchangeable) together with the radiolabel isotope. However, the overall workflow proposed the use of native compounds (12C). The proposed method is more affordable, easier to execute in the laboratory, given the absence of radiolabelled compounds and accreditation.
Although the main advantage of conducting both volatilisation and degradation studies using native compounds is being able to clarify AS behaviour when temperatures are increased, while performing academic research studies.
However, one drawback of using native compounds could be the possibility of overlooking some of the degradation compounds, particularly those that are present at low intensities. To solve this issue, various suspect and NTA tools have been developed, some of which are presented in this study.
It has thus been demonstrated, for example, that fold change analysis and molecular networking are suitable methods for detecting DPs, even at low intensities (below 1% of the initial AS intensity). However, some other data processing methods, such as hierarchical cluster analysis with a dendrogram and heatmap, or analysis of variance (ANOVA), could be used to perform the same data processing analysis. To confirm the identification of the DPs (formula and structure) at the highest ICL, as well as conducting quantification, it is necessary to purchase the corresponding standard. Since DPs are often unavailable for purchase, semi-quantification methods were developed in this study and can be applied to estimate the concentration of the analytes. The combination of suspect screening, non-target and target analyses is thus suitable for detecting and quantifying DPs and VPs.
Another consideration to be taken into account when comparing the regulatory studies with the proposed workflow is the threshold applied when identifying degradation compounds. In regulatory studies, the transformation product must be identified when its radioactivity corresponds to at least 10% of the TRR. A threshold value should thus be determined in the future to report DPs detected using the proposed workflow with non-radiolabelled compounds. Toxicity studies may also be conducted to evaluate if a degradation product should be considered. However, Quantitative Structure Activity Relationship (QSAR) tests, which are theoretical tests conducted in the laboratory, are not considered accurate enough by the regulation, and the laboratory does not have sufficient material to conduct other tests. This toxicity point of view may be considered in future studies on the novel DPs to better understand the risk associated with them.
The overall workflow was demonstrated to be suitable for the ten selected ASs, but can be applied more broadly, to each AS being monitored, to estimate both degradation and volatilisation. The remaining question is whether it is necessary to conduct these studies for each new AS submitted for a marketing authorisation in order to be marketed in Europe.
Matrix effects on the DPs are not required and rarely investigated during the process of food commodities in European regulation. However, this workflow could be conducted for the determination of new DPs in various matrices. The study findings indicate that after frying, the final concentration of most compounds remains over 90% of their initial concentration. However, some DPs were observed in three out of ten analysed substances. Fenoxaprop-P (AE F054014) experienced one degradation product, which accounted for 2.2%, and hexythiazox (PT-1-3) showed one degradation product, constituting 39%. On the other hand, pyraclostrobin had three DPs, where two isomerisation products were represented at 7.6% and 2.6% of the original concentration, in addition to the 500M07 comprised 42% of the initial concentration. Notably, all these detected DPs had been previously reported in their respective regulatory studies.
Additionally, the molecular network applied to the cooking study is available in SM (Table S12). All detected DPs were already reported during thermodegradation studies of ASs diluted in acetonitrile. Thus, the short period of time (15 min) in the oil enabled fewer substances to be degraded than in oven studies, in which seven out of the ten ASs were degraded. It is assumed that the oil protects the ASs from temperature and does not promote degradation or volatilisation. The main hypothesis is that degraded substances are more sensitive to temperature and require less energy to break down, such as for microwaves. At 190°C, the main detected DP was 500M07, with low detection of two further DPs, 500M04 and 500M49, at lower percentages. The current study, carried out at 190°C, confirmed the presence of 500M07, while 500M04 was not detectable.
Therefore, it is evident that this study has the potential to be applied to various other matrices and ASs. The primary emphasis should be on optimizing sample preparation techniques to mitigate matrix effects while retaining ASs and their potential DPs. Both chemical analysis and data processing methodologies can be directly employed for detecting DPs present in the matrix samples.
Within the (EC) No. 1107/2009 regulatory framework, hydrolysis studies are conducted on an AS with a radiolabelled molecule and only a limited number of temperature conditions (from 90°C to 120°C corresponding to pasteurization, baking, brewing, boiling and sterilisation) are considered when characterizing breakdown products resulting from food processing treatments. The OECD 507 guideline already states these temperatures, but more extreme conditions are not mandatory.
This study presents a comprehensive workflow for the detection and tentative identification of DPs and volatilization products (VPs) from ASs subjected to thermal processing at temperatures exceeding 120 °C, without the use of radiolabelled standards. The method was applied to ten commercially available ASs, with thermal treatments ranging from 90 °C to 240 °C, allowing for comparison with regulatory studies, which typically assess degradation only up to 120 °C. A combination of target, suspect screening, and non-target analyses was used to detect DPs in seven of the ten molecules, with confirmation at the highest confidence level by purchasing the standard for nine of the twenty-two compounds detected.
These nine products were fully quantified, and the remaining ones were semi-quantified. The ratio between detected DPs and ASs ranged from 0.5% to 50%. On the other hand, VPs were detected for all compounds for which TGA-GC-MS was feasible. This confirmed the pattern of degradation followed by volatilisation for most of the compounds except for tetraconazole, which volatilises before degradation. Five of these compounds had already been reported in regulatory hydrolysis studies, supporting the overall reliability of the proposed method. However, some compounds were either reported in other sections of regulatory assessments (e.g., plants, livestock, humans, animals, or storage) or not reported at all, or only at levels below 10%. For instance, IN-EQW78 was detected at levels up to 20% during the thermal degradation of chlorantraniliprole, whereas it was reported at only 3.5% in the hydrolysis section. Similarly, 500M07 was detected at up to 11% when heating pyraclostrobin, reported in the regulatory report in sections other than hydrolysis section. As highlighted in the review by Dubocq et al. [6], few research or regulatory studies have addressed the fate of pesticides in food subjected to cooking processes exceeding 120 °C. One major challenge in this area is the difficulty of conducting analyses without radiolabelled compounds. The workflow presented in this study demonstrates that this constraint—often a barrier for many research laboratories—can now be overcome. This approach enables the investigation of both DPs and VPs under realistic thermal conditions. The main remaining limitation is the limited availability of analytical standards, which hinders the accurate quantification of these compounds. Finally, the need to explore the degradation of ASs across different matrices and temperatures is crucial for assessing the formation of various DPs during thermal processes currently in practice. Future investigations could extend the study of additional matrices to confirm the formation of DPs in more complex samples. This comprehensive study raises questions about the relevance of considering such degradation in oil at higher temperatures in European regulatory tests. It suggests exploring conditions beyond the current hydrolysis study to identify new degradation and reaction products, as highlighted in the present research.
The identification of by-products in this context is certainly the initial phase of a long process that should be followed by the identification of these same molecules under conditions more reflective of reality. For instance, future studies could aim to detect the occurrences and levels of these by-products in samples from total diet studies.
AS: active substance
DPs: degradation products
DSC: differential scanning calorimetry
LC-HRMS: liquid chromatography coupled with high-resolution mass spectrometry
NC: non-cooked
NTA: non-target analysis
PPPs: plant protection products
RAC: raw agricultural commodity
SSA: suspect screening analysis
TRR: total radioactive residue
VPs: volatilisation products
The supplementary tables and figures for this article are available at: https://www.explorationpub.com/uploads/Article/file/101086_sup_1.xlsx.
The authors wish to acknowledge Laurent Michely and Séna Hamadi from the University Paris-Est Créteil, CNRS, ICMPE, UMR 7182, for their help and expertise on TGA and DSC, as well as Cynthia Zerarga, Jérôme Lepetit, Catherine Tams, Alexandre Michelet, and Christophe Mattioda from PerkinElmer for their help and expertise on TGA-GC-MS.
FD: Methodology, Data curation, Formal analysis, Validation, Visualization, Investigation, Writing—original draft, Writing—review & editing. RBO, GV, and XS: Conceptualization, Methodology, Validation, Writing—review & editing. PLY: Writing—review & editing. AD, JP, and BC: Conceptualization, Methodology, Validation, Writing—review & editing, Supervision, Funding acquisition, Project administration.
The authors declare that they have no conflicts of interest.
Not applicable.
Not applicable.
Not applicable.
The raw data supporting the conclusions of this manuscript will be made available by the authors, without undue reservation, to any qualified researcher.
This work was partially funded by the French National Research Agency (ANR) as part of the AlimOmic project, [ANR-19-CE21-0002], and ANSES (CRD PhytoCuisson). The funders had no role in study design, data collection and analysis, decision to publish, or preparation of the manuscript.
© The Author(s) 2025.
Open Exploration maintains a neutral stance on jurisdictional claims in published institutional affiliations and maps. All opinions expressed in this article are the personal views of the author(s) and do not represent the stance of the editorial team or the publisher.
Copyright: © The Author(s) 2025. This is an Open Access article licensed under a Creative Commons Attribution 4.0 International License (https://creativecommons.org/licenses/by/4.0/), which permits unrestricted use, sharing, adaptation, distribution and reproduction in any medium or format, for any purpose, even commercially, as long as you give appropriate credit to the original author(s) and the source, provide a link to the Creative Commons license, and indicate if changes were made.

View: 3738
Download: 209
Times Cited: 0
