Original Article

Affiliation:
1Chromatography and Related Techniques Research Group, Department of Chemistry, Faculty of Exact and Natural Sciences, Universidad de Caldas, Manizales 170001, Colombia
Email: chemquantum@outlook.com
ORCID: https://orcid.org/0000-0003-0409-5900
Affiliation:
1Chromatography and Related Techniques Research Group, Department of Chemistry, Faculty of Exact and Natural Sciences, Universidad de Caldas, Manizales 170001, Colombia
ORCID: https://orcid.org/0000-0002-1053-4669
Affiliation:
2Secretary of Agriculture, Government of Caldas, Department of Caldas, Manizales 170001, Colombia
Affiliation:
2Secretary of Agriculture, Government of Caldas, Department of Caldas, Manizales 170001, Colombia
Affiliation:
1Chromatography and Related Techniques Research Group, Department of Chemistry, Faculty of Exact and Natural Sciences, Universidad de Caldas, Manizales 170001, Colombia
ORCID: https://orcid.org/0000-0002-2126-3956
Affiliation:
1Chromatography and Related Techniques Research Group, Department of Chemistry, Faculty of Exact and Natural Sciences, Universidad de Caldas, Manizales 170001, Colombia
Email: gtaborda@ucaldas.edu.co
ORCID: https://orcid.org/0000-0003-4358-1506
Explor Foods Foodomics. 2025;3:1010100 DOI: https://doi.org/10.37349/eff.2025.1010100
Received: January 29, 2025 Accepted: July 04, 2025 Published: September 24, 2025
Academic Editor: Miguel Herrero, Institute of Food Science Research (CIAL-CSIC), Spain
Aim: Colombia’s economy relies heavily on agriculture, with Hass avocado (Persea americana) playing a key role. This fruit consists of exocarp, mesocarp, and endocarp, with the mesocarp being the most consumed part due to its rich composition of saturated and unsaturated fatty acids (omegas), which offer valuable nutritional properties. This study analyzed the lipid composition of Hass avocado from the northern subregion of the Caldas department and evaluated the variability in lipid content across cultivation zones based on metabolite profiles.
Methods: Lipids were extracted from avocado samples, derivatized, and analyzed using gas chromatography-mass spectrometry (GC-MS) for lipidome characterization. Statistical analyses determined fat content variability across zones, and metabolic pathways involved in lipid biosynthesis were explored.
Results: Fat content ranged from 10.27% to 59.04%, with significant differences observed between cultivation zones (ANOVA: p = 0.0102 for Aranzazu Business 1; p = 0.03918 for Salamina Business 1). GC-MS analysis identified 143 chromatographic signals, including 60 known metabolites, with major fatty acids such as myristic, palmitic, tridecanoic, palmitoleic (omega-7), and oleic (omega-9) acids. The identified functional groups comprised 28.3% alkanes, 21.7% aldehydes, 18.3% esters (derivatives of the derivatization process), and 11.7% alcohols. The observed regional lipid variability suggests that environmental and agronomic factors modulate fatty acid biosynthesis, potentially through adjustments in pathways such as the mevalonate route.
Conclusions: This lipidomic approximation confirms the presence of bioactive omega-7 and omega-9 fatty acids, reinforcing the nutritional significance of Hass avocado and highlighting its potential cardiovascular benefits. The demonstrated variability across cultivation zones emphasizes the influence of local environmental conditions on lipid profiles. These findings contribute to the understanding of avocado lipid metabolism and provide valuable insights for optimizing cultivation practices, improving fruit quality, and informing functional food development.
Persea americana Mill., commonly known as the Hass avocado, has garnered significant attention in both scientific research and nutrition due to its high nutritional value and economic importance [1]. Originating from Mexico, this fruit is extensively cultivated worldwide, valued not only as an export commodity but also for its rich content of fatty acids, including both saturated and unsaturated species, which confer numerous health benefits [2]. The edible mesocarp (pulp) contains high levels of unsaturated fatty acids, particularly monounsaturated fatty acids (MUFA) such as oleic acid (omega-9) and palmitoleic acid (omega-7), and polyunsaturated fatty acids (PUFA) such as linoleic acid (omega-6) and alpha-linolenic acid (omega-3) [3], all of which have been associated with cardiovascular, anti-inflammatory, and cognitive benefits [4, 5].
Since certain unsaturated fatty acids cannot be synthesized by the human body, dietary intake is essential to maintain optimal physiological functions [5]. Among these, omega-3, omega-6, and omega-9 fatty acids have been the most extensively studied for their roles in promoting human health [5]. Several studies have confirmed the presence of both MUFA and PUFA in Hass avocado [6, 7], enhancing its value as an export product and as a contributor to Colombia’s bioeconomy [8]. In particular, the northern subregion of the Caldas department has recently expanded its Hass avocado cultivation, motivated by both economic potential and scientific interest. The lipid profile of Hass avocado includes prominent MUFA such as oleic acid, as well as essential PUFA like alpha-linolenic and linoleic acids [9].
Given the nutritional and economic significance of these bioactive lipids, ongoing research on avocado fatty acid composition is critical for maximizing health benefits, optimizing functional applications, and strengthening its global market value. A variety of extraction, separation, and identification techniques have been employed to study lipids in biological matrices. Traditional extraction methods often rely on organic solvents for efficient lipid isolation; however, alternative methods such as freeze-drying followed by cold pressing [10], enzymatic treatment [11], and supercritical fluid extraction [12] offer improved efficiency and environmental sustainability.
Lipid separation has been performed using techniques such as thin-layer chromatography (TLC), column chromatography (CC), gas chromatography (GC) [13], and ultra-high-performance liquid chromatography (UHPLC) [14]. These separation techniques are frequently coupled with advanced identification methods, including mass spectrometry (MS) and nuclear magnetic resonance (NMR) [15], enabling comprehensive lipid characterization. Among these, HPLC-MS is widely recognized for its ability to conduct full lipidomic studies across various biological matrices. However, when HPLC-MS instrumentation is unavailable, chemical derivatization techniques allow lipids—particularly fatty acids—to be rendered volatile and thermostable for GC-based analysis. Such approaches include GC-MS, tandem GC-MS/MS [16], and gas chromatography with flame ionization detector (GC-FID) [17].
Within the broader omics sciences, metabolomics focuses on detecting, elucidating, and correlating metabolites in biological systems in relation to their biosynthetic pathways, thus enabling exploration of their chemical diversity and functional roles [18]. Given the complexity of the metabolome, several subfields have emerged, including volatilomics, xenovolatilomics [19], peptidomics, and lipidomics [20]. Lipidomics, in particular, aims to comprehensively study lipid species, identifying, quantifying, and characterizing lipids within biological systems [20]. Although full lipidomic analyses involve multiple lipid classes, the present study constitutes a lipidomic approximation, focusing on fatty acid profiling through derivatization and GC-MS analysis. In addition to compositional profiling, this work also explores the biochemical pathways involved in fatty acid biosynthesis, providing further insights into the metabolic processes shaping the lipid composition of Hass avocado across different cultivation zones. The objective of this study was to perform a lipidomic approximation of Hass avocado from multiple cultivation zones within the northern subregion of Caldas, focusing on fatty acid profiling and evaluating both compositional variability and associated biosynthetic pathways.
All reagents used in this study were of HPLC grade. Dichloromethane (≥ 99.8%, CAS: 75-09-2), cyclohexane (≥ 99.5%, CAS: 110-82-7), sodium hydroxide in methanol (0.5 M) (CAS: 1310-73-2 for NaOH; 67-56-1 for methanol), boron trifluoride (BF3) in methanol (14% w/v) (CAS: 373-57-9), heptane (≥ 99%, CAS: 142-82-5), and sodium chloride (≥ 99.5%, CAS: 7647-14-5) were obtained from Sigma-Aldrich (St. Louis, MO, USA). The n-alkane standard mix (C7–C40) was purchased from Supelco (Bellefonte, PA, USA). Chromatographic separation was carried out using a ZB-5 capillary column (30 m × 0.25 mm ID × 0.25 μm film thickness) from Phenomenex (Torrance, CA, USA). Fatty acid methyl esters (FAMEs) were analyzed using a TRACE™ QP2010 Plus Gas Chromatograph coupled to a mass spectrometer, manufactured by Shimadzu (Kyoto, Japan).
Samples of Persea americana Mill. (Hass avocado) from two sources: (i) commercially from local markets and retail points in Manizales, Caldas, Colombia, and (ii) directly from cultivation fields provided by the Secretariat of Agriculture of the Department of Caldas, specifically from the northern subregion, including the municipalities of Pacora, Aranzazu, and Salamina. The sampling was conducted between April and May 2024, corresponding to the regional harvest season. To ensure consistency in physiological maturity, freshly harvested avocados were selected based on uniform size, absence of physical damage, and no visible signs of disease. For commercially acquired samples, additional verification was conducted using supplier harvest records and direct physical inspection. All selected fruits were transported in sealed containers at approximately 5°C to inhibit metabolic activity and minimize post-harvest changes during transport. Upon arrival at the laboratory, the fruits were stored at room temperature until processing. Avocados were collected at ripening stage three, characterized by a darkened exocarp, soft but firm mesocarp upon manual pressure, and no internal defects detected in the endocarp or seed. This ripening stage was selected to standardize metabolite expression across samples and minimize variability due to uncontrolled ripening factors. A completely randomized sampling method was applied to ensure representative coverage of each cultivation zone. In total, 27 samples were collected from the northern subregion of the Caldas department, covering the municipalities of Aranzazu, Salamina, and Pacora. Each individual fruit was processed separately. The mesocarp was systematically dissected from the exocarp, endocarp, and the pulp was mechanically homogenized to obtain a uniform mixture. Lipid extraction and subsequent analysis were performed on each homogenized sample in triplicate analytical replicates to ensure data reproducibility and accuracy.
The extraction of fatty acids from Hass avocado was performed on 30 g of homogenized mesocarp pulp for each sample. A solvent mixture consisting of dichloromethane and cyclohexane (1:1 v/v) was added to the pulp, using a 1:1 sample-to-solvent ratio (30 mL of solvent mixture). The mixture was manually homogenized for 1 min using mechanical agitation to ensure thorough mixing and efficient lipid solubilization. Following homogenization, the mixture was allowed to rest undisturbed at room temperature for 24 h to ensure phase separation. After this period, the organic phase was transferred to a pre-weighed, dry glass beaker. The extract was then left standing at room temperature for an additional 48 h to allow complete solvent evaporation. The total fat content was gravimetrically determined by weighing the dried lipid residue.
To chemically transform the fatty acid constituents of the avocado lipid fraction into their corresponding methyl esters, a derivatization process was performed following a modified BF3-catalyzed transesterification protocol. An aliquot of 250 mg of extracted avocado oil was weighed into a three-neck round-bottom flask and placed under reflux. Subsequently, 4 mL of 0.5 M sodium hydroxide in methanol was added, and the mixture was heated to boiling for 2 min to promote saponification of esterified lipids and release free fatty acids. Following this step, 5 mL of BF3 in methanol (14% w/v) was introduced into the flask, and the solution was again brought to boiling for an additional 2 min to catalyze methyl ester formation. After this, 3 mL of heptane was added to the system, and the mixture was boiled for a further 1 min to facilitate extraction of the methyl esters into the organic phase. The reaction system was then cooled to room temperature. The entire reaction mixture was transferred into a 50 mL Falcon tube, to which 15 mL of saturated sodium chloride (NaCl) solution was added. The mixture was vortexed for 1 min to promote phase separation by liquid-liquid extraction. After allowing the system to settle, 1 mL of the upper organic phase (heptane layer) was carefully collected. This extract containing the FAMEs was subsequently analyzed by GC-MS. This derivatization step allows for efficient conversion of both free and esterified fatty acids into their methyl ester derivatives, thereby enabling their analysis via GC. As such, this approach constitutes an indirect lipidomic approximation targeting the fatty acid composition within the lipid fraction of Hass avocado samples.
The separation and identification of FAMEs derived from the avocado lipid fraction were carried out using a Shimadzu GCMS-QP2010 Plus Gas Chromatograph coupled to an MS detector. Chromatographic separation was conducted on a ZB-5 column (30 m × 0.25 mm ID × 0.25 μm film thickness). The oven temperature program was set as follows: initial temperature at 100°C with a hold time of 2 min, followed by a temperature ramp of 6 °C/min up to 300°C, with a final hold at 300°C for 5 min. The total runtime per sample was 40.33 min. Sample injection was performed using a split injection mode. Helium served as the carrier gas, delivered at a constant flow rate of 1.0 mL/min. The injector was held at 250°C, while both the transfer line and the ionization source operated at 290°C. Mass spectrometric analysis was conducted in full scan mode over a mass-to-charge (m/z) range of 35 to 500, employing electron impact (EI) ionization at an energy of 70 eV. This analytical setup enabled a broad-spectrum detection of derivatized fatty acids, supporting a lipidomic approximation centered on the fatty acid composition of the Hass avocado oil extract.
The identification of FAMEs and other detected compounds obtained through derivatization was performed using the GC-MS Solution version 4.30 software of the Shimadzu GCM-QP2010 Plus system. Several mass spectral libraries were used for compound assignment, including NIST14, NIST14S, ADAMS, ESSENTIAL OILS, and FFNSC. A minimum similarity index (SI) threshold of 90% was applied to accept preliminary identifications based on fragmentation patterns. Peak smoothing, deconvolution, and area integration were performed directly within the software, with relative peak areas calculated against the total chromatographic area. In addition to spectral matching, identification confidence was reinforced by calculating both theoretical and experimental Kovats index (KI) using an n-alkane homologous series (C7–C40) as external standards. The deviation between theoretical and experimental KI was computed, and compounds were accepted when the percentage error remained within acceptable limits for GC-MS identifications. Given the nature of lipidomic studies, compound identification was primarily based on the interpretation of fragmentation patterns obtained for each signal, which is a fundamental strategy in untargeted lipidomics. While the use of commercial analytical standards can provide absolute confirmation, it becomes logistically and economically unfeasible to acquire reference standards for each detected compound due to the vast diversity and number of lipid species identified. Therefore, this study employed a combined approach integrating spectral library matching, KI validation, and percentage error calculation as an indirect but robust strategy for compound identification within this lipidomic approximation. The identification report generated for each detected compound included: compound name, chemical formula, mass-to-charge ratio (m/z), boiling point, retention time (RT), theoretical and experimental KI, SI, peak area, adduct, PubChem ID, Human Metabolome Database (HMDB) code [21], and KI percentage error.
In addition to compound identification, a theoretical olfactometric prediction was conducted using the Flavornet database [22] to explore potential sensory attributes of the identified metabolites. For each detected compound, known olfactory descriptors available in the database were consulted, allowing the construction of a predicted olfactometric profile for Hass avocado pulp. It is important to emphasize that this analysis is theoretical and predictive, based solely on the presence of specific metabolites identified through GC-MS analysis. Although no direct olfactometric or sensory evaluations were performed, this approach provides valuable preliminary insights into the potential contribution of identified volatiles to the overall aroma profile of the fruit. Such information may serve as a useful starting point for understanding the sensory characteristics that could influence consumer perception and avocado quality.
To ensure the accuracy, precision, and reliability of the analytical results, a comprehensive quality assurance (QA) and quality control (QC) protocol was implemented throughout the lipidomic approximation analysis. This protocol included the use of QC samples, instrument performance verification, and systematic data validation procedures. A total of seven QC samples were incorporated into the analytical sequence: three column QC (CQC) samples and four solvent QC (SQC) samples. These controls served to evaluate chromatographic system stability, monitor possible carryover effects, and detect any background contamination during sample processing and analysis. The CQC samples consisted of blank injections (empty solvent injections without sample) performed periodically during the analytical run to assess column integrity, detect potential sample carryover, and monitor baseline stability across multiple injections. The SQC samples contained only the solvent used for sample preparation (heptane), and were injected at defined intervals to verify instrument stability, identify any background noise or contaminants, and correct for potential fluctuations in the analytical signal. All data were carefully reviewed to ensure that any compounds observed in the QC samples were excluded from the final dataset to prevent false positive identifications. The inclusion of these QA/QC measures reinforced the robustness and reproducibility of the analytical process, ensuring that the metabolite profiles obtained through this lipidomic approximation reflect true biological variability rather than instrumental or procedural artifacts [23, 24].
Statistical analysis was performed to evaluate variability in fatty acid composition between sample groups. Initially, normality of the data distributions was assessed using the Shapiro-Wilk and Kolmogorov-Smirnov tests. In addition, Quantile-Quantile (Q-Q) plots were generated to visually inspect data distribution assumptions. Variability among sampling zones was further examined by calculating variance and standard deviation, with box plots used to graphically illustrate dispersion across groups. For inferential statistics, a one-way analysis of variance (ANOVA) followed by Tukey’s post-hoc test was applied to determine statistically significant differences between groups, with a significance threshold set at p < 0.05. These univariate analyses were conducted in Python using the scipy.stats and statsmodels.stats.multicomp packages. To further explore multivariate relationships and compositional patterns, additional statistical analyses were performed in RStudio version 4.4.3. Both unsupervised and supervised multivariate techniques were applied to reduce data dimensionality and identify sample clustering based on the fatty acid profiles obtained from GC-MS data. Principal component analysis (PCA) was employed as an unsupervised method to capture the principal sources of variability and detect grouping tendencies among samples. Additionally, hierarchical cluster analysis (HCA) was performed using the Euclidean distance metric and complete linkage method to classify samples according to similarities in their lipid profiles. These analyses were implemented using the timeSeries, reshape2, cluster, gplots, ggfortify, RColorBrewer, ggplot2, tidyverse, base, graphics, stats, fBasics, and pvclust [25], packages in RStudio.
Following compound identification, the biochemical pathways involved in the biosynthesis of the identified saturated and unsaturated fatty acids were explored to complement the lipidomic approximation with a metabolic context. For each detected metabolite, the corresponding HMDB code was retrieved to facilitate pathway mapping. The general metabolic pathways associated with fatty acid biosynthesis were reconstructed by integrating information from the Metacyc [26], Metaboanalyst [27], and Kyoto Encyclopedia of Genes and Genomes (KEGG) [28], and LipidMaps databases. A pathway enrichment analysis was performed using MetaboAnalyst, where statistical significance of pathway involvement was assessed by calculating p-values and their corresponding –log(p) transformations, providing insight into the relative enrichment of specific biosynthetic pathways. In addition, a metabolic network reconstruction was conducted using the metabolite codes obtained from KEGG, HMDB, LipidMaps, and MetaCyc databases. This network analysis allowed for the visualization of biochemical relationships between metabolites and offered an integrated perspective on the pathways potentially involved in fatty acid metabolism within the analyzed avocado samples. The metabolic network construction and visualization were implemented using custom Python scripts.
A triplicate analysis was conducted on Hass avocado samples from the northern sub-region of the Caldas department. Oil extraction was performed using the methodology described above to determine the fat percentage in each sample by zone. Previous studies have reported that the fatty acid content in avocado pulp typically ranges between 15.8% and 33% [29, 30]. However, our results, shown in Table 1, indicate a broader range (10.27–59.04%), reflecting the influence of environmental conditions and cultivation zones. Avocado oil is composed of both saturated and unsaturated fatty acids, whose concentrations vary depending on the variety and ripening stage of the fruit [6]. As all samples were collected and analyzed at the same standardized ripening stage (stage 3), as described in the methods section, the influence of ripening stage on fat content variability was minimized. Additionally, fat content fluctuates according to the environmental conditions of each zone, considering soil characteristics and nutrient availability in the cultivation zone. Table 1 presents the analysis of one crop from the municipality of Pacora, four from Salamina, and four from Aranzazu. The mean, variance, and standard deviation were calculated for each zone to evaluate fat content variability. The highest mean value was observed in Salamina Business 1 (59.04%), while the lowest was reported in Aranzazu Business 1 (10.27%).
Analysis of fat percentage obtained in different zones of the department of Caldas.
| Sample number | Zone | Sample | Percentfat | Average between zones | Variance | Standard deviation | ANOVA (p-value) | Significance | Tukey post-hoc test |
|---|---|---|---|---|---|---|---|---|---|
| 1 | Pacora | M1 | 49.24 | 48.3467 | 52.4385 | 7.2414 | 0.3048 | ||
| 2 | Pacora | M2 | 40.70 | ||||||
| 3 | Pacora | M3 | 55.10 | ||||||
| 4 | Aranzazu Business 3 | M1 | 35.92 | 34.1433 | 5.8456 | 2.4178 | 0.7942 | ||
| 5 | Aranzazu Business 3 | M2 | 31.39 | ||||||
| 6 | Aranzazu Business 3 | M3 | 35.12 | ||||||
| 7 | Aranzazu Dario | M1 | 39.81 | 37.4967 | 148.0136 | 12.1661 | 0.9676 | ||
| 8 | Aranzazu Dario | M2 | 24.34 | ||||||
| 9 | Aranzazu Dario | M3 | 48.34 | ||||||
| 10 | Salamina Business 3 | M1 | 61.25 | 50.3833 | 100.5349 | 10.0267 | 0.2238 | ||
| 11 | Salamina Business 3 | M2 | 48.41 | ||||||
| 12 | Salamina Business 3 | M3 | 41.49 | ||||||
| 13 | Salamina Business 2 | M1 | 30.80 | 41.7167 | 142.7432 | 11.9475 | 0.6742 | ||
| 14 | Salamina Business 2 | M2 | 39.87 | ||||||
| 15 | Salamina Business 2 | M3 | 54.48 | ||||||
| 16 | Salamina San Pablo | M1 | 36.55 | 23.5667 | 128.1808 | 11.3217 | 0.2189 | ||
| 17 | Salamina San Pablo | M2 | 15.75 | ||||||
| 18 | Salamina San Pablo | M3 | 18.40 | ||||||
| 19 | Aranzazu Business 1 | M1 | 8.52 | 10.2733 | 25.1540 | 5.0154 | 0.01020 | * | Difference with Salamina Business 1 |
| 20 | Aranzazu Business 1 | M2 | 6.37 | ||||||
| 21 | Aranzazu Business 1 | M3 | 15.93 | ||||||
| 22 | Salamina Business 1 | M1 | 82.15 | 59.0400 | 1,820.7133 | 42.6698 | 0.03918 | * | Difference from Aranzazu Business 1 |
| 23 | Salamina Business 1 | M2 | 85.17 | ||||||
| 24 | Salamina Business 1 | M3 | 9.80 | ||||||
| 25 | Aranzazu Business 2 | M1 | 28.25 | 28.4400 | 13.4593 | 3.6687 | 0.4367 | ||
| 26 | Aranzazu Business 2 | M2 | 24.87 | ||||||
| 27 | Aranzazu Business 2 | M3 | 32.20 |
*p < 0.05.
The statistical analyses (normality tests, ANOVA, Tukey’s test, Levene’s test) applied to evaluate these differences have been described in the statistical analysis section under methods. The fat content data obtained for each zone were analyzed to determine the statistical significance of differences between samples. First, normality was assessed using the Shapiro-Wilk test, yielding a test statistic of 0.9513 and a p-value of 0.2317, indicating that the data follow a normal distribution (p > 0.05). This result was further verified through a Q-Q plot, which compares the data distribution against a theoretical normal distribution (Figure 1A). Next, homoscedasticity was evaluated using Levene’s test, which produced a test statistic of 0.6846 and a p-value of 0.6998. This indicates that the variances among zones are statistically homogeneous (p > 0.05), confirming the suitability of applying ANOVA by meeting the assumptions of parametric statistics.
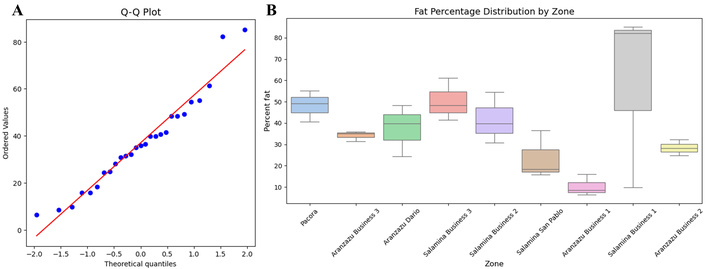
Analysis of normality and distribution of fat percentage. A. Q-Q plot assessing the normality of fat percentage values in Hass avocado samples. Observed values (blue dots) are plotted against a theoretical normal distribution (red line). B. Box plot showing fat percentage distribution by cultivation zone. The central line indicates the median, the box represents the interquartile range, and the whiskers show the full data range, excluding outliers. This graph visualizes variability in fat content across zones. Q-Q: Quantile-Quantile.
To visualize the variability between zones, a box plot was constructed (Figure 1B), revealing differences in fat percentage distribution. For instance, Salamina Business 1 exhibited the highest fat percentage values with a large dispersion, whereas Aranzazu Business 1 showed lower fat percentages with minimal dispersion. The ANOVA analysis was conducted for each registered zone to evaluate the significance of differences in fat percentage. Significant differences were identified in two zones, Aranzazu Business 1 (p = 0.0102, variance = 25.15) and Salamina Business 1 (p = 0.03918, variance = 1,820.71), which also exhibited the lowest and highest variance and standard deviation values, respectively. Following this, the Tukey post-hoc test was applied to determine which groups differed significantly, confirming differences between Aranzazu Business 1 and Salamina Business 1.
Following the established methodology for extraction, derivatization, and chromatographic analysis via GC-MS, we proceeded with the identification of compounds at a 90% similarity threshold using the aforementioned libraries. This process involved determining the m/z for each signal, the SI obtained for each metabolite, and the RT at which each compound was detected during the analysis.
Additionally, the identification of each compound was reconfirmed by determining its KI, both theoretical and experimental, through interpolation of each experimentally obtained signal with a series of alkanes (C7–C40). This approach allowed us to assess the percentage of error in compound identification. For each metabolite, the common name reported in the PubChem database was determined, along with theoretical odor information from the Flavornet database, aiming to establish the theoretical olfactometric profile of this matrix based on the lipidomic approximation data.
Table 2 presents the list of identified signals, which constitute the lipidomic approximation profile of this matrix. A total of 143 chromatographic signals were identified, of which 60 corresponded to known metabolites that are part of the lipidomic profile, while 83 signals remained unidentified at 90% similarity, representing a population of unknown-unknown metabolite signals. Among the 60 identified metabolite signals, compounds were categorized based on their main functional groups. The Hass avocado lipidomic approximation consists of: 28.3% alkanes, 21.7% aldehydes, 6.67% alkenes, 5% alkynes, 11.7% alcohols, 1.7% carboxylic acids, 3.33% ethers, 18.3% esters, and 3.3% ketones.
Compounds identified in the Hass avocado lipidome by derivatization.
| Compound number | Compound | Common name | Formula | SI | m/z | RT (min) | Odor (Flavornet) | Exp KI | Theo KI | % Error KI | Functional group |
|---|---|---|---|---|---|---|---|---|---|---|---|
| 1 | Octanal | Octanal | C8H16O | 94 | 41 | 3.160 | fat, soap, lemon, green | 704.1 | 982 | 28.3032693 | Aldehyde |
| 2 | (E)-2-Octenal | (E)-2-Octenal | C8H14O | 99 | 41 | 3.840 | green leaf, walnut | 730.4 | 1,034 | 29.3648448 | Aldehyde |
| 3 | n-Nonanal | Nonanal | C9H18O | 100 | 41 | 4.470 | fat, citrus, green | 754.7 | 1,081 | 30.1814174 | Aldehyde |
| 4 | 2-Nonenal, (E)- | (E)-2-Nonenal | C9H16O | 98 | 41 | 5.415 | cucumber, fat, green | 791.3 | 1,133.3 | 30.1777166 | Aldehyde |
| 5 | Decanal | Decanal | C10H20O | 100 | 41 | 6.210 | soap, orange peel, tallow | 818.2 | 1,183 | 30.8383924 | Aldehyde |
| 6 | 2-Decenal, (Z)- | (Z)-2-Decenal | C10H18O | 100 | 41 | 7.400 | tallow, orange | 856.1 | 1,227 | 30.2249103 | Aldehyde |
| 7 | 2,4-Undecadien-1-ol | (2E,4E)-undeca-2,4-dien-1-ol | C11H20O | 100 | 41 | 8.072 | - | 877.6 | 1,373 | 36.0833389 | Alcohol |
| 8 | 2,4-Decadienal, (E,E)- | (2E,4E)-Decadienal | C10H16O | 100 | 81 | 8.595 | seaweed | 894.3 | 1,288 | 30.5700021 | Aldehyde |
| 9 | Eugenol | Eugenol | C10H12O2 | 100 | 164 | 9.364 | clove, honey | 914.1 | 1,337 | 31.6337114 | Alcohol |
| 10 | 2-Undecenal, (E)- | (2E)-Undecenal | C11H20O | 100 | 41 | 9.485 | soap, fat, green | 916.9 | 1,350 | 32.0781402 | Aldehyde |
| 11 | Tridecane | Tridecane | C13H28 | 99 | 57 | 10.106 | alkane | 931.8 | 1,300 | 28.3256839 | Alkane |
| 12 | Isoeugenol, (Z)- | (Z)-Isoeugenol | C10H12O2 | 99 | 164 | 11.446 | flower | 963.7 | 1,379 | 30.1126166 | Alcohol |
| 13 | Nonadecane | Nonadecane | C19H40 | 100 | 57 | 12.235 | alkane | 982.6 | 1,900 | 48.2853913 | Alkane |
| 14 | Butylated Hydroxytoluene | 2,6-Di-t-butyl-4-methylphenol | C15H24O | 96 | 205 | 12.380 | - | 986.0 | 1,503.9 | 34.434591 | Alcohol |
| 15 | 2-n-Octylfuran | 2-Octylfuran | C12H20O | 100 | 81 | 12.590 | - | 991.1 | 1,281 | 22.6346511 | Ether |
| 16 | Hexadecanal | Palmitaldehyde | C16H32O | 99 | 43 | 14.691 | Cardboard | 1,037.0 | 1,795 | 42.2306788 | Aldehyde |
| 17 | Tetradecanal | Myristaldehyde | C14H28O | 99 | 43 | 14.695 | - | 1,037.0 | 1,592 | 34.8589844 | Aldehyde |
| 18 | 1,E-11,Z-13-Octadecatriene | (11E,13Z)-1,11,13-Octadecatriene | C18H32 | 99 | 67 | 15.595 | - | - | 1,685 | - | Alkene |
| 19 | 1,6,11-Dodecatriene, (Z)- | (6Z)-1,6,11-Dodecatriene | C12H20 | 100 | 67 | 15.595 | - | 1,056.3 | 1,202 | 12.1200569 | Alkene |
| 20 | 7-Hexadecyne | 7-Hexadecyne | C16H30 | 100 | 67 | 15.720 | - | 1,059.0 | 1,629 | 34.9911862 | Alkyne |
| 21 | 7-Tetradecyne | 7-Tetradecyne | C14H26 | 100 | 67 | 15.730 | - | 1,059.2 | 1,416 | 25.1971957 | Alkyne |
| 22 | 9-Hexadecyn-1-ol | 9-Hexadecyne-1-ol | C16H30O | 100 | 55 | 15.855 | - | 1,061.9 | 1,872 | 43.2754077 | Alcohol |
| 23 | Bicyclo[10.1.0]tridec-1-ene | Bicyclo[10.1.0]tridec-1-ene | C13H22 | 100 | 67 | 15.860 | - | 1,062.0 | - | - | Alkene |
| 24 | 1-Nonadecene | 1-Nonadecene | C19H38 | 100 | 55 | 15.870 | - | 1,062.2 | 1,891 | 43.8283677 | Alkene |
| 25 | 1-Octadecyne | 1-Octadecyne | C18H34 | 96 | 81 | 18.335 | - | 1,114.7 | 1,808 | 38.3442012 | Alkyne |
| 26 | Myristic acid, TMS derivative | Trimethylsilyl myristate | C17H36O2Si | 98 | 117 | 18.560 | - | 1,119.5 | 1,842 | 39.2250986 | Ester |
| 27 | 9-Octadecenal, (Z)- | 9Z-Octadecenal | C18H34O | 97 | 41 | 19.074 | - | 1,130.3 | 2,007 | 43.6823748 | Aldehyde |
| 28 | Tetradec-(7Z)-en-2-one | 7Z-Tetradecen-2-one | C14H26O | 99 | 43 | 19.705 | - | 1,143.6 | - | - | Ketone |
| 29 | 9,17-Octadecadienal, (Z)- | (z)-9,17-octadecadienal | C18H32O | 96 | 67 | 19.960 | - | 1,148.9 | 2,297 | 49.9805238 | Aldehyde |
| 30 | Tetradec-(11Z)-enal | 11Z-Tetradecenal | C14H26O | 99 | 41 | 20.076 | - | 1,151.4 | - | - | Aldehyde |
| 31 | (E)-13-Docosenoic acid | E-Brassidic acid | C22H42O2 | 99 | 41 | 20.084 | - | 1,151.6 | 2,572 | 55.2271425 | Carboxylic acid |
| 32 | Palmitoleic acid methyl ester | Methyl Palmitoleate | C17H32O2 | 99 | 55 | 20.195 | - | 1,153.9 | 1,885.8 | 38.8133405 | Ester |
| 33 | Tridecanoic acid, methyl ester | Methyl Tridecanoate | C14H28O2 | 98 | 74 | 20.557 | - | 1,161.5 | 1,606 | 27.6764764 | Ester |
| 34 | Hexadecanoic acid, methyl ester | Methyl Palmitate | C17H34O2 | 100 | 74 | 20.600 | - | 1,162.4 | 1,908 | 39.0764647 | Ester |
| 35 | 2-Tridecylfuran | 2-tridecylfuran | C17H30O | 100 | 81 | 21.078 | - | 1,172.5 | - | - | Ether |
| 36 | Pentadecane | Pentadecane | C15H32 | 98 | 57 | 21.805 | alkane | 1,187.8 | 1,500 | 20.8140351 | Alkane |
| 37 | Oleic Acid | Oleic Acid | C18H34O2 | 99 | 55 | 23.097 | fat | 1,224.0 | 2,113 | 42.0741569 | Ester |
| 38 | 9,12-Octadecadienoic acid, methyl ester, (E, E)- | Methyl linolelaidate | C19H34O2 | 99 | 67 | 23.463 | - | 1,236.3 | 2,078 | 40.5054718 | Ester |
| 39 | 9-Octadecenoic acid, methyl ester, (E)- | Methyl elaidate | C19H34O2 | 98 | 55 | 23.465 | - | 1,236.4 | 2,084 | 40.6735299 | Ester |
| 40 | 9-Octadecenoic acid (Z)- methyl ester | Methyl oleate | C19H36O2 | 99 | 55 | 23.566 | - | 1,239.8 | 2,082 | 40.4532032 | Ester |
| 41 | 2-Cyclopenten-1-one, 2-pentyl- | 2-Pentyl-2-cyclopenten-1-one | C10H16O | 93 | 97 | 24.048 | - | 1,256.0 | 1,259 | 0.23881922 | Ketone |
| 42 | 13-Octadecenoic acid, (E)-, TMS derivative | 13-Octadecenoic acid, (E)-, TMS derivative | C21H42O2Si | 91 | 73 | 24.190 | - | 1,260.8 | - | - | Ester |
| 43 | Delta-Dodecalactone | Delta-Dodecanolactone | C12H22O2 | 96 | 99 | 24.316 | - | 1,265.0 | 1,670 | 24.2504889 | Ester |
| 44 | 1-Heptadec-1-ynyl-cyclopentanol | 1-Heptadec-1-ynyl-cyclopentanol | C22H40O | 98 | 41 | 24.705 | - | 1,278.1 | 2,419 | 47.1635189 | Alcohol |
| 45 | Eicosane | Eicosane | C20H42 | 100 | 57 | 25.114 | alkane | 1,291.9 | 2,000 | 35.4057239 | Alkane |
| 46 | Docosane | Docosane | C22H46 | 96 | 57 | 26.654 | alkane | 1,364.8 | 2,200 | 37.9641805 | Alkane |
| 47 | Heneicosane | Heneicosane | C21H44 | 100 | 57 | 26.662 | alkane | 1,365.2 | 2,100 | 34.9910937 | Alkane |
| 48 | Cyclopropanecarboxyllic acid, tridec-2-ynyl ester | Cyclopropanecarboxyllic acid, tridec-2-ynyl ester | C17H28O2 | 99 | 69 | 28.202 | - | 1,452.6 | 1,898 | 23.46549 | Ester |
| 49 | 3-Methyl-1-dodecyn-3-ol | 3-methyldodec-1-yn-3-ol | C13H24O | 98 | 69 | 28.615 | - | 1,478.4 | 1,403 | 5.37687099 | Alcohol |
| 50 | 2-Methyltetracosane | 2-Methyltetracosane | C25H52 | 92 | 57 | 29.010 | - | 1,503.6 | 2,463 | 38.9510206 | Alkane |
| 51 | Undecane, 2,9-dimethyl- | 2,9-Dimethylundecane | C13H28 | 97 | 57 | 29.165 | - | 1,514.9 | 1,233 | 22.8636732 | Alkane |
| 52 | Heptadecane, 3-methyl- | 3-Methylheptadecane | C18H38 | 96 | 43 | 30.585 | - | 1,620.2 | 1,774 | 8.66725395 | Alkane |
| 53 | Nonadecane, 2-methyl- | 2-Methylnonadecane | C20H42 | 98 | 43 | 31.750 | - | 1,715.7 | 1,964 | 12.6415212 | Alkane |
| 54 | Octadecane | Octadecane | C18H38 | 100 | 57 | 32.240 | alkane | 1,758.5 | 1,800 | 2.30470645 | Alkane |
| 55 | Tricosane, 2-methyl- | 2-Methyltricosane | C24H50 | 98 | 43 | 33.030 | - | 1,829.2 | 2,363 | 22.5913387 | Alkane |
| 56 | Hexatriacontane | Hexatriacontane | C36H74 | 99 | 57 | 33.165 | - | 1,841.7 | 3,600 | 48.8425926 | Alkane |
| 57 | Octadecane, 2-methyl | 2-methyloctadecane | C19H40 | 98 | 57 | 34.274 | - | 1,947.0 | 1,864 | 4.45068585 | Alkane |
| 58 | Eicosane, 3-methyl- | 3-Methyleicosane | C21H44 | 98 | 57 | 34.403 | - | 1,959.6 | 2,074 | 5.51553312 | Alkane |
| 59 | Octacosane | Octacosane | C28H58 | 100 | 57 | 34.745 | - | 1,993.1 | 2,800 | 28.8165266 | Alkane |
| 60 | Hexacosane | Hexacosane | C26H54 | 100 | 57 | 34.745 | - | 1,993.1 | 2,600 | 23.3408748 | Alkane |
SI: smilarity index; m/z = mass-to-charge ratio; RT: retention time; Exp KI: experimental Kovats index; Theo KI: theoretical Kovats index.
These functional groups are commonly found in plant lipidomic profiles. However, since this was an indirect analysis involving chemical derivatization, the fatty acids present in the Hass avocado pulp were chemically transformed into esters through esterification. Consequently, 18.3% of the identified compounds correspond to esters formed during this process. The identified esters include myristic acid TMS derivative, methyl palmitoleate, methyl tridecanoate, methyl palmitate, methyl linolelaidate, methyl elaidate, methyl oleate, and 13-octadecenoic acid (E)-TMS derivative. Of these, the compounds that naturally exist in their fatty acid form within the matrix are tetradecanoic acid (myristic acid), (9Z)-hexadecenoic acid (palmitoleic acid) [31], tridecanoic acid, hexadecanoic acid (palmitic acid), (9E,12E)-octadecadienoic acid (linoelaidic acid), (9E)-octadecenoic acid (elaidic acid), (9Z)-octadecenoic acid (oleic acid) [32], and (13E)-octadecenoic acid. The reconfirmation of these identified metabolites can be found in Table S1.
The theoretical olfactometric profile, based on the identified metabolites, indicates that most of the detected compounds exhibit an alkane-like odor, often associated with kerosene. However, the Hass avocado pulp is characterized by its high-water content and nutritional value, primarily due to the presence of saturated and unsaturated fatty acids (MUFA and PUFA). These compounds contribute to a predominant fat-like odor in the matrix, accompanied by subtle green and lemon notes. Additionally, faint hints of orange and peel-related aromas characteristic of this fruit were also observed. Figure 2 presents the radial graph illustrating the distribution of odors expressed by the 60 identified metabolites. However, among these, the theoretical olfactory properties could only be determined for 20 compounds. This limitation arises because, in terms of aroma, a chemical compound may or may not be directly associated with a specific olfactory descriptor, and many lipid-derived compounds identified in this study lack available odor information in reference databases.
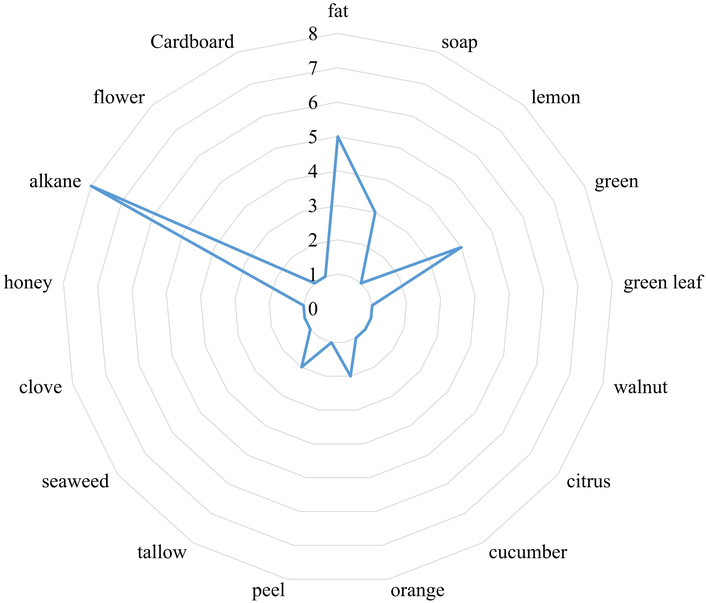
Subjective scale of the olfactometric profile generated from compounds identified in the lipidome of Hass avocado. Units: olfactory intensity.
Of the 27 samples collected from different zones of the northern sub-region of Caldas, a total of 15 samples were processed and analyzed by GC-MS. These included both commercial samples and samples from the municipalities of Aranzazu and Pacora. Additionally, data from three CQC and four SQC were incorporated. This comprehensive dataset enabled the construction of a multivariate matrix that captured information on both identified and unidentified metabolites across all processed samples, resulting in a total of 285 variables representing the lipidomic approximation profile of Hass avocado pulp. The entire matrix was then processed using the statistical software R and RStudio, where multivariate statistical analyses were performed. Normality criteria were assessed, and a preliminary data exploration was conducted through PCA to evaluate data behavior. The statistical methods applied have been previously described in the statistical analysis section under methods.
Figure 3A illustrates the number of components required for dimensionality reduction. PC1 explains 33.8% of the data variability, while PC2 accounts for 15.6%, together explaining 49.4% of the total variance. This indicates that additional components are necessary for effective dimensionality reduction. To achieve an explanation of 82.5% of the data variance, five components are required, highlighting the limitations of PCA in achieving strong dimensionality reduction. Therefore, exploring alternative methods, such as stochastic neighbor embedding with t-distribution stochastic neighbor embedding (t-SNE), may be beneficial for deeper data exploration. Additionally, Figure 3B presents an analysis of metabolite contributions to data variability, while Figure 3C provides a PCA-based evaluation of the same factor.
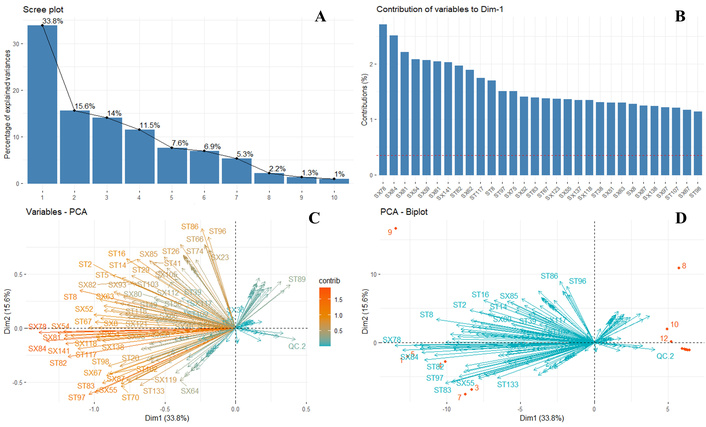
Multivariate analysis. A. Number of components for dimensionality reduction. B. Contribution analysis on the variability of the data as a function of the metabolites. C. PCA as a function of the contribution of metabolites to data variability. D. PCA biplot: samples (red points) and metabolites (blue arrows). PCA: principal component analysis.
To categorize the identified and unidentified metabolites, those with confirmed identities were labeled as ST, whereas unidentified compounds were designated as SX. The metabolites contributing most significantly to the variability between Hass avocado pulp samples included SX78, SX84, SX81, SX54, SX59, SX61, SX141, ST82 (Methyl palmitoleate), SX62, ST117 (3-Methyl-1-dodecyn-3-ol), ST8 (Nonanal), ST97 (Methyl linolelaidate), SX75, SX52, ST83 (Methyl palmitate), ST67 (Methyl tridecanoate), SX123, SX55, SX137, SX118, ST38 (Nonedecane), SX51, SX63, SX8, SX87, SX138, ST107 (1-Heptadec-1-ynyl-cyclopentanol), SX97, SX67, and ST98 (Methyl elaidate). The variability between samples is primarily influenced by the presence of these fatty acids. As previously observed, the fat content in Hass avocado samples varies due to the edaphoclimatic conditions of each cultivation zone, which directly impacts lipidomic approximation composition [33]. This variation is reflected in the chromatographic response, as differences in the abundance of key compounds—such as Methyl palmitoleate, Nonanal, Methyl linolelaidate, Methyl palmitate, Methyl tridecanoate, Methyl elaidate, and Methyl linoleate—generate significant fluctuations in signal intensity when analyzed by GC-MS. Additionally, the methodology employed includes the use of a derivatizing agent to transform as many fatty acids as possible within the matrix. However, the reaction temperature may alter the structure of fatty acids, leading to conformational changes. This effect is evident in the identification of Methyl elaidate (Methyl trans-9-octadecenoate) and Methyl oleate (Methyl cis-9-octadecenoate), both classified as omega-9 fatty acids in the analyzed samples. Notably, oleic acid—indirectly identified as methyl oleate—is a MUFA reported in the literature to be associated with favorable lipid profiles, including potential roles in reducing plasma cholesterol levels and increasing high-density lipoprotein (HDL) cholesterol [34].
Figure 3D represents a PCA biplot, providing a detailed view of the relationship between the analyzed samples and metabolic variables in a two-dimensional space defined by the first two PCs. The Dim1 axis (33.8%) and the Dim2 axis (15.6%) together explain 49.4% of the total data variability, allowing for the interpretation of underlying patterns in the metabolic composition of Hass avocado pulp. In the plot, the blue arrows represent the measured metabolites, whose direction and magnitude indicate their contribution to the observed variability; metabolites with longer vectors have a greater influence on sample separation. The distribution of points reveals that most analyzed samples (blue points) cluster within the same region, suggesting similarities in their metabolic profiles. However, some samples [labeled in red, such as “9 (Pacora)”, “8 (Commercial)”, “10 (Commercial)”, and “12 (Commercial)”] behave as outliers, indicating significant differences in their chemical composition. This pattern may be associated with variations in environmental conditions, storage factors, or possible micro-variations in ripening state, which could directly impact the expression of certain metabolites. PCA visualization enables the identification of trends and the assessment of heterogeneity in lipid composition, providing a foundation for more detailed studies on the influence of external factors on the metabolic variability of Hass avocado.
Instead, these identified metabolites serve as biochemical markers of sample differentiation between avocado sources. By considering these metabolites as variables, it is possible to classify and group samples based on their compositional similarities. Figure 4 presents an HCA, highlighting the clustering patterns among the different QCs, as well as the separation between commercial samples and those obtained from the municipalities of Pacora and Aranzazu, which exhibit a certain degree of similarity. However, a clear distinction is observed between commercially sourced samples and those from the northern subregion of Caldas. This differentiation suggests that edaphoclimatic conditions significantly influence the lipid profile, establishing criteria that could later be incorporated into predictive classification models.
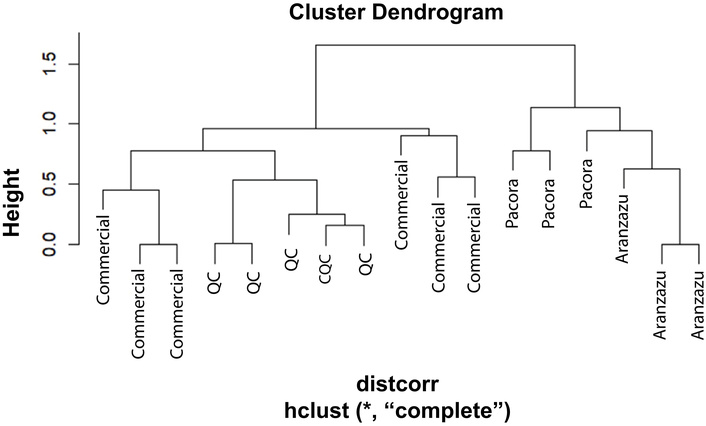
Hierarchical cluster analysis (HCA) of samples from a lipidomic approximation study using GC-MS after derivatization. The dendrogram shows grouping patterns between samples from different cultivation zones and commercial sources. CQC: column quality control; QC: quality control; GC-MS: gas chromatography-mass spectrometry.
Using the MetaboAnalyst platform, a metabolite search was performed utilizing KEGG and HMDB codes, enabling metabolic enrichment analysis. It is important to clarify that the general KEGG global metabolism database was used for pathway mapping, as no specific avocado library exists in KEGG for this species. Figure 5A presents a scatter plot where the X-axis represents the pathway impact (the proportion of detected metabolites within a given pathway), while the Y-axis displays the –log(p-value), reflecting the statistical significance of pathway enrichment. The circle size indicates pathway impact, and color gradients reflect significance levels. The topological analysis revealed significant impacts on several pathways, including: fatty acid biosynthesis (p = 6.8158E-8, –log(p) = 7.1665, impact = 0.01123), biosynthesis of unsaturated fatty acids (p = 2.8818E-5, –log(p) = 4.5403, impact = 0.0), cutin, suberine, and wax biosynthesis (p = 0.0010962, –log(p) = 2.9601, impact = 0.04545), fatty acid elongation (p = 0.076122, –log(p) = 1.1185, impact = 0.0), glycosylphosphatidylinositol (GPI)-anchor biosynthesis (p = 0.09204, –log(p) = 1.036, impact = 0.04762), and fatty acid degradation (p = 0.12014, –log(p) = 0.92032, impact = 0.0). This analysis highlights the biochemical pathways most impacted by the detected metabolites, providing exploratory insights into the metabolic processes associated with fatty acid metabolism in Hass avocado.
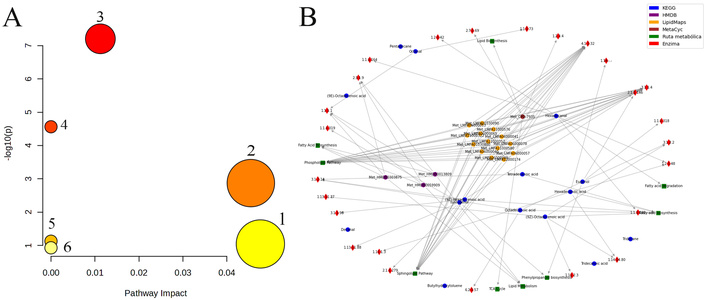
Analysis of metabolic pathways. A. Pathway enrichment and topological analysis of identified metabolites using MetaboAnalyst. Circle size indicates pathway impact; color scale indicates statistical significance [−log(p-value)]. Pathways are labeled numerically as follows: 1) Glycosylphosphatidylinositol (GPI)-anchor biosynthesis. 2) Cutin, suberine, and wax biosynthesis. 3) Fatty acid biosynthesis. 4) Biosynthesis of unsaturated fatty acids. 5) Fatty acid elongation. 6) Fatty acid degradation. B. Metabolic network generated from KEGG, MetaCyc, LipidMaps, and HMDB databases. Green squares: pathways; red diamonds: enzymes (EC numbers); circles: metabolites (blue: KEGG; purple: HMDB; yellow: LipidMaps; brown: MetaCyc).
This pathway analysis was further complemented by the development of a Python-based script, which enabled automated searching of metabolite identifiers across multiple databases, including KEGG, LipidMaps, MetaCyc, and HMDB [35]. This allowed the construction and visualization of an integrated metabolic network, representing biochemical interactions among identified metabolites, their pathways, and associated enzymes. In the generated network diagram, biochemical pathways are represented as green squares, enzymes as red diamonds with their corresponding enzyme codes, and metabolites as circular nodes. Node color indicates database origin: blue for KEGG, purple for HMDB, yellow for LipidMaps, and brown for MetaCyc. Figure 5B illustrates the network connections linking identified metabolites to major metabolic pathways such as the Tricarboxylic Acid Cycle (TCA Cycle), Lipid Metabolism, Phenylpropanoid Biosynthesis, Sphingolipid Pathway, Fatty Acid Biosynthesis, Fatty Acid Degradation, Lipid Biosynthesis, and the Phospholipid Pathway. These findings validate and complement the results obtained through MetaboAnalyst, while expanding the understanding of the biochemical map involved in fatty acid metabolism in Hass avocado.
The observed variation in fat content across cultivation zones may be attributed to a combination of edaphoclimatic conditions and agronomic practices. The presence of chemical additives—such as macronutrients, micronutrients, pH regulation, and phytopathological control—is often specific to each area and, in some cases, confidential [36]. Certain subregions report the use of agrochemicals for pH regulation and hardness control, such as Sys Comet and Cosmo Aguas, as well as fertilizers like Omex Bio 8, Atlante D, Keylate, CaB, Select, Nutriplex, and Foltron. In addition, chemicals such as Fe-EDTA are reported for the control of iron chlorosis in plant roots under altered soil conditions. Furthermore, the application of fungicides (Banguard, Agrifos), insecticides (Exalt, Beauveria bassiana, Cypermethrin, Abafed, Capsialyl, Citroemulsion, Malathion, Vertinec), and acaricides (Milbeknock, Abamecal, Vertinec) has been documented.
This extensive use of agrochemicals plays a crucial role in phytopathogen control, which helps maintain the quality of the product. At the same time, it provides a diverse array of nutrients and soil regulators, creating a controlled environment that prevents excessive mineral accumulation, which could otherwise affect the growth and development of the fruit.
Additionally, these nutrients contribute to a controlled and efficient metabolic cycle, ensuring optimal conditions for plant growth and fruit development. Under the influence of agrochemicals and varying edaphoclimatic conditions, subtle metabolic variations occur, leading to alterations in the lipidomic approximation profile of Hass avocado across different zones and subregions within the department of Caldas. These variations manifest in the presence of known-known, known-unknown, and unknown-unknown metabolites [37]. This classification follows previously established research criteria. Known-known metabolites refer to major compounds that are successfully identified and have already been reported in prior studies for this matrix.
Known-unknown metabolites are major compounds identified with high spectral similarity and retention index matching, but for which no previous reports exist specifically for avocado matrices, representing new findings in this context. Unknown-unknown metabolites correspond to minor compounds detected within the matrix for which full structural elucidation was not achieved, due to insufficient spectral similarity and lack of reference standards or database matches. Thus, they represent newly detected signals that contribute to the differentiation of the samples, while posing a challenge for their structural characterization.
After identifying the fatty acids, they were classified based on the presence of unsaturation to determine their omega classification. The identified compounds included: myristic acid (saturated), palmitoleic acid (omega-7) [38], tridecanoic acid (saturated), palmitic acid (saturated), linoelaidic acid (omega-6), elaidic acid (omega-9), oleic acid (omega-9), and (13E)-octadecenoic acid (omega-5). Additionally, several fatty acids classified as known-known metabolites—previously identified in this matrix through research—were also reported. These include: myristic acid, myristoleic acid, palmitic acid, palmitoleic acid, linoleic acid, oleic acid, stearic acid, arachidic acid, tricosanoic acid, 13-docosenoic acid, lignoceric acid, linolenic acid, eicosadienoic acid, eicosatrienoic acid, docosadienoic acid, cis-10-heptadecenoic acid, and cis-13,16-docosadienoic acid.
Specifically, the Flavornet database did not contain theoretical odor descriptors for a substantial proportion of the identified metabolites. It is important to emphasize that this olfactometric profile represents a theoretical prediction based on chemical identification and database-matched odor descriptors. No direct GC-MS-Olfactometry (GC-MS-O) or sensory panel evaluation was performed. As such, while this approach offers valuable preliminary insights into potential volatile aroma contributors, it cannot substitute for experimental confirmation of the sensory attributes perceived by human subjects [39].
Nevertheless, this theoretical olfactometric mapping provides a useful exploratory tool to guide future sensory research. By identifying candidate compounds that may contribute to the characteristic aroma of Hass avocado, it establishes a foundation for subsequent targeted olfactometric analysis and the design of GC-MS-O studies. In this way, the approach helps prioritize metabolites of interest and enhances the understanding of how specific lipid-derived compounds may influence consumer-perceived avocado flavor and aroma.
The variability between samples is primarily influenced by the presence of these fatty acids. As previously observed, the fat content in Hass avocado samples varies due to the edaphoclimatic conditions of each cultivation zone, which directly impacts lipidomic approximation composition. This variation is reflected in the chromatographic response, as differences in the abundance of key compounds—such as Methyl palmitoleate, Nonanal, Methyl linolelaidate, Methyl palmitate, Methyl tridecanoate, Methyl elaidate, and Methyl linoleate—generate significant fluctuations in signal intensity when analyzed by GC-MS. Additionally, the methodology employed includes the use of a derivatizing agent to transform as many fatty acids as possible within the matrix. However, the reaction temperature may alter the structure of fatty acids, leading to conformational changes. This effect is evident in the identification of Methyl elaidate (Methyl trans-9-octadecenoate) and Methyl oleate (Methyl cis-9-octadecenoate), both classified as omega-9 fatty acids in the analyzed samples. Notably, oleic acid—indirectly identified as methyl oleate—is a MUFA reported in the literature to be associated with favorable lipid profiles, including potential roles in reducing plasma cholesterol levels and increasing HDL cholesterol.
However, elaidic acid, an unsaturated fatty acid isomer of oleic acid, has long been considered to have detrimental health effects. Nevertheless, it remains a subject of study due to its potential role in enhancing tumor antigen presentation and immune response via acyl-CoA synthetase long-chain family member 5 (ACSL5) activity [40]. Given its biochemical significance, further investigation is warranted to fully elucidate its potential health implications. Furthermore, it is important to reconfirm its presence using complementary instrumental techniques, as the derivatization and heating steps may induce isomerization artifacts [41]. Similarly, the identification of omega-type fatty acids, such as palmitoleic acid (omega-7), linoelaidic acid (omega-6), and oleic acid (omega-9), reinforces the potential nutritional relevance of Hass avocado consumption [42]. While these findings are consistent with previously reported fatty acid profiles, it is important to emphasize that, as this study is based on non-targeted derivatized lipidomic approximation without the use of analytical standards, no quantitative claims regarding health outcomes can be directly made.
The identification of key metabolic pathways using both MetaboAnalyst and the custom Python-based metabolic network provides additional context for the biochemical mechanisms regulating fatty acid biosynthesis and degradation in this species. In particular, the central role of Acetyl-CoA and its participation in the Krebs cycle is evident. During biosynthesis, plants fix carbon dioxide and convert it into glucose, which enters glycolysis and subsequently the Krebs cycle, producing Acetyl-CoA as a precursor. This intermediate contributes to the formation of mevalonate and malonic acid. The mevalonate pathway facilitates the biosynthesis of dimethylallyl pyrophosphate (DMAPP) and isopentenyl pyrophosphate (IPP), which subsequently generate isoprene units that serve as building blocks for the formation of hemiterpenes, monoterpenes, sesquiterpenes, and triterpenes [43].
Additionally, the non-mevalonate pathway utilizes 1-deoxy-D-xylulose-5-phosphate (DOXP) and 2-C-methyl-D-erythritol-4-phosphate (MEP) as alternative intermediates. Acetyl-CoA also acts as a precursor for Malonyl-CoA [44], which serves as a fundamental building block in the biosynthesis of both saturated and unsaturated fatty acids (Figure 6). Malonyl-CoA is synthesized from Acetyl-CoA through the action of Acetyl-CoA carboxylase (ACCase) (E.C. 6.4.1.2) and malonyl-ACP (malonyl-acyl carrier protein), which is generated by the enzyme malonyl-CoA: ACP transacylase (MCAT) (E.C. 2.3.1.39) [45]. Both Malonyl-CoA and Acetyl-CoA are subsequently utilized by the fatty acid synthase (FAS) complex, enabling the elongation of fatty acid chains from 2 to 16 carbon atoms. This biosynthetic process involves sequential enzymatic reactions, including β-ketoacyl-ACP synthetases (KAS), β-ketoacyl-ACP reductase, β-hydroxyacyl-ACP dehydratase, and enoyl-ACP reductase [46].
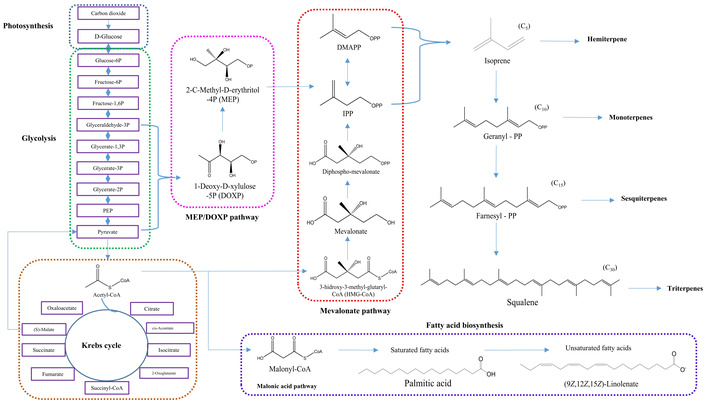
General biochemical route for the biosynthesis of terpenes and fatty acids present in Hass avocado.
The biosynthetic pathway originates from Acetyl-CoA, undergoing successive two-carbon extensions to form dodecanoyl-CoA, which serves as a precursor for hexadecanoyl-CoA, and ultimately gives rise to palmitic acid (C16H32O2, 16:0). Through the action of thioesterase (E.C. 3.1.2.14) (Figure 7), palmitic acid is synthesized. In subsequent reactions, the fatty acid desaturase enzyme SCD-1 (stearoyl-CoA desaturase 1) catalyzes the desaturation of palmitic acid into palmitoleic acid (C16H30O2, 16:1, ω7). The origin of cis-10-heptadecenoic acid (C17H32O2, 17:1, ω7) requires additional metabolic steps and is not a direct product of SCD-1 activity, reflecting the complexity of fatty acid metabolism in plants.
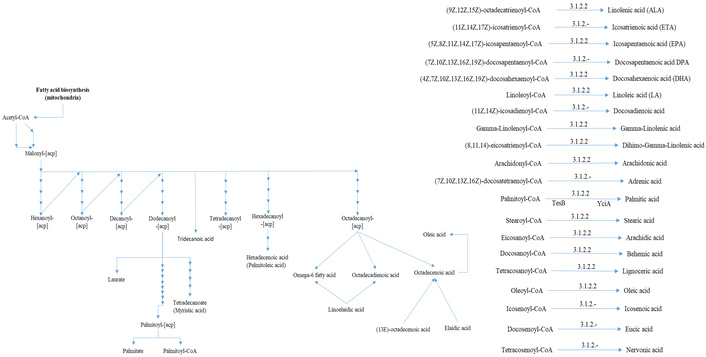
The β-oxidation of palmitic acid produces myristic acid (C14H28O2, 14:0), which may undergo desaturation by SCD-1 to generate myristoleic acid (C14H26O2, 14:1, ω5) [47]. Further chain elongation from palmitic acid leads to the biosynthesis of stearic acid (C18H36O2, 18:0), which, upon desaturation, forms oleic acid (C18H34O2, 18:1, ω9) (Figure 7). Additional elongation produces longer chain saturated fatty acids such as arachidic acid (C20H40O2, 20:0), docosadienoic acid (C22H40O2, 22:0), tricosanoic acid (C23H46O2, 23:0), and lignoceric acid (C24H48O2, 24:0) [48].
Desaturation of oleic acid further leads to the synthesis of PUFA, including linoleic acid (C18H32O2, 18:2, ω6), eicosadienoic acid (C20H36O2, 20:2, ω6), and linolenic acid (C18H30O2, 18:3, ω3). Linoleic acid serves as a substrate for additional desaturation reactions, producing metabolites such as eicosatrienoic acid (C20H34O2, 20:3, ω3), and 13-docosenoic acid (C22H42O2, 22:1, ω9) [7]. Additionally, elaidic acid may be derived from oleic acid through trans-cis isomerization, potentially catalyzed by fatty acid desaturase activity. However, the formation and concentration of these compounds may vary across samples due to multiple influencing factors such as pH, temperature, enzymatic activity, and plant nutritional status, all of which modulate growth and metabolic profile. These environmental and physiological conditions influence the regulatory activity of desaturase enzymes involved in the biosynthesis of both monounsaturated and PUFA. Beyond their roles in lipid biosynthesis, these desaturase enzymes also contribute to membrane structure maintenance and participate in cell signaling pathways, reflecting the broader functional importance of fatty acid metabolism in plant development and stress response.
The identification and biochemical analysis of unsaturated fatty acids (MUFA and PUFA) in Hass avocado highlight the potential significance of incorporating foods rich in these compounds into the human diet, as supported by existing literature describing their cardiovascular [49], anti-inflammatory [3], antioxidant, and neuroprotective properties [50, 51]. While this study did not conduct quantitative measurements or direct health assessments, the detection of key unsaturated fatty acids provides valuable biochemical insight into the composition of the fruit. From a research perspective, the exploration and identification of such metabolites contribute to enhancing the understanding of the nutritional potential of specific food matrices. These studies may add value to agricultural products by linking their biochemical profiles to potential health-promoting properties described in the literature.
In this context, Hass avocado, which is naturally rich in unsaturated fatty acids, has been recognized as a fruit with potential functional food attributes. This nutritional potential has stimulated increased production of Hass avocado in Colombia, particularly in the department of Caldas, positioning it as a key agro-industrial product with economic importance for the region [52]. Recent research efforts have focused on optimizing the production of these beneficial fatty acids to meet growing commercial demand. Genetic engineering approaches are actively investigating the biochemical pathways involved in fatty acid biosynthesis, aiming to enhance production through microbial biotechnology in various crops [53]. Additionally, unsaturated fatty acids have found applications beyond food, particularly in the pharmaceutical industry, where they serve as components for microencapsulation technologies [54, 55]. These strategies may improve drug absorption, distribution, metabolism, and excretion (ADME), thereby enhancing bioavailability and therapeutic outcomes.
This study offers a detailed characterization of the lipid profile of Hass avocado through a lipidomic approximation, based on indirect analysis using GC-MS following a chemical derivatization process. This approach enabled the identification of eight methyl ester derivatives of fatty acids, characterizing with 90% spectral confidence the presence of saturated fatty acids such as myristic acid, palmitic acid, and tridecanoic acid. Additionally, we identified unsaturated fatty acids, including palmitoleic acid (omega-7) and oleic acid (omega-9), both predominantly exhibiting cis isomerism. However, due to the heating steps involved in the derivatization process, our findings suggest the potential for cis-trans isomerization of unsaturated fatty acids, leading to the formation of trans-isomer derivatives such as linoelaidic acid, elaidic acid, and (13E)-octadecenoic acid. This observation highlights the importance of developing analytical methodologies that avoid derivatization, as certain analytes may undergo structural modifications or incomplete reactions under thermal conditions, potentially generating unintended by-products.
The methodology applied herein demonstrates its suitability for the qualitative identification of FAMEs contributing to the lipid composition of Hass avocado. However, to enhance identification accuracy, future studies should incorporate complementary instrumental platforms such as HPLC-MS. This would allow reconfirmation of identified compounds and enable a more comprehensive comparative analysis between the volatile and non-volatile lipid fractions present in the matrix. Furthermore, additional research should evaluate the influence of different ripening stages on the lipid profile, as these may modulate nutritional properties and bioavailability of fatty acids.
From a practical standpoint, these findings underscore the potential nutritional relevance of Hass avocado cultivated in the northern sub-region of the Caldas department. The presence of MUFA, such as palmitoleic acid (omega-7) and oleic acid (omega-9), is consistent with prior reports linking such compounds to favorable lipid profiles that may support cardiovascular health, based on previously published evidence. Although this study does not provide quantitative data or direct health outcomes, the qualitative identification of these bioactive lipids may add value to Hass avocado as a promising candidate for functional food development and market expansion. Future studies should explore the metabolic regulation of fatty acid biosynthesis, assess the effects of cultivation and post-harvest conditions on lipid variability, and validate potential nutritional or health benefits through targeted quantitative analysis, clinical trials, and epidemiological research.
ANOVA: analysis of variance
CQC: column quality control
FAMEs: fatty acid methyl esters
GC: gas chromatography
GC-MS-O: gas chromatography-mass spectrometry-Olfactometry
HCA: hierarchical cluster analysis
HDL: high-density lipoprotein
HMDB: Human Metabolome Database
HPLC: high-performance liquid chromatography
KEGG: Kyoto Encyclopedia of Genes and Genomes
KI: Kovats index
MS: mass spectrometry
MUFA: monounsaturated fatty acids
PCA: principal component analysis
PUFA: polyunsaturated fatty acids
QA: quality assurance
QC: quality control
RT: retention time
SI: similarity index
SQC: solvent quality control
The supplementary Table S1 for this article is available at: https://www.explorationpub.com/uploads/Article/file/1010100_sup_1.pdf.
The authors express their gratitude to the Vice-Rectory of Research and Graduate Studies of the Universidad de Caldas for funding the project. To the Ministry of Science, Technology and Innovation for the support received through the call 907: “Convocatoria jóvenes investigadores e innovadores en el marco de la reactivación económica 2021” and to the Secretary of Agriculture of the Department of Caldas for providing the samples used during this research.
JPBA: Writing—original draft, Formal analysis, Visualization. APO: Methodology, Software. JETS and EAVN: Investigation, Supervision. JAFL: Investigation, Validation. GTO: Writing—review & editing, Funding acquisition. All authors read and approved the submitted version.
The authors declare that they have no conflict of interest with respect to the content of this article. Likewise, they declare that there is no conflict of interest among the entities involved in the financing of this project.
Not applicable.
Not applicable.
Not applicable.
The author, Juan Pablo Betancourt Arango [chemquantum@outlook.com], will make the data of this research available to any researcher.
Ministry of Science, Technology and Innovation of Colombia and Vice-Rectory of Research and Graduate Studies of the Universidad de Caldas. The funders had no role in study design, data collection and analysis, decision to publish, or preparation of the manuscript.
© The Author(s) 2025.
Open Exploration maintains a neutral stance on jurisdictional claims in published institutional affiliations and maps. All opinions expressed in this article are the personal views of the author(s) and do not represent the stance of the editorial team or the publisher.
Copyright: © The Author(s) 2025. This is an Open Access article licensed under a Creative Commons Attribution 4.0 International License (https://creativecommons.org/licenses/by/4.0/), which permits unrestricted use, sharing, adaptation, distribution and reproduction in any medium or format, for any purpose, even commercially, as long as you give appropriate credit to the original author(s) and the source, provide a link to the Creative Commons license, and indicate if changes were made.