Original Article


Affiliation:
1Department of Family Medicine, Bakırköy Dr. Sadi Konuk Training and Research Hospital, University of Health Sciences, 34140 Istanbul, Türkiye
ORCID: https://orcid.org/0009-0000-2781-8476

 ,
,
Affiliation:
1Department of Family Medicine, Bakırköy Dr. Sadi Konuk Training and Research Hospital, University of Health Sciences, 34140 Istanbul, Türkiye
Email: drozlems@hotmail.com
ORCID: https://orcid.org/0000-0002-7512-1283
 ,
,
Affiliation:
2Department of Endocrinology and Metabolism, Bakırköy Dr. Sadi Konuk Training and Research Hospital, University of Health Sciences, 34140 Istanbul, Türkiye
ORCID: https://orcid.org/0000-0003-3431-0915
Explor Endocr Metab Dis. 2026;3:101479 DOI: https://doi.org/10.37349/eemd.2026.101479
Received: March 09, 2026 Accepted: June 22, 2026 Published: July 20, 2026
Academic Editor: Karel Pacak, Center of Adrenal Endocrine Tumors, Czech Republic
Aim: The aim of this study was to investigate the relationship between the triglyceride-glucose (TyG) index and hormonal, biochemical, and lipid parameters in patients with polycystic ovary syndrome (PCOS).
Methods: In this retrospective single-center study, 2,243 outpatient records were reviewed. Among 696 patients diagnosed with PCOS between 2015 and 2022, 233 newly diagnosed and treatment-naive patients were included. TyG was calculated using fasting triglyceride and glucose values. Correlations between TyG and laboratory parameters were assessed. The optimal TyG cut-off for insulin resistance was evaluated using HOMA-IR and receiver operating characteristic analysis.
Results: TyG was positively correlated with HbA1c, age, LDL cholesterol, total cholesterol, non-HDL cholesterol, insulin, and HOMA-IR, and negatively correlated with HDL cholesterol. The optimal TyG cut-off was 8.67, with an AUC of 0.709, sensitivity of 50.49%, and specificity of 85.38%. Patients with TyG values above the cut-off had higher age, insulin, LDL cholesterol, total cholesterol, non-HDL cholesterol, and HbA1c values, whereas HDL cholesterol and estradiol levels were lower.
Conclusions: TyG was associated with insulin resistance markers and dyslipidemic parameters in patients with PCOS. These findings support the potential clinical utility of TyG as a simple surrogate marker for metabolic risk assessment in PCOS.
Polycystic ovary syndrome (PCOS) is the most common endocrine disorder among women of reproductive age [1]. It affects approximately 8%–13% of women in this demographic. It is characterized by polycystic-appearing ovaries, insulin resistance, clinical or biochemical hyperandrogenism, and ovulatory dysfunction. The syndrome’s diagnosis is based on the Rotterdam criteria (oligo/anovulation, polycystic ovaries, and hyperandrogenism). Insulin activity in the central nervous system is essential for ovulation. Insulin resistance can delay ovulation or result in smaller oocytes [2]. Obesity, along with impaired lipid profile and insulin resistance, exacerbates hyperandrogenism symptoms, creating a vicious cycle that promotes the development of PCOS [3].
The triglyceride-glucose index (TyG) is a simple, reliable, accessible, and cost-effective screening method for insulin resistance, which was first demonstrated in a study by Guerrero-Romero et al. in 2010 [4]. A study by Bilginer et al. further supported its clinical application in identifying and tracking insulin resistance [5]. The present study investigated the relationship between the TyG index and hormonal, biochemical, and lipid parameters in patients with PCOS.
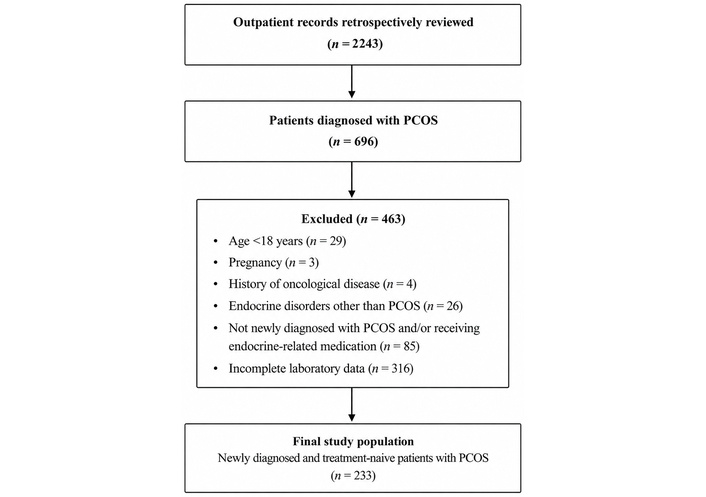
This retrospective, single-center study was conducted using outpatient records from the Endocrinology and Metabolism clinics of University of Health Sciences Bakırköy Dr. Sadi Konuk Training and Research Hospital between 2015 and 2022. A total of 2,243 outpatient records were retrospectively reviewed. Among these, 696 patients had a diagnosis of PCOS. After applying the inclusion and exclusion criteria, 463 patients were excluded: 29 were younger than 18 years, 3 were pregnant, 4 had a history of oncological disease, 26 had endocrine disorders other than PCOS, 85 were not newly diagnosed with PCOS and/or were receiving endocrine-related medication, and 316 had incomplete laboratory data. Finally, 233 newly diagnosed and treatment-naive patients with PCOS were included in the final analysis (Figure 1).
Inclusion criteria were female sex, age ≥ 18 years, newly diagnosed PCOS according to the Rotterdam criteria, presentation to the Endocrinology and Metabolism outpatient clinic during the study period, and availability of fasting glucose and triglyceride values for TyG calculation with sufficient laboratory data for analysis. Exclusion criteria were age < 18 years, pregnancy, history of oncological disease, endocrine disorders other than PCOS, not being newly diagnosed with PCOS, use of endocrine-related medication or treatment for PCOS/metabolic abnormalities, and incomplete laboratory data.
The medical history and laboratory findings of the patients were reviewed retrospectively through the hospital information management system. Data on age, HOMA-IR, insulin, glucose, triglycerides, HDL cholesterol, LDL cholesterol, non-HDL cholesterol, total cholesterol, TSH, free T4, FSH, LH, estradiol, free testosterone, HbA1c, 25-OH vitamin D, and DHEA-S levels were collected.
All venous blood samples were collected between 08:30 and 10:30 a.m. after overnight fasting. All biochemical and hormonal measurements were performed in the same central laboratory of Bakırköy Dr. Sadi Konuk Training and Research Hospital. Serum glucose was measured using the photometric hexokinase method on a Roche cobas 8000 c702 module (Roche Diagnostics, Germany). Serum triglycerides, total cholesterol, and HDL cholesterol were measured using photometric enzymatic colorimetric methods on the same analyzer. LDL cholesterol was primarily calculated using the Friedewald formula: LDL cholesterol = total cholesterol – HDL cholesterol – triglycerides/5. In samples with triglyceride levels > 400 mg/dL, LDL cholesterol was measured directly using a homogeneous enzymatic colorimetric method on the Roche cobas 8000 c702 module. Serum insulin, TSH, free T4, FSH, LH, estradiol, and DHEA-S levels were measured using the electrochemiluminescence immunoassay method on a Roche cobas 8000 e602 module (Roche Diagnostics, Germany). Free testosterone was measured using a competitive chemiluminescence immunoassay method on an IDS-iSYS automated immunoassay analyzer (Immunodiagnostic Systems Limited, United Kingdom). HbA1c was measured from EDTA whole blood using high-performance liquid chromatography based on cation-exchange chromatography on an ADAMS A1c HA-8180V analyzer (ARKRAY Inc.).
The TyG index was calculated using the formula: TyG = Ln [fasting TG (mg/dL) × fasting glucose (mg/dL)/2].
The HOMA-IR was used to determine the presence of insulin resistance among the study participants and was calculated as follows: HOMA-IR = fasting glucose (mg/dL) × fasting insulin (mU/L)/405. Patients with HOMA-IR > 2.5 were considered to have insulin resistance. Receiver operating characteristic (ROC) curve analysis based on HOMA-IR values was used to investigate the optimal cut-off value for the TyG index. Patients were divided into two groups according to the optimal TyG cut-off value, and differences between groups were evaluated.
All data were recorded and analyzed using SPSS (Statistical Package for Social Sciences) for Windows, version 22. Normality was evaluated using the Kolmogorov-Smirnov test, skewness and kurtosis values, and histogram graphs. Descriptive data were summarized as mean ± standard deviation for continuous variables. The ROC curve analysis was applied to investigate the diagnostic performance of the TyG index for insulin resistance. Independent-samples t-test or Mann-Whitney U-test was used to compare variables between two independent groups, as appropriate. Pearson’s correlation coefficient was employed to examine relationships between numerical variables. Because multiple biochemical and hormonal parameters were evaluated, the analyses should be interpreted as exploratory. A p-value of < 0.05 was considered statistically significant in all analyses. In the tables and text, p values reported as 0.00 in the original statistical output were expressed as p < 0.001.
ROC curve analysis was performed to evaluate the ability of the TyG index to discriminate insulin-resistant patients from non-insulin-resistant patients. HOMA-IR > 2.5 was used as the reference criterion for insulin resistance. The optimal TyG cut-off value was determined using the Youden index, calculated as sensitivity + specificity – 1. The cut-off point with the highest Youden index was accepted as the optimal threshold. Sensitivity, specificity, positive likelihood ratio, negative likelihood ratio, area under the curve (AUC), and 95% confidence interval (CI) were calculated.
The descriptive characteristics of the patients included in the study (n = 233) are presented in Table 1.
Descriptive characteristics of the patients
| Variable | Mean ± SD | n | Unit | Reference range/interpretive value |
|---|---|---|---|---|
| Age | 28.71 ± 6.35 | 233 | years | Adult reproductive-age cohort |
| Glucose | 90.37 ± 10.33 | 233 | mg/dL | 70–100 fasting |
| Triglyceride | 115.95 ± 69.10 | 233 | mg/dL | < 150 |
| Insulin | 13.36 ± 9.85 | 217 | mIU/mL | 2.6–24.9 |
| LDL cholesterol | 113.95 ± 35.87 | 201 | mg/dL | < 100 |
| Total cholesterol | 188.48 ± 43.26 | 214 | mg/dL | < 200 |
| Non-HDL cholesterol | 141.47 ± 46.82 | 193 | mg/dL | < 130 |
| HDL cholesterol | 54.31 ± 13.25 | 193 | mg/dL | > 50 |
| HbA1c | 5.30 ± 0.33 | 162 | % | < 5.7 normal |
| 25-OH vitamin D | 20.78 ± 12.42 | 131 | ng/mL | < 20 deficient; 20–29 insufficient; ≥ 30 sufficient |
| TyG | 8.42 ± 0.52 | 233 | Calculated index; no universal reference range | |
| DHEA-S | 278.50 ± 108.98 | 188 | µg/dL | 145–395 |
| Estradiol | 55.03 ± 54.21 | 164 | pg/mL | Cycle-phase dependent |
| LH | 8.40 ± 6.15 | 166 | IU/L | Cycle-phase dependent |
| FSH | 6.34 ± 3.30 | 169 | mIU/mL | Cycle-phase dependent |
| HOMA-IR | 3.03 ± 2.61 | 216 | ≤ 2.5 non-insulin-resistant; > 2.5 insulin-resistant | |
| Free testosterone | 0.54 ± 0.27 | 175 | ng/dL | 0.13–1.00 |
The findings of the Pearson correlation analysis between TyG and HOMA-IR, age, insulin level, lipid parameters, hormonal parameters, HbA1c, and 25-OH vitamin D levels are presented in Table 2.
Pearson correlation analysis between TyG and laboratory parameters.
| Variable | r | p value |
|---|---|---|
| HOMA-IR | 0.40 | p < 0.001 |
| Age | 0.16 | 0.01 |
| Insulin | 0.40 | p < 0.001 |
| LDL cholesterol | 0.35 | p < 0.001 |
| Total cholesterol | 0.45 | p < 0.001 |
| Non-HDL cholesterol | 0.33 | p < 0.001 |
| HDL cholesterol | –0.23 | p < 0.001 |
| DHEA-S | –0.10 | 0.16 |
| Estradiol | –0.09 | 0.27 |
| LH | –0.14 | 0.08 |
| FSH | –0.04 | 0.60 |
| Free testosterone | –0.02 | 0.78 |
| HbA1c | 0.27 | p < 0.001 |
| 25-OH vitamin D | 0.03 | 0.72 |
A statistically significant positive correlation was found between TyG values and HbA1c, age, LDL cholesterol, total cholesterol, non-HDL cholesterol, insulin, and HOMA-IR. A weak negative correlation was found between TyG values and HDL cholesterol. No significant relationship was detected between TyG and DHEA-S, estradiol, LH, FSH, free testosterone, or 25-OH vitamin D levels.
Insulin resistance was assessed using HOMA-IR. Of the 233 patients included in the study, HOMA-IR could be calculated in 216 patients with available fasting glucose and insulin values. Among these patients, 103 had HOMA-IR > 2.5 and 113 had HOMA-IR ≤ 2.5. The ROC curve analysis was performed using HOMA-IR > 2.5 as the reference criterion for insulin resistance. The optimal cut-off value for TyG was calculated using HOMA-IR values and the Youden index (Table 3). The ROC curve analysis is shown in Figure 2.
ROC curve analysis results for the TyG index.
| Variable | Cut-off value | AUC | 95% CI | p value | Sensitivity, % | 95% CI | Specificity, % | 95% CI | +LR | –LR | Youden index |
|---|---|---|---|---|---|---|---|---|---|---|---|
| TyG | 8.67 | 0.709 | 0.646–0.767 | p < 0.001 | 50.49 | 40.5–60.5 | 85.38 | 78.1–91.0 | 3.45 | 0.58 | 0.359 |
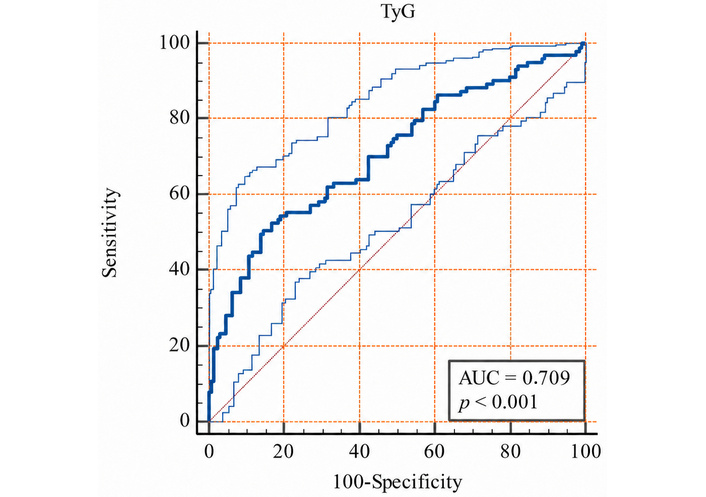
Receiver operating characteristic curve analysis of the TyG index for detecting insulin resistance based on HOMA-IR.
Patients were divided into two groups according to the TyG cut-off value of 8.67. Significant differences between the groups were investigated for the parameters included in the study. The results are presented in Table 4, and the distribution of variables in both groups is shown in Figure 3.
Analysis of differences between the two groups created based on the TyG cut-off value.
| Variable | TyG ≤ 8.67, mean ± SD | TyG > 8.67, mean ± SD | Test statistic | p value |
|---|---|---|---|---|
| Age, years | 28.08 ± 6.01 | 30.10 ± 6.96 | t = –2.25 | 0.03 |
| Insulin, mIU/mL | 10.97 ± 7.00 | 18.45 ± 12.77 | t = –5.55 | p < 0.001 |
| LDL cholesterol, mg/dL | 107.83 ± 31.99 | 130.13 ± 52.26 | t = –3.12 | p < 0.001 |
| Total cholesterol, mg/dL | 177.95 ± 37.14 | 211.60 ± 46.90 | t = –5.65 | p < 0.001 |
| Non-HDL cholesterol, mg/dL | 126.78 ± 47.87 | 156.39 ± 60.08 | t = –3.96 | p < 0.001 |
| HDL cholesterol, mg/dL | 55.83 ± 12.45 | 51.04 ± 14.40 | t = 2.36 | 0.02 |
| DHEA-S, µg/dL | 283.45 ± 111.82 | 262.68 ± 107.27 | t = 1.19 | 0.24 |
| Estradiol, pg/mL | 60.75 ± 60.93 | 42.38 ± 32.10 | t = 2.03 | 0.04 |
| LH, IU/L | 9.01 ± 6.14 | 7.04 ± 6.01 | t = 1.92 | 0.06 |
| FSH, mIU/mL | 6.34 ± 3.57 | 6.35 ± 2.62 | t = –0.01 | 0.99 |
| Free testosterone, ng/dL | 0.56 ± 0.27 | 0.53 ± 0.27 | t = 0.58 | 0.56 |
| HbA1c, % | 5.25 ± 0.28 | 5.47 ± 0.60 | t = –3.22 | p < 0.001 |
| 25-OH vitamin D, ng/mL | 19.91 ± 13.12 | 22.47 ± 10.92 | t = –1.73 | 0.08 |
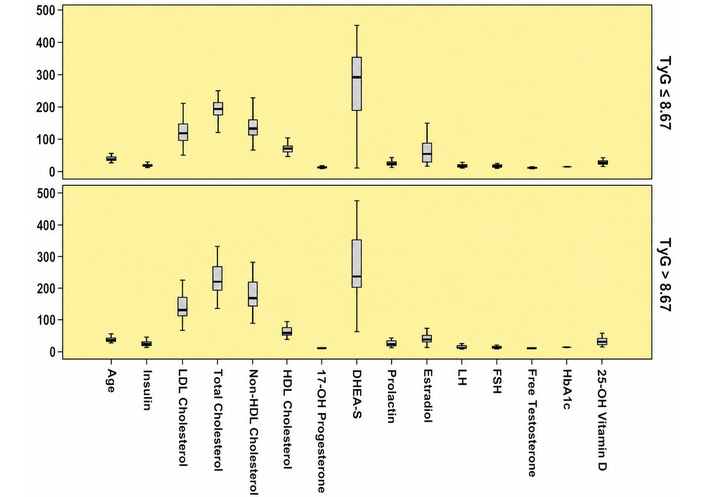
Distribution of biochemical, hormonal, and lipid parameters according to TyG groups.
Statistically significant differences were found in age, insulin, LDL cholesterol, total cholesterol, non-HDL cholesterol, HDL cholesterol, estradiol, and HbA1c values between groups based on the TyG cut-off value. Patients with TyG values above the cut-off had higher age, insulin, LDL cholesterol, total cholesterol, non-HDL cholesterol, and HbA1c values than those below the cut-off. Conversely, HDL cholesterol and estradiol levels were lower in patients with TyG values above the cut-off.
Of the 216 patients with available HOMA-IR values, 113 had HOMA-IR ≤ 2.5 and 103 had HOMA-IR > 2.5. Patients with insulin resistance had significantly higher fasting glucose, triglyceride, insulin, HOMA-IR, TyG index, and HbA1c values compared with those without insulin resistance. In contrast, HDL cholesterol and LH levels were significantly lower in the insulin-resistant group. No significant differences were observed between the groups in terms of age, LDL cholesterol, total cholesterol, non-HDL cholesterol, 25-OH vitamin D, DHEA-S, estradiol, FSH, or free testosterone. The comparison of metabolic, lipid, biochemical, and hormonal parameters according to insulin resistance status is presented in Table 5.
Comparison of metabolic, lipid, biochemical, and hormonal parameters according to insulin resistance status in patients with PCOS.
| Variable | HOMA-IR ≤ 2.5, mean ± SD | HOMA-IR > 2.5, mean ± SD | p value |
|---|---|---|---|
| Age, years | 29.23 ± 6.75 | 28.37 ± 5.97 | 0.444 |
| Glucose, mg/dL | 87.92 ± 7.30 | 92.74 ± 11.94 | 0.002 |
| Triglyceride, mg/dL | 93.86 ± 41.89 | 142.96 ± 84.34 | p < 0.001 |
| Insulin, mIU/mL | 7.20 ± 2.24 | 20.13 ± 10.52 | p < 0.001 |
| HOMA-IR | 1.57 ± 0.52 | 4.65 ± 3.02 | p < 0.001 |
| TyG index | 8.23 ± 0.41 | 8.64 ± 0.56 | p < 0.001 |
| LDL cholesterol, mg/dL | 112.42 ± 33.27 | 119.05 ± 48.94 | 0.577 |
| Total cholesterol, mg/dL | 184.63 ± 41.25 | 193.01 ± 47.22 | 0.281 |
| Non-HDL cholesterol, mg/dL | 132.75 ± 50.10 | 137.78 ± 58.88 | 0.321 |
| HDL cholesterol, mg/dL | 57.57 ± 12.89 | 51.21 ± 13.14 | p < 0.001 |
| HbA1c, % | 5.21 ± 0.29 | 5.39 ± 0.34 | 0.003 |
| 25-OH vitamin D, ng/mL | 21.02 ± 13.22 | 20.42 ± 11.44 | 0.994 |
| DHEA-S, µg/dL | 276.70 ± 108.77 | 273.40 ± 106.42 | 0.839 |
| Estradiol, pg/mL | 47.15 ± 39.41 | 62.41 ± 66.10 | 0.217 |
| LH, IU/L | 9.38 ± 6.40 | 7.45 ± 5.95 | 0.019 |
| FSH, mIU/mL | 6.83 ± 4.04 | 5.82 ± 2.16 | 0.086 |
| Free testosterone, ng/dL | 0.55 ± 0.23 | 0.53 ± 0.30 | 0.200 |
Values are presented as mean ± standard deviation. HOMA-IR > 2.5 was accepted as insulin resistance.
PCOS is the most common endocrine disorder observed in women of reproductive age, representing a significant burden on the healthcare system. The TyG index stands out as a cost-effective method for determining insulin resistance.
This study was conducted with the aim of establishing a TyG cut-off value as an insulin resistance marker and examining the relationship between TyG and other clinical parameters. In the present study, a statistically significant positive correlation was observed between TyG and HbA1c, and HbA1c values were higher in patients with TyG values above the cut-off and in patients with insulin resistance. These findings indicate that higher TyG values identify a subgroup with a less favorable glycemic-metabolic profile. This should not be interpreted as TyG replacing HbA1c; rather, TyG may provide additional supportive information for metabolic risk stratification in PCOS. Correlation analysis evaluates the continuous relationship between two variables, whereas group comparison evaluates whether predefined clinical or metabolic subgroups differ in their mean values. Therefore, the significant between-group differences in HbA1c are compatible with the observed positive correlation between TyG and HbA1c. Nandhini et al. and Babic et al. also reported associations between TyG-related indices and HbA1c or glycemic control [6, 7].
The comparison between insulin-resistant and non-insulin-resistant patients provides additional insight into the metabolic phenotype of PCOS. Patients with HOMA-IR > 2.5 had significantly higher fasting glucose, triglyceride, insulin, HOMA-IR, TyG index, and HbA1c values, together with significantly lower HDL cholesterol levels. This pattern is compatible with the expected metabolic profile of insulin resistance, characterized by hyperinsulinemia, impaired glucose metabolism, hypertriglyceridemia, and reduced HDL cholesterol. Although LDL cholesterol, total cholesterol, and non-HDL cholesterol were numerically higher in the insulin-resistant group, these differences did not reach statistical significance.
As insulin resistance increases, disruptions in fat metabolism and an atherogenic dyslipidemia pattern in lipid parameters are expected [3]. Mahdavi-Roshan et al. identified elevated TyG values as a risk factor associated with coronary artery disease and atherogenic indices [8]. Similarly, Kaplangoray et al. demonstrated a significant association between TyG and coronary slow flow [9]. Various studies have shown relationships between the TyG index and vascular target organ damage or obstructive coronary artery disease [10–12]. In addition, TyG and TyG-related indices have been associated with broader cardiometabolic outcomes, including type 2 diabetes prediction, lipid profile changes, and pregnancy-related metabolic alterations [13–15]. Consistent with the literature, the present study identified a statistically significant positive correlation between TyG values and LDL cholesterol, total cholesterol, and non-HDL cholesterol levels, whereas a negative correlation was observed between TyG values and HDL cholesterol. In addition, patients with higher TyG values had a more dyslipidemic profile. Recent systematic evidence further supports the metabolic relevance of TyG in PCOS. Javidan et al. reported in a systematic review and meta-analysis that TyG values were significantly higher in women with PCOS than in non-PCOS controls and that TyG showed diagnostic value for metabolic disturbances in PCOS [16]. Morshed et al. also showed that TyG was associated with insulin resistance in women with PCOS, although its discriminatory performance was limited compared with some anthropometric-combined indices [17]. These findings support the interpretation that TyG is a practical supportive marker of cardiometabolic risk rather than a standalone diagnostic test.
The optimum TyG cut-off value as an indicator of insulin resistance can vary according to age group, sex, ethnicity, disease phenotype, laboratory methods, the definition used for insulin resistance, and the mathematical expression of the TyG formula. Importantly, reported cut-off values should be interpreted according to the formula used in each study, because formulas expressed as ln(TG × glucose)/2 and ln[(TG × glucose)/2] generate different numerical scales. Brito et al. reported cut-off values of 7.9 for boys and 8.1 for girls in a pediatric population [18]. Guerrero-Romero et al. reported an optimal TyG cut-off value of 4.68 using their formula and study population [4], whereas Locateli et al. reported a cut-off value of > 4.44 for predicting insulin resistance in overweight and obese children and adolescents [19]. Varying cut-off values have also been reported in patients with PCOS. Zheng et al. reported an optimum cut-off value of 8.51 [20], whereas Gawade et al. reported an optimal TyG cut-off value of 4.55 [21]. More recently, Rhaiem et al. reported a TyG cut-off value of 8.31 for discriminating insulin resistance in women with PCOS using HOMA-IR- and SHBG-based criteria [22]. In the present study, the optimum cut-off value was calculated as 8.67 using HOMA-IR > 2.5 as the reference criterion and the Youden index as the threshold selection method. At this threshold, the specificity was high, whereas sensitivity was moderate. Therefore, a TyG value above 8.67 may help identify PCOS patients with a higher probability of insulin resistance and an unfavorable metabolic profile, but a lower TyG value should not be used alone to exclude insulin resistance. The differences between reported cut-off values likely reflect formula expression, methodological differences, population characteristics, and insulin resistance definitions; therefore, population-specific validation remains necessary.
The potential value of combined metabolic indices has also been emphasized in recent studies. Li et al. reported that the TyG-BMI index was associated with IVF-related outcomes in women with PCOS, suggesting that insulin resistance and lipid metabolism may also be related to reproductive outcomes [23]. However, height, weight, BMI, and waist circumference were not available in the present retrospective dataset. Therefore, TyG-BMI or TyG-waist circumference indices could not be evaluated. This limitation is clinically relevant because recent evidence suggests that indices incorporating anthropometric measurements may outperform TyG alone for identifying insulin resistance in PCOS [17].
Estradiol is one of the active forms of estrogen found in the blood and is produced primarily by the ovaries. Insulin resistance affects the conversion of androgens to estrogens in women. In the present study, lower estradiol levels were observed in the group with elevated TyG values. A study by Yan et al. demonstrated that estrogen replacement therapy reduces insulin resistance and lowers plasma glucose levels [24]. The difference in estradiol levels between the groups may be related to the effect of insulin resistance on androgen-to-estrogen conversion and impaired estrogen production mechanisms in patients with PCOS.
Although the relationship between insulin resistance and vitamin D is not fully understood, studies on various conditions commonly associated with insulin resistance, such as diabetes mellitus, PCOS, obesity, and metabolic syndrome, have observed an association between vitamin D levels and insulin resistance. Szymczak-Pajor et al. emphasized that vitamin D deficiency and insufficiency are associated with insulin resistance, suggesting that the molecular background of insulin resistance may be connected to vitamin D deficiency and that vitamin D treatment could be used in the near future for diseases associated with insulin resistance [25]. Other studies have also identified a relationship between insulin resistance and vitamin D levels [26–28]. Although no significant correlation was observed between TyG values and 25-OH vitamin D levels in the present study, the mean 25-OH vitamin D level was close to the deficiency-insufficiency threshold. Further studies are needed to clarify the association between vitamin D, TyG, insulin resistance, and PCOS.
Recently, the terminology of PCOS has been reconsidered, and the term polyendocrine metabolic ovarian syndrome (PMOS) has been proposed to better reflect the multisystem endocrine and metabolic nature of the condition [29]. This terminology shift emphasizes that the syndrome is not limited to ovarian morphology or reproductive dysfunction but also includes metabolic disturbances such as insulin resistance, dyslipidemia, and increased cardiometabolic risk. In this context, the significant associations observed in the present study between TyG and HOMA-IR, insulin, HbA1c, and lipid parameters support the metabolic dimension of the syndrome and are consistent with the rationale underlying the proposed terminology shift.
This study has several limitations. First, the retrospective and single-center design may introduce selection bias and limit the generalizability of the findings. Second, although all included patients were newly diagnosed and treatment-naive, the retrospective design limited the availability of some clinical variables. In particular, height, weight, and BMI data were not available for all patients; therefore, BMI could not be calculated reliably and BMI-based subgroup analysis could not be performed. Third, although all blood samples were obtained after overnight fasting in the morning, the retrospective nature of the study may limit the ability to verify all pre-analytical conditions beyond the recorded sampling protocol. Finally, because multiple biochemical and hormonal parameters were evaluated, the possibility of type I error due to multiple comparisons should be considered.
The TyG index has emerged as a potential method for detecting insulin resistance. The results obtained in the present study demonstrated that elevated TyG levels have significant potential for predicting key markers of glycemic control, including HbA1c, HOMA-IR, and insulin levels. The correlation between elevated TyG values and dyslipidemic blood parameters suggests that TyG aligns with impaired cholesterol levels and may serve as a practical surrogate marker for cardiometabolic risk assessment in patients with PCOS. Future prospective and multicenter studies including anthropometric variables such as BMI are needed to further clarify the relationship between TyG and hormonal, biochemical, and metabolic parameters in PCOS.
PCOS: polycystic ovary syndrome
ROC: receiver operating characteristic
TyG: triglyceride-glucose
HG, ÖP, and MM: Conceptualization, Methodology, Data curation, Formal analysis, Investigation, Writing—original draft, Writing—review & editing, Supervision. All authors read and approved the final manuscript.
The authors declare that they have no relevant financial or non-financial interests to disclose.
This retrospective study was approved by Bakırköy Dr. Sadi Konuk Hospital Ethics Committee (Date: 06.02.2023, Protocol No: 2023/70, Decision No: 2023-03-14) and conducted in accordance with the requirements of the Declaration of Helsinki.
Informed consent was waived due to the retrospective nature of the study.
Not applicable.
The datasets analyzed during the current study are available from the corresponding author on reasonable request.
This research did not receive any specific grant from funding agencies in the public, commercial, or not-for-profit sectors.
© The Author(s) 2026.
Open Exploration maintains a neutral stance on jurisdictional claims in published institutional affiliations and maps. All opinions expressed in this article are the personal views of the author(s) and do not represent the stance of the editorial team or the publisher.
Copyright: © The Author(s) 2026. This is an Open Access article licensed under a Creative Commons Attribution 4.0 International License (https://creativecommons.org/licenses/by/4.0/), which permits unrestricted use, sharing, adaptation, distribution and reproduction in any medium or format, for any purpose, even commercially, as long as you give appropriate credit to the original author(s) and the source, provide a link to the Creative Commons license, and indicate if changes were made.



View: 1021
Download: 24
Times Cited: 0