 Original Article


Affiliation:
1LifeScan Scotland Ltd, IV2 3ED Inverness, UK
Email: mgrady@lifescan.com
ORCID: https://orcid.org/0000-0002-8006-1844


 ,
,
Affiliation:
1LifeScan Scotland Ltd, IV2 3ED Inverness, UK
ORCID: https://orcid.org/0009-0005-2017-5099
,
Affiliation:
1LifeScan Scotland Ltd, IV2 3ED Inverness, UK
ORCID: https://orcid.org/0009-0009-8185-9741
,
Affiliation:
2LifeScan Enterprises LLC, Malvern, PA 19355, USA
ORCID: https://orcid.org/0000-0003-4329-3379
Explor Endocr Metab Dis. 2026;3:101478 DOI: https://doi.org/10.37349/eemd.2026.101478
Received: February 02, 2026 Accepted: June 24, 2026 Published: July 16, 2026
Academic Editor: Charlotte Steenblock, University Clinic Carl Gustav Carus, Germany
Aim: Assess the benefits of using a diabetes app and connected blood glucose (BG) meter in people with type 2 diabetes (PwT2D) with higher-than-recommended mean BG. It is well understood that sustained higher levels of glycemia are linked to diabetes related complications and that early intervention to reduce hyperglycemia is an important clinical goal.
Methods: We sourced server data from a total population of 22,696 PwT2D using the OneTouch Reveal diabetes app in conjunction with a OneTouch Verio Flex or Reflect BG meter. We identified three groups (mean BG > 180, > 155, and between > 155 and < 180 mg/dL) at higher risk for diabetes-associated complications based on their hyperglycemia. Data from their first 14 days using the app was compared with the last 14 days at the end of each timeframe, using paired within-subject differences.
Results: At 1 year in PwT2D with baseline mean BG > 155 mg/dL, readings in range (RIR) improved by 24.0%, and mean BG decreased by 35.9 mg/dL, from 196.4 mg/dL to 160.5 mg/dL. These improvements were due to reductions in hyperglycemic readings. Subjects with the highest baseline mean BG of > 180 mg/dL had the greatest reduction (–54.3 mg/dL) in mean BG after experiencing the new app and meter for 1 year. Those engaging more often with the app had greater improvements in glycemia.
Conclusions: In PwT2D with higher-than-recommended mean BG, substantial improvements in glycemia were associated with subjects using a diabetes app with a connected blood glucose meter at 3 months, and these improvements were sustained out to 1-year.
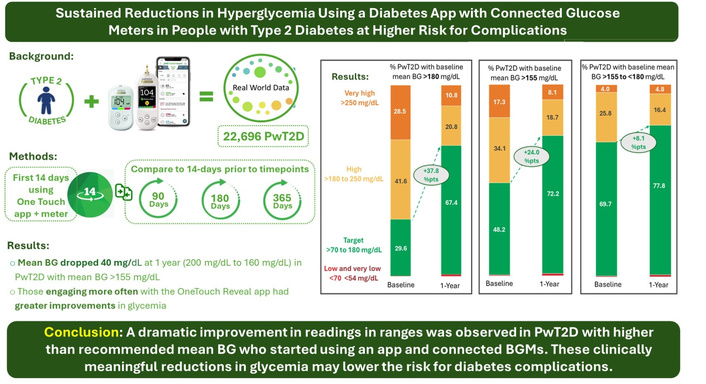
The importance of attaining glycemic targets and the need to minimize hyperglycemia in people with type 2 diabetes (PwT2D) is amply described in diabetes care standards and consensus statements [1, 2]. Specifically, evidence supports early intervention to limit prolonged exposure to hyperglycemia and achieve lower mean blood glucose (BG) to avoid future complications [3, 4]. Furthermore, analysis of the follow-up to the United Kingdom Prospective Diabetes Study in PwT2D concluded that historically higher A1c values were associated with adverse clinical outcomes [5]. The now-familiar ambulatory glucose profile (AGP) report, commonly used to summarize continuous glucose monitoring (CGM) and blood glucose monitoring (BGM) data, recommends an estimated mean BG below 154 mg/dL, equivalent to an A1c of < 7% [1, 6]. However, in practice, many people with diabetes (PWDs) far exceed this recommended goal. Aggregated data compiled from US health plans, largely from people with type 1 and T2D in primary care settings, found that 28 to 45% of health plan members (in Commercial, Medicare, and Medicaid programs) had A1c levels > 8%, equivalent to a mean BG above 183 mg/dL [7]. These concerning trends mirror those of a retrospective analysis of National Health and Nutrition Examination Survey data that observed glycemic management deteriorated over time, from 62% of PWDs achieving an A1c < 7% in 2001–2002 to only 45% in 2021–2023 [8].
The term “uncontrolled diabetes” has been widely used to describe people with A1c levels > 8% or 9%, who are therefore at higher risk for future diabetes-associated complications. A retrospective study at the Cleveland Clinic that sought to characterise this cohort found only a minority (23.7%) of PWDs with a starting A1c > 9% achieved an A1c of < 8% after 1 year, with the authors postulating that a pursuit of more frequent patient engagement and more tailored drug regimens might improve A1c goal attainment [9]. In addition to A1c, mean BGs are also a strong marker of diabetes management, and studies using CGM have provided a more nuanced picture of the correlation between these markers. As examples, in one study, non-insulin-using Pw2D, with a mean A1c of 8.4%, had a CGM-measured mean BG of 184 mg/dL [10], and in the DIAMOND CGM study, insulin-using PwT2D, with a mean A1c of 8.5%, had a CGM-measured mean BG of 176 mg/dL [11]. Furthermore, a real-world analysis of app-derived data in PwT2D not using insulin found that CGM use was associated with improved glycemia over 1-year and that usage of a high alert feature on the app was positively associated with better outcomes [12].
A prior publication by our group [13] used a similar methodology to this current report and found improved glycemic outcomes in 55,000 people with both type 1 and T2D, and also observed that people 65 years or older had the strongest affinity to our diabetes app. This current study focused on a PwT2D with an elevated mean BG at baseline within a large real-world evidence (RWE) dataset of PwT2D who were using the same diabetes app with a connected BG meter. We isolated the data from these people to determine how experiencing their new app and BGM device affected mean BG and other glycemic metrics over their first year of using the app and connected meter.
We sourced server data from PwT2D using the OneTouch Reveal app in conjunction with a OneTouch brand connected BG meter, primarily OneTouch Verio Flex or Verio Reflect meters. These meters present readings using a color range indicator as below range (blue), in range (green), or above range (red). This color feature has been shown to be beneficial to PWDs in multiple studies [14, 15]. After pairing the app and meter, readings automatically appear in the app, which provides a wealth of additional tracking, insight, and reporting features (see Digital Supplement). A professional (web) version of the app allows clinicians to observe data from app users who grant permission to share their data with their healthcare providers. Our analysis relied on self-reported information provided during app registration, including diabetes type, gender, date of birth, and whether insulin was used. A description of how de-identified app data was collected and sent to our LifeScan server has been previously published [16]. App users are informed at the time of app registration about how personal data is processed in accordance with the privacy policy, and on that basis provide consent to use their de-identified data to perform analytics and research. Additional ethics committee approval was not required, and no clinical sites or external investigators were involved. The current analysis includes data from users who first registered their app between 15th September 2015 and 18th December 2023.
We isolated users who registered their app and synced to their Bluetooth® connected meter on the same day and had no readings in their meter memory prior to that date. In keeping with our desire to select subjects with T2D at higher risk for hyperglycemic complications, we identified three groups using the following criteria: 1) baseline mean BG of > 180 mg/dL; 2) baseline mean BG of > 155 mg/dL; and 3) baseline mean BG > 155 and < 180 mg/dL. Furthermore, our criteria required subjects to have performed ≥ 26 BG checks in the first 90 days, ≥ 52 checks in the first 180 days, or ≥ 104 checks in the first 365 days from the date of app registration. Glycemic data from the subjects’ first 14 days using the app (baseline) were compared with the last 14 days at the end of each 90-, 180-, or 365-day timeframe using paired within-subject differences; these within-subject changes were then averaged across all subjects per timepoint. The values in each table represent the mean of all changes per time point. We calculated mean BG and percentage of readings within various glycemic ranges [hypoglycemic (< 54 mg/dL and < 70 mg/dL), readings in tight range (RITR, 70–140 mg/dL), readings in range (RIR, 70–180 mg/dL), and hyperglycemic (> 180 mg/dL and > 250 mg/dL)].
App metrics were used to evaluate the influence of lower or higher app engagement on glycemic outcomes. For each subject, the number of sessions and time spent on the app per week were averaged over the full 90-, 180-, or 365-day period. Based upon the distribution of the app data, two categories of usage were analyzed: subjects who performed ≤ 4 sessions per week and those performing > 4 sessions per week. To evaluate the influence of app engagement on glycemic outcomes, subjects were divided into two groups based on app session frequency (≤ 4 or > 4 sessions per week), and between-group differences in glycemic outcomes at 1 year were assessed using two-sample t-tests.
Our analysis included a total population of 22,696 PwT2D characterised by higher-than-recommended mean BG at baseline. Group 1 (mean BG > 180 mg/dL) contained up to 12,549 subjects; Group 2 (mean BG > 155 mg/dL) contained up to 22,696 subjects; and Group 3 (mean BG > 155 to < 180mg/dL) contained up to 9,787 subjects. The total number of BG readings performed over the full year in Group 1 was 1,218,565, in Group 2 was 2,187,038, and in Group 3 was 932,281. These 22,696 PwT2D represented 4.7% of a total population of 484,048 PwT2D who registered their Reveal app during the retrieval timeframe. This total population included those who registered the app but did no checks or very few. In this regard, the population reduced to 391,461 (5.8% of our sample) if we exclude T2Ds doing ≤ 1 check per week in the first year after registration, and to 277,078 (8.2% of our sample) if we exclude those doing ≤ 2 checks per week in the first year, both of these lower check frequencies, arguably provide limited clinical insight in terms of decision making.
As expected, subjects with the highest baseline mean BG of > 180 mg/dL manifested the greatest reduction (–54.3 mg/dL) in mean BG after experiencing their new app and glucose meter for 1 year, with equally impressive, but proportionately lower, reductions observed in those who had baseline mean BGs close to diabetes guideline recommendations. Despite a wide range (54.5 mg/dL) of pre-intervention (baseline) mean BGs between the 3 groups (ranging from 166.6 to 221.1 mg/dL), a narrower range (15.8 mg/dL) was observed between the groups at 1 year (152.0 to 167.8 mg/dL, Figure 1).
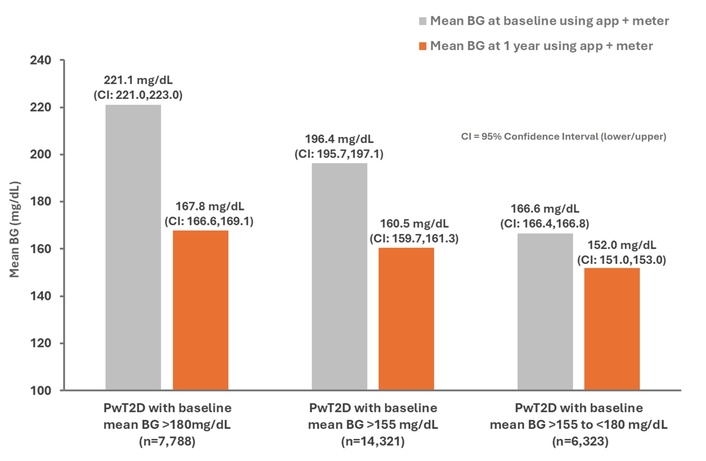
Improvements in mean BG at 1 year in all three study groups. BG: blood glucose; PwT2D: people with type 2 diabetes.
We used the familiar AGP report format (Figure 2) to visually and more easily emphasize changes that occurred in RIR in our subjects. We found that subjects with higher baseline mean BGs achieved greater improvements in RIR over time. The baseline range of RIR was broad at 29.6 to 69.7% across the 3 groups, and this wide range narrowed and improved to 67.4 to 77.8% at 1 year. These changes resulted from proportionate reductions in hyperglycemic readings in each group.
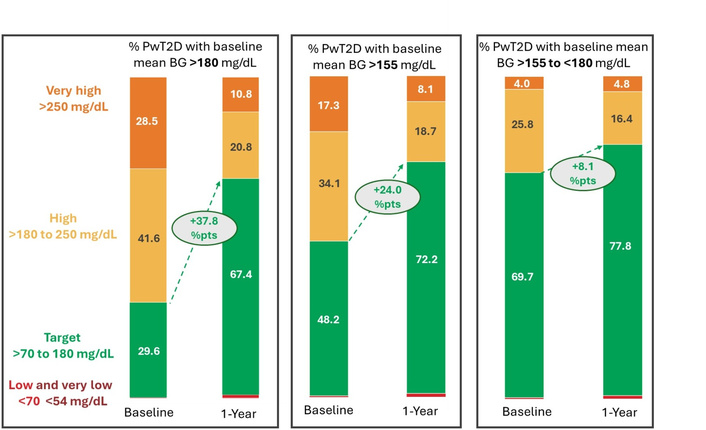
Change in readings in ranges at 1 year presented using the ambulatory glucose profile (AGP) format. BG: blood glucose; PwT2D: people with type 2 diabetes.
Prior sections have focused solely on changes at 1 year, but it is important for improvements to occur promptly to reduce health risks and for patients to see the benefits of their actions to maintain engagement in their diabetes management. Our analysis of all 3 groups demonstrated that almost the entire improvement in mean BG, RIR, and reductions in hyperglycemic readings were achieved by the first 3 months, and these improvements were sustained over 1 year (Figures 3 and 4, see Supplementary material for Group 3). For example, in Group 1, which had baseline mean BG > 180 mg/dL, RIR (70–180 mg/dL) improved by 33.8 percentage points (% pts) at 3 months, by 36.8% pts at 6 months, and by 37.8% pts at 1 year. The relatively new metric, RITR (70–140 mg/dL), provides additional insight into improvements in diabetes management. At baseline in Group 1, RITR comprised only 8.4% of all readings, but this increased considerably (by 26.9% pts) to 35.3% at 3 months and maintained this improvement for the entire year (Figure 3). Subjects in Group 2, who had a lower baseline mean BG of > 155 mg/dL, had 16.1% RITR at baseline, almost twice that seen in Group 1, and this effect was magnified further in subjects in Group 3 (closest to recommended glycemic goals) who had 24.9% RITR at baseline (see Supplementary material).
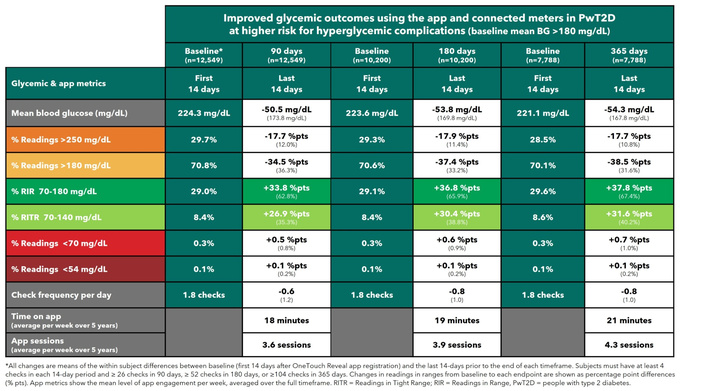
Improved glycemic outcomes in people with T2D with mean baseline BG > 180 mg/dL. *All changes are means of the within-subject differences between baseline (first 14 days after OneTouch Reveal app registration) and the last 14 days prior to the end of each timeframe. Subjects must have at least 4 checks in each 14-day period and ≥ 26 checks in 90 days, ≥ 52 checks in 180 days, or ≥ 104 checks in 365 days. Changes in readings in ranges from baseline to each endpoint are shown as percentage points (% pts) differences. App metrics show the mean level of app engagement per week, averaged over the full timeframe. BG: blood glucose; PwT2D: people with type 2 diabetes; RITR: readings in tight range; RIR: readings in range.
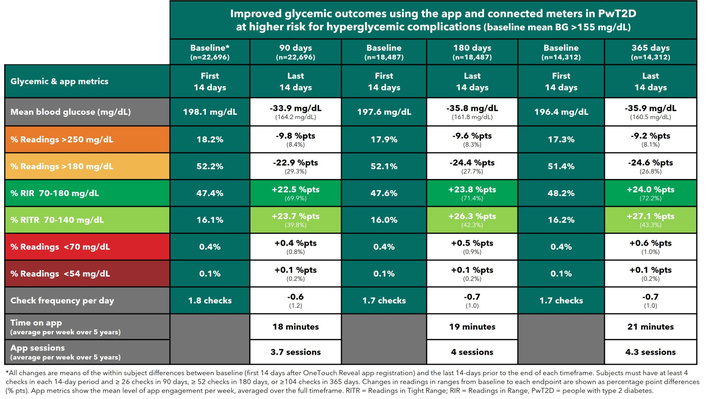
Improved glycemic outcomes in people with T2D with mean baseline BG > 155 mg/dL. *All changes are means of the within-subject differences between baseline (first 14 days after OneTouch Reveal app registration) and the last 14 days prior to the end of each timeframe. Subjects must have at least 4 checks in each 14-day period and ≥ 26 checks in 90 days, ≥ 52 checks in 180 days, or ≥ 104 checks in 365 days. Changes in readings in ranges from baseline to each endpoint are shown as percentage points (% pts) differences. App metrics show the mean level of app engagement per week, averaged over the full timeframe. BG: blood glucose; PwT2D: people with type 2 diabetes; RITR: readings in tight range; RIR: readings in range.
Hypoglycemic readings were negligible in each group. For instance, very low readings (< 54 mg/dL) did not rise above 0.2% of readings at any time point for any group. As expected, the percentage of hypoglycemic readings (< 70 mg/dL) was higher at baseline in those with lower baseline mean BG, and these low readings increased by 0.3 to 0.5% pts at 3 months, reflecting an overall reduction in glycemia as a result of patient- and/or clinician-led actions to reduce hyperglycemia.
Figures 3 and 4 show overall app usage, averaged over the full year, ranging from 18 to 21 min per week spent on the app during an average of 3.6 to 4.3 sessions per week. There was, however, a wide distribution of app usage. To better explore the impact of app engagement observed, we compared subjects who averaged ≤ 4 app sessions per week (n = 5,125) to those averaging > 4 sessions per week (n = 2,663). Baseline glucose metrics were almost identical, but those subjects subsequently performing > 4 app sessions per week had more RIR, more RITR, and a lower mean BG at 1 year (Figure 5). Encouragingly, there was no difference in the percentage of hypoglycemic readings between these app engagement groups at 1 year. It was evident from the data that those who subsequently performed the most app sessions checked their BG more often in the baseline period and were also checking a little more frequently throughout the year, which may have supported better insights from the app.
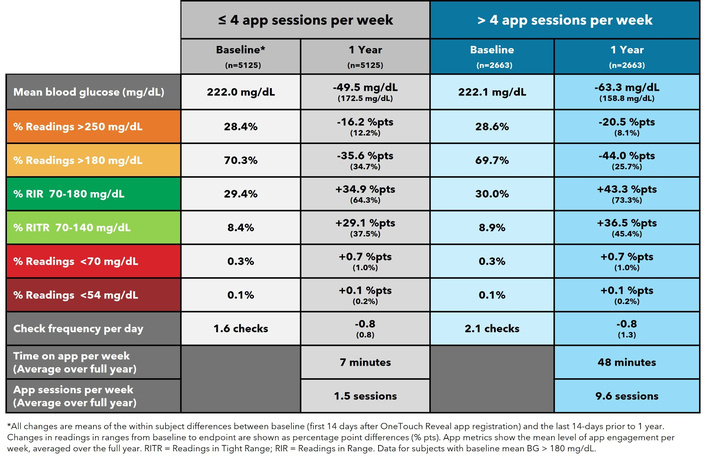
App engagement and improved glycemia in PwT2D with baseline mean BG >180 mg/dL. *All changes are means of the within-subject differences between baseline (first 14 days after OneTouch Reveal app registration) and the last 14 days prior to 1 year. Changes in readings in ranges from baseline to endpoint are shown as percentage point (% pts) differences. App metrics show the mean level of app engagement per week, averaged over the full year. BG: blood glucose; PwT2D: people with type 2 diabetes; RITR: readings in tight range; RIR: readings in range.
Focusing on outcomes at 1 year in PwT2D in Group 1 (baseline mean BG > 180 mg/dL), baseline mean BG was slightly lower in non-insulin users (219.9 mg/dL) compared to insulin users (225.8 mg/dL). Even so, non-insulin users had a greater reduction in mean BG (–58.3 mg/dL) compared to insulin users (–47.4 mg/dL). Furthermore, far greater improvements in RIR and RITR were also observed in non-insulin users. For example, RITR accounted for only 7.6% of readings in non-insulin users at baseline and improved by 35.6% pts to account for 43.2% of readings at 1 year, whereas insulin users had 10.3% of RITR at baseline and improved by 24.8% pts to 35.1% pts at 1 year (see Supplementary material). Similar trends and changes in metrics for insulin and non-insulin users in Group 2 (BG > 155 mg/dL) can also be found in the supplement.
Our real-world analysis identified 22,696 PwT2D with higher-than-recommended mean BGs, which, if left unchecked, would put them at higher risk for diabetes-related complications. Encouragingly, after only 3 months’ use of this diabetes app and connected meter, mean BGs in this population dropped from 198.1 to 142.2 mg/dL. These changes are clinically meaningful given that this reduction equates to a lowering of estimated HbA1c from ~8.6% to ~7.2%, a drop of ~1.4%.
Clearly, using apps and monitoring devices does not happen in isolation from routine clinical care, including additions or changes to diabetes medications. However, insights from BGM support patients’ behavioral and lifestyle changes and enable clinicians to make more informed therapy decisions. It is increasingly recognized that using HbA1c values alone to assess glycemic management can be misleading [17], at times substantially under- or overestimating actual mean BG. This makes it imperative for PWDs to gather BG information from BGM (or CGM) devices to ensure a better understanding of their glycemia.
The rapid and substantial declines in mean BG in our study population were undoubtedly influenced by a number of factors, many of which are difficult to isolate from real-world data collection, a known limitation of real-world studies. For example, while the app prompts new users during registration to input whether they are currently on insulin or not, it does not currently ascertain if a user was newly diagnosed with T2D. While one might think that few subjects with newly-diagnosed T2D were present in our dataset, given that current diagnostic criteria for diabetes (e.g., A1c ≥ 6.5% or fasting BG ≥ 126 mg/dL) are far lower than our study inclusion criteria of a mean BG > 155 mg/dL, it is common in clinical practice and in studies to see newly-diagnosed PwT2D with an HbA1c of ≥ 8.5% for whom combination therapy, including insulin, is recommended from the outset [18]. Therefore, we must accept that some proportion (especially of our non-insulin-using subjects) could have been newly diagnosed. Accordingly, the initiation of diabetes medications could have elicited improvements in glycemia over the first 3 months in PwT2Ds (e.g., GLP-1s or SGLT-2s), although initiating BGM and engaging with the app during that time would complement improved diabetes management as a result of day-to-day decisions and behaviors to reduce hyperglycemia. It is also possible that some clinicians might defer the selection and initiation of diabetes medications for newly diagnosed patients until they have BGM readings to help them identify the timing of glucose excursions (or high/low patterns) and, on that basis, make therapy changes at the return visit at 3 months. We should also point out that although the app does not specifically track changes or intensification of medications for users, it does allow users to annotate any reading with activity level, carb ingestion, insulin type, and dose. These notes are prominently displayed on the app timeline screen so that users can be easily reminded of past/present decisions.
Furthermore, 33% (7,419) of our 22,696 PwT2D self-reported that they were already on insulin during app registration (see Supplementary materials). It is unlikely that this cohort was newly diagnosed PwT2D, or indeed, even new to performing BGM. They were new, though, to the studied diabetes app and connected BG meters. For instance, a real-world study of 366,955 PwT2D in 301 Italian diabetes centers found only 2.5% of patients started insulin in year 1, increasing to just 15% after year 5 [19]. These observations suggest that the vast majority of our 7,419 insulin users had already had diabetes for several years and were likely to have switched from a prior BGM device to this diabetes app and meter, while continuing on insulin.
This same Italian study highlights that “therapeutic inertia” could have been another important factor initially at play in our cohort of people with higher-than-recommended mean BGs. In particular, PWDs who are not on insulin, who made up 70% of our dataset, commonly experience a delay in insulin initiation [20] or even in starting or intensifying oral diabetes medications (OADs). A US study in more than 186,000 insured PwT2D found that 56.7% did not fill a prescription for any OAD in the first year after diagnosis, and 75% remained without glucose-lowering medications over the following 5 years [21]. In fact, even in those with “delayed treatment,” who received an OAD in years 2 to 5, 83% did not receive any additional OADs (i.e., combination therapy) in this timeframe. Therefore, it should be unsurprising that we identified so many PwT2D with mean BGs well above target. Certainly, the initiation of the diabetes app and meter coincided with a rapid and sustained reduction in mean BG. This suggests that insights from BGM provided extra information for clinicians to advance therapy. During the time data was collected for this analysis, the app did not ask users to itemize diabetes therapies (e.g., OADs, insulin types, pumps, diet, etc.). Our absence of information on the initiation and intensification of OADs is a limitation and confounding factor, especially in patients returning for follow-up visits armed with BGM data that can facilitate more precise therapy adjustments. Recording diabetes management therapies has since been added to the app, so, in the future, we plan to record and report on correlations of real-world glycemic changes based upon the therapies used.
In the current analysis, we also explored the impact of app engagement to understand if this contributes to improvements in glycemia. Focusing on those subjects with baseline mean BG > 180 mg/dL, we found that those performing > 4 app sessions per week (while spending, on average, 48 minutes on the app) had an additional 10% pts improvement in RIR and a further-23 mg/dL lowering of mean BG compared to those doing ≤ 4 sessions (and spending, on average, 7 min per week on the app). This improvement was not explained by differences in baseline glycemia, leading us to conclude that spending time actively harnessing app features, such as BG pattern recognition or 14-day summary reports, or sharing real-time data with clinicians, was responsible for augmenting the outcomes achieved.
One aspect of our design that might help differentiate the true impact of initiating the new meter and app would be to focus on subjects in our data lake already using the connected meter who have not yet downloaded the app. Subsequently, we could then compare pre-existing readings in their meter (before app registration) to follow-up glycemic data after experiencing the app. The current analysis (using the first 14-days after meter/app) likely improved the baseline as people explored their devices; in fact, check frequency was also higher in this initial timeframe. Despite this potentially (already improving) baseline, our cohorts improved still further, which is encouraging. It is also a factor in real-world and observational studies that the magnitude of the improvement could be partly explained by regression to the mean over time.
With a chronic and progressive condition, such as T2D, that requires people to sustain over the long-term changes to regimens and lifestyle, it is relevant to collect data beyond the usual 3- to 6-month timeframe of most studies. In this regard, we followed outcomes for 1 year in this analysis. We do want to note, however, that we recently published data on people using the same app and family of connected meters, where we followed 501 PwT2D for 5 years for whom glycemic improvements in year 1 were durable over the full 5 years [22]. Maintaining a lower burden of hyperglycemia over time is a key factor in reducing complications of diabetes or delaying their onset. In support of this, a study that followed newly diagnosed PwT2D over 6 years confirmed that early intervention and achievement of target HbA1c levels were associated with lower rates of diabetes-associated complications compared with later achievement of target HbA1c [23]. However, the fact remains that compelling data (from NHANES) observed deteriorating glycemic management from the year 2000 to 2023 (8). We might speculate that the factors driving this are more societal, behavioral, and/or access-related, given that a plethora of advances in diabetes medications and monitoring systems have emerged over this time.
In addition to the study limitations discussed earlier, our real-world dataset is circumscribed by the self-reported demographic and medical history information collected upon app registration (e.g., country, gender, age, diabetes type, insulin-using status). By virtue of harnessing app data directly from patients, studies such as ours have no control or comparator group, and therefore the observations or trends need to be put in context to parallel interventions such as routine clinical care and therapy changes. But clearly, reviewing BGM data and the insights from the app complement behaviour change and decision-making by patients and their clinicians. It is worth speculating that the PwT2D in our company data lake (all of whom must be using our app to some extent) have intrinsic health/digital literacy, although great care is taken to ensure our diabetes app screens are easy to interpret and act upon, and apps today are commonplace for multiple purposes. The data collection is limited by design to ensure the app registration experience is simple and accessible for diverse groups of people, globally, of all ages and abilities. We do, however, plan to add additional, optional questions to future versions of the app.
A strength of our study derives from our dataset integrity. In contrast to collecting BG readings from self-recorded paper logbooks, which can be unreliable, our BG readings were transmitted automatically from a connected meter to the app and from the app to the cloud, where they became part of our secure data lake. This process ensures integrity in terms of the BG numerical value and timestamp of every reading. Other strengths that come from having a large real-world population are the minimization of selection bias often present in studies with specific recruitment criteria, and the absence of restrictions that result from studies being conducted in a single center or specific locations and only in people who, by default, were offered study participation.
In a large, real-world cohort of 22,696 PwT2D, higher-than-recommended mean BG rapid and substantial improvements in glycemia were associated with subjects using a diabetes app with a connected BG meter at 3 months, and these trends were sustained for 1 year. These early and sustained benefits when using cost-effective and accessible diabetes technologies, in combination with routine clinical care, supported patients to reach recommended glycemic goals, which may help prevent or delay the onset and progression of diabetes-associated complications.
% pts: percentage points
AGP: ambulatory glucose profile
BG: blood glucose
BGM: blood glucose monitoring
CGM: continuous glucose monitoring
OADs: oral diabetes medications
PWDs: people with diabetes
PwT2D: people with type 2 diabetes
RIR: readings in range
RITR: readings in tight range
T2D: type 2 diabetes
The supplementary material for this article is available at: https://www.explorationpub.com/uploads/Article/file/101478_sup_1.pdf.
The authors thank Rajat Ravinder Tyagi from the LifeScan IT team for assistance in sourcing server app data for the article. We would like to acknowledge and thank all the app users who allowed access to information to enable this publication.
MG: Conceptualization, Writing—original draft, Writing—review & editing, Investigation, Visualization. SM: Formal analysis. MF: Data curation. EH: Conceptualization, Writing—original draft, Writing—review & editing. All authors read and approved the submitted version.
The author(s) declared the following potential conflicts of interest with respect to the research, authorship, and/or publication of this article: MG, SM, MF, and EH are all current employees of LifeScan Ltd. The use and publication of the data in this article are not influenced by Lifescan, Ltd, nor are they subject to any financial restrictions. Furthermore, there are no other conflicts of interest.
Additional ethics committee approval was not required, and no clinical sites or external investigators were involved.
Users provided consent for LifeScan to utilize their deidentified data during the app registration process per the privacy policy: https://onetouchreveal.com/content/en_US/privacy. On that basis, they consent to the use of their de-identified data for analytics and research. Additional ethics committee approval was not required, and no clinical sites or external investigators were involved.
Not applicable.
The full, raw datasets are available from the corresponding author upon reasonable request. An independent verification of our analyses was not performed.
The author(s) disclosed receipt of the following financial support for the research, authorship, and/or publication of this article: Funding for the study and article was provided by LifeScan US, LLC, Malvern, PA 19355 USA. The funders had no role in study design, data collection and analysis, decision to publish, or preparation of the manuscript.
© The Author(s) 2026.
Open Exploration maintains a neutral stance on jurisdictional claims in published institutional affiliations and maps. All opinions expressed in this article are the personal views of the author(s) and do not represent the stance of the editorial team or the publisher.
Copyright: © The Author(s) 2026. This is an Open Access article licensed under a Creative Commons Attribution 4.0 International License (https://creativecommons.org/licenses/by/4.0/), which permits unrestricted use, sharing, adaptation, distribution and reproduction in any medium or format, for any purpose, even commercially, as long as you give appropriate credit to the original author(s) and the source, provide a link to the Creative Commons license, and indicate if changes were made.


View: 867
Download: 26
Times Cited: 0


