Original Article

Affiliation:
1Department of Biomedical Engineering, University of Ghana, Legon, Accra P.O. Box LG 77, Ghana
ORCID: https://orcid.org/0009-0006-0951-6232
Affiliation:
1Department of Biomedical Engineering, University of Ghana, Legon, Accra P.O. Box LG 77, Ghana
Email: boasimeng@ug.edu.gh
ORCID: https://orcid.org/0000-0002-4847-450X
Affiliation:
2Department of Chemical Engineering and Biotechnology, University of Cambridge, Philippa Fawcett Drive, CB3 0AS Cambridge, UK
ORCID: https://orcid.org/0000-0002-5011-8686
Affiliation:
1Department of Biomedical Engineering, University of Ghana, Legon, Accra P.O. Box LG 77, Ghana
3School of Optometry and Vision Science, Faculty of Medicine and Health, University of New South Wales, Sydney New NSW 2052, Australia
ORCID: https://orcid.org/0000-0002-1259-5254
Explor Drug Sci. 2023;1:299–311 DOI: https://doi.org/10.37349/eds.2023.00021
Received: April 21, 2023 Accepted: July 03, 2023 Published: September 21, 2023
Academic Editor: Xiqun Jiang, Nanjing University, China
Aim: The biorecognition unit of an electrochemical biosensor requires molecules that are immobilised to serve as a bridge between the recognition unit and the transducing surface. Unique materials that enhance immobilisation of biorecognition molecules and improve electrochemical signal transduction are important in overcoming challenges based on the sensitivity of biosensors. In this regard, the electrochemical properties (EPs) of hydroxyapatite (HAp) material for the direct immobilisation of cells was investigated.
Methods: Snail shell HAp (SHAp) material was synthesised from Achatina achatina snail shells and phosphate-containing solutions. The SHAp material was characterised using X-ray diffractometry (XRD), Fourier transform infrared (FTIR) spectroscopy, and Raman spectroscopy to determine the structural configuration, after which it was blended with a conductive polymer [poly(3,4-ethylenedioxythiophene): poly-4-styrene sulfonate (PEDOT: PSS)] to improve the electrochemical responses. The SHAp/PEDOT: PSS blend was used to modify a screen-printed carbon electrode (SPCE) by drop-casting, followed by seeding of pheochromocytoma (PC 12) and human embryonic kidney (HEK)-293T cells on the modified SPCE to record the EP using cyclic voltammetry (CV) and electrochemical impedance spectroscopy (EIS). Red blood cells (RBCs) were used as a control.
Results: The CV analysis showed lower peak currents for HEK 293T (50 µA) and PC 12 (120 µA) compared to the RBC (230 µA). Also, the EIS showed impedance values of 0.70 for HEK 293T, 0.62 for PC 12, and 0.52 mΩ for RBC. The findings indicate that SHAp/PEDOT: PSS enables the differentiation of cell proliferation signals through voltammetric and impedimetric measurements.
Conclusions: The unique current and impedance differences among the cells could serve as potential markers for rapid cell detection.
There is increasing interest in the application of biosensors in the rapid detection of biomarkers to provide point-of-care (POC) testing [1, 2]. A biosensor is made up of a biorecognition (biocomponent or bioreceptor) unit, a signal transducer unit, and a unit that relays and processes information into electrical signals. They are potable, easy to use, and have a low manufacturing cost [3–5]. Clinical diagnosis of cancer requires detection tools that are rapid, sensitive and specific; therefore new cancer diagnostic tools are exploring the development of biosensors for these desirable attributes compared to conventional techniques used in the field of cancer diagnostics. The recognition element determines the selectivity of the biosensor by recognising the bioreceptor to produce a physiochemical signal, whereas the transducer determines the sensitivity of the biosensor by converting the biological response generated by the interaction of biorecognition molecules (cells, antigens, enzymes, antibodies, DNA, and RNA) with the analyte into a measurable electrical signal [4, 6]. Biorecognition molecules are immobilised to serve as a bridge between the recognition unit and the transducing surface. Some of the biorecognition molecules require immobilising materials to help increase the electrochemical reactivity of a transducer, as they help the biorecognition molecules to attach well to the transducer surface for energy transfer [7, 8].
Cytosensors are cell-based biosensors that can make use of electrochemical techniques in their detection routes. The electrochemical cell-based detection system promises to be very sensitive and exhaustive, as it gives great details of functional information about the target analyte [9]. A significant advancement in biosensing is the development of an ultra-high-resolution biosensor that utilises reduced graphene nanowalls. The biosensor shows promise as an efficient, label-free sensor for detecting single DNA nucleotides [10]. However, one of the major challenges with electrochemical biosensors is the detachment of biomolecules from the transducing surface, which slows electron movement. The biosensor produces a weak biological signal limits the linear range of detection, hence hampering its sensitivity [7, 11]. Biomaterials such as graphene [12], chitosan [13], collagen [14], conductive polymers [poly(3,4-ethylenedioxythiophene) (PEDOT)] [15], and other inorganic materials [16] are used as immobilising materials in cancer biosensing to curb detachment problems; however, the immobilizing properties of a hydroxyapatite (HAp) biomaterial and PEDOT are accessed in this study. HAp [Ca10(PO4)6(OH)2] is a naturally occurring inorganic material derived from bones and teeth. HAp can also be synthesised from shells, corals, and calcium apatite or calcium phosphate precursors. The structural and chemical characteristics of HAp makes it biocompatible and diverse in applications. For biomedical purposes, it is used in drug delivery systems, bone tissue scaffolding, bone and tooth filling, and coating implant devices [17]. HAp has been widely used as a biomaterial as it does not stimulate the immune system directly and does not cause any systemic toxicity if reabsorbed. It has the capacity to inhibit cancer cell proliferation and induce apoptosis in several cancer cells, including osteocytes, colon cells, breast cells, and liver cells while sparing their normal cells respectively [17, 18].
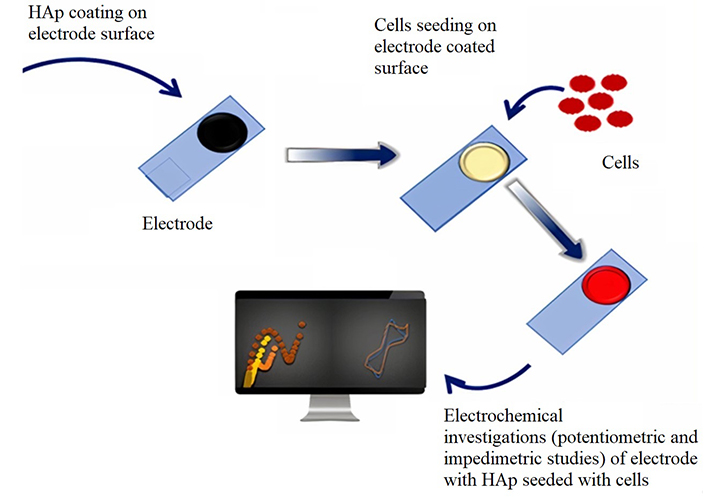
The study investigates the electrochemical property (EP) of snail shell HAp (SHAp)/PEDOT: poly-4-styrene sulfonate (PEDOT: PSS) composite immobilising material for cytosensing, as illustrated in Figure 1. The SHAp material is synthesised from Achatina achatina snail shells and a phosphate-containing solution. PEDOT: PSS was added to improve the conductivity and adhesion of SHAp onto the electrode surfaces for cell immobilisation studies. The material was initially characterised using X-ray diffractometry (XRD), Fourier transform infrared (FTIR) spectroscopy, and Raman spectroscopy to determine its structural configuration. Cyclic voltammetry (CV) and electrochemical impedance spectroscopy (EIS) are electrochemical characterization techniques subsequently employed to access the EPs of the SHAp/PEDOT: PSS composite before and after cellular immobilisation.
SHAp was obtained using the Asimeng et al. [19] procedure at a calcination temperature of 850℃. The commercial HAp (CHAp), phosphate-buffered saline (PBS, pH~ 7.4), and Milli-Q high-grade double distilled water (ddH2O) were purchased from Sigma-Aldrich (St. Louis, USA). A redox probe [potassium hexacyanoferrate ferrocyanide (III)] was purchased from Sigma-Aldrich (St. Louis, USA). A conductive polymer (PEDOT: PSS) was obtained from Sigma-Aldrich (St. Louis, USA).
The phase compositions of the CHAp and the SHAp were studied using XRD (PANalytical, Empyrean). The XRD equipped with CuKα radiation (λ = 1.5406 Å) was used to identify the phase composition. FTIR (Perkin Elmer) spectroscopy was used to ascertain the functional groups of CHAp and SHAp. The FTIR spectrometer integrated with universal attenuated reflectance (UATR) sensor 2 was used to obtain the infrared data on CHAp and SHAp over the range of 400–4,000 cm–1. The FTIR data was complemented using Raman spectroscopy (uRaman-Ci Raman microspectrometer). The Raman spectroscopy integrated with the Nikon H550L upright microscope running on USoft 2.0 Map software for analysis was used with an ×50 objective lens. The image of a field of the sample was captured and laser beam of wavelength 530.48 nm with a laser power of 100 mW was applied across the focused field at an integration time of 1,500 ms to obtain a Raman spectrum of CHAp and SHAp. A scanning electron microscope (SEM; Thermo Sci., Phenom ProX) was used to obtain the surface images of CHAp and SHAp. At a working distance of 200 µm and an accelerating voltage of 15 kV, the images were captured.
A volume of 20% volume by volume concentration of CHAp and SHAp was prepared in ddH2O using a downgrading serial dilution method. CHAp and SHAp of PEDOT: PSS polymers of the same volume were added to the composition to increase adhesion between the HAp materials and the screen-printed carbon electrode (SPCE). A sensing platform was developed using the SHAp/PEDOT: PSS blend to modify the SPCEs. The blend material (SHAp/PEDOT: PSS) was selected for the sensing platform because of its high electrical conductivity and low impedance properties. A volume of 2 µL of the CHAp and SHAp in the PEDOT: PSS mixture was used to drop coat the working electrode area of the SPCEs. The modified SPCEs were dried by heating at a temperature of 70℃ for 30 min on a hot plate.
Cell lines [human embryonic kidney (HEK)-293T transfection and pheochromocytoma (PC 12)] were cultured for seeding on modified SPCEs alongside normal red blood cells (RBCs) as a control. HEK 293T was grown in Dulbecco’s modified eagle medium (DMEM) media supplemented with fetal bovine serum (FBS), penicillin, streptomycin, and L-glutamine, whereas PC 12 was in Roswell Park Memorial Institute (RPMI) 1640 media. All cell lines were cultured at 37℃ with 5% CO2. The cells were cleaved and dislodged from culture flask surfaces using their respective media of growth and transferred into an Eppendorf tube and centrifuged at 350 g for 5 min. Supernatants were discarded, and cells resuspended in fresh growth media before counting using trypan blue (dilution factor of 1:10). Cell counts were performed using a hemocytometer, a counter, and a light microscope. The RBCs were suspended in PBS with the pH of 7.4. The cells, including the RBCs were centrifuged at 350 g for 5 min to form a pellet. Cell counts of 4.17 × 10⁷ and 4 × 10⁶ cells/mL were obtained for cell lines (HEK 293T and PC 12, respectively). The RBC concentration was also estimated at 4.10 × 10⁷ cells/mL in PBS.
A volume of 5 µL of the various cell pellets was pipetted and seeded onto the modified working electrode area of the SPCEs. Cell-modified SPCE surfaces were incubated in a humid chamber at 37℃ for 30 min. SPCE surfaces were washed off gently with ddH2O to remove unbound cells before electrochemical investigations proceeded.
A volume of 5 mmol/L ferrocyanide solution containing 0.01 mmol/L KCl in PBS (pH 7.4) was prepared to use as an electrolyte for the electrochemical measurements (CV and EIS) of the unmodified, modified, and cell-seeded modified SPCEs. All electrochemical measurements were performed using a potentiostat, PGSTAT204 Autolab, and potentiostat/galvanostat/EIS FRA32M Module (Metrohm-Autolab, The Netherlands) with Nova 2.1 Software for data acquisition and experimental control. Cyclic voltammograms of unmodified and modified SPCEs of various concentrations of CHAp and SHAp were recorded at an applied potential range of –0.3 V to +0.6 V. A scan rate study of 10 mV/s to 300 mV/s was run, and a scan rate of 100 mV/s at a step voltage of 2.4 mV was used for all CV measurements. EIS was carried out under an alternating current with an amplitude of 0.098 V within a frequency range of 0.1 kHz to 100 kHz. EIS of unmodified SPCEs, modified SPCEs, and cell-seeded modified SPCEs were recorded and presented on a Nyquist plot.
XRD was performed to identify the phase composition of the material. XRD patterns of CHAp and SHAp are shown in Figure 2A. The XRD pattern of CHAp shows phases of only HAp, with the main peaks occurring at 31.8° 2θ and 35° 2θ positions, with the most intense peak at 31.8° corresponding to the (211) reflection, whereas that of SHAp shows phases of HAp and calcite with the calcite, intense peak showing at 29.4°, 47.5°, and 48.6° 2θ positions. FTIR analysis of the CHAp and SHAp materials was performed to identify the material signature peaks (functional groups), and the characterization results are presented in Figure 2B. CHAp and SHAp had characteristic vibrational PO43–, CO32+, and OH– functional groups at wavenumbers 1,073, 1,440, and 3,573 cm–1, respectively, indicating that the materials are HAp [17, 20]. The low OH– transmission peak of SHAp suggests that SHAp is a more B-type carbonated HAp material compared to CHAp [21]. The Raman spectra of CHAp and SHAp are shown in Figure 2C. The CHAp and SHAp showed signature peaks of B-type CO32– functional groups occurring at wavenumber (Raman shifts) 1,124 cm–1. The high Raman peak intensity of SHAp at 1,124 cm–1 confirms the FTIR results that SHAp is a more carbonated material than CHAp. The data from the FTIR and Raman analyses corroborate with the data from the XRD analysis. The SEM images in Figure 2D and E show that the CHAp is agglomerated into larger chunks, whereas the SHAp is a mixture of agglomerated chunks with a rod-like morphology showing more asperity than that of the CHAp.
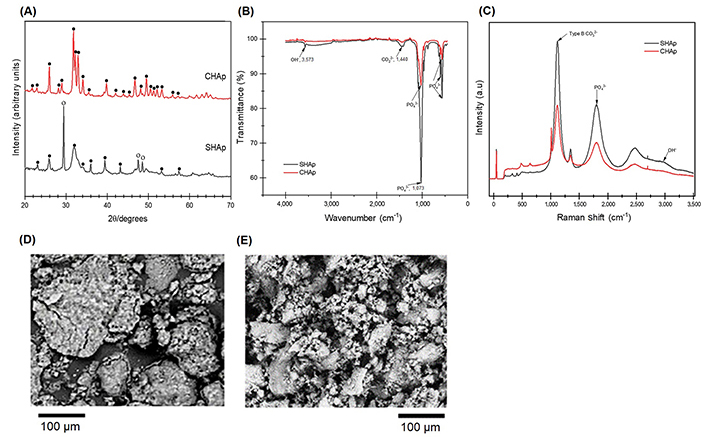
CHAp and SHAp characterization data indicating (A) XRD patterns made up of phases of HAp (•) and calcite (o); (B) FTIR spectra of wavenumbers ranging from 400 cm–1 to 4,000 cm–1; (C) Raman spectra of wavenumbers ranging from 0 cm–1 to 3,500 cm–1; (D) and (E) are SEM images showing more asperity on SHAp than that of CHAp
The cyclic voltammograms obtained from the unmodified (bare) SPCEs in PBS (0.1 mol/L, pH 7.4) alone and in the presence of ferrocyanide are shown in Figure 3. The SPCEs in PBS show no redox activity whereas the SPCEs show redox response in the presence of ferrocyanide, with well-defined oxidation and reduction peaks occurring at potentials of 0.24 V and –0.004 V, respectively.
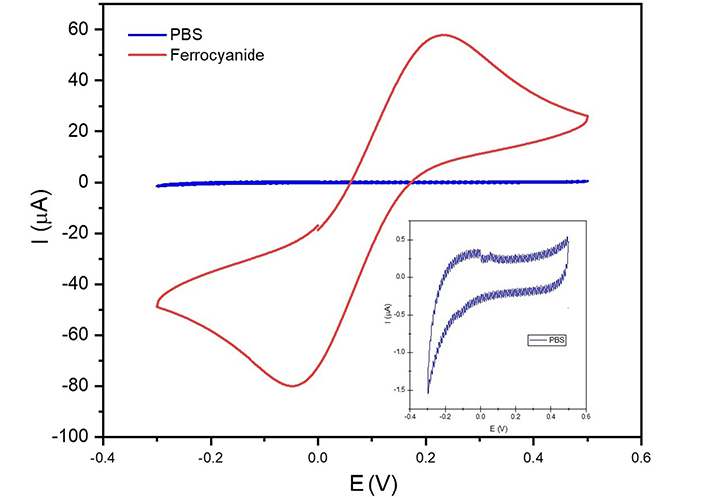
A cyclic voltammogram for SPCE in PBS and in 5 mmol/L ferrocyanide containing 0.1 mol/L KCl was obtained at a potential range of –0.3 V to +0.5 V (vs. Ag/AgCl) at a scan rate of 100 mV/s
The cyclic voltammograms of SPCEs modified with CHAp and SHAp are shown in Figure 4. It was observed in Figure 5 that there is a difference between CHAp and SHAp current responses in ferrocyanide solution when compared to the unmodified SPCE. However, the SHAp shows a high current response at the SPCE surface, so the SHAp was compared to a conductive polymer (PEDOT: PSS) to study the influence of PEDOT: PSS on the current response of the SHAp. The voltammograms of SHAp, PEDOT: PSS, and SHAp/PEDOT: PSS blends are shown in Figure 6. The PEDOT: PSS produced a significant current response of 247 µA which is about three-fold higher than that of SHAp (86.8 µA). The SHAp/PEDOT: PSS produced a current response of 266 µA which is close to the current of the PEDOT: PSS alone.
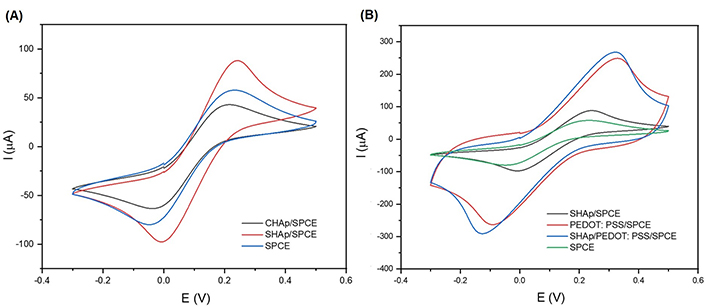
Cyclic voltammograms of (A) SPCE, CHAp/SPCE, and SHAp/SPCE; (B) PEDOT: PSS/SPCE; modified SHAp/SPCE with PEDOT: PSS (SHAp/PEDOT: PSS). All electrodes contain 5 mmol/L ferrocyanide (0.1 mol/L KCl). The voltammograms were obtained at a potential range of –0.3 V to +0.5 V (vs. Ag/AgCl) at a scan rate of 100 mV/s
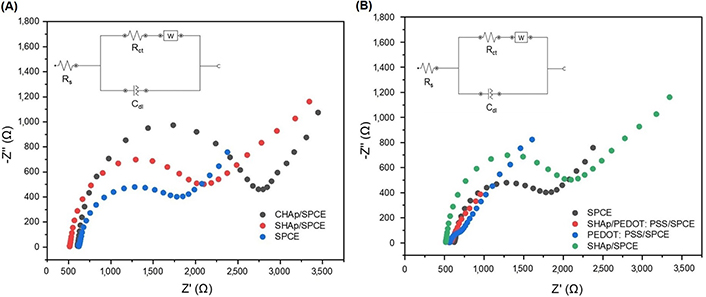
Nyquist plot of EIS results with circuitry comparing the impedance of (A) CHAp and SHAp on the bare SPCE surface; (B) modified SHAp/SPCE; and with SHAp/PEDOT: PSS. All electrodes contain 5 mmol/L ferrocyanide (0.1 mol/L KCl) with an amplitude of 0.098 V within a frequency range of 0.1 kHz to 100 kHz
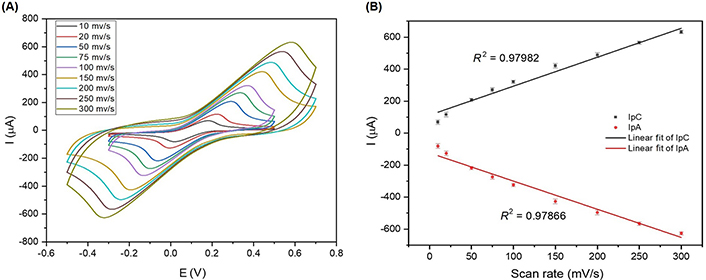
Cyclic voltammograms of scan rates showing the performance of the SHAp/PEDOT: PSS electrode surface. (A) Scan rates of SHAp/PEDOT: PSS on SPCE with a scan range of 10 mV/s to 300 mV/s. The experiment was conducted in 5 mmol/L ferrocyanide containing 0.1 mol/L KCl; (B) graph of anodic (Ipa) and cathodic (Ipc) peak currents against scan rates to generate linear correlation (R2) for both oxidation and reduction cycles
EIS was performed to complement the CV results in Figure 4A and B. The EIS curve is presented in Figure 5A and B as Nyquist plots consisting of a semicircle section, located at higher frequencies corresponding to the electron transfer-limited process. Its diameter represents the electron-transfer resistance or charge transfer resistance (RCT). The linear component of the Nyquist plot is related to the diffusion process held in solution and located at lower frequencies. The Nyquist plot in Figure 5A shows the impedance (RCT) produced by bare SPCE (1.2 mΩ), CHAp (2.4 mΩ), and SHAp (1.64 mΩ) whereas Figure 5B shows the RCT of SHAp, PEDOT: PSS, and SHAp/PEDOT: PSS. It is noted that the semicircle diameter of the bare SPCE (1.2 mΩ) increased when both CHAp and SHAp were used to modify the SPCEs. The CHAp produced a higher RCT value, which is an indication of higher impedance and lower charge transfer (Figure 7). The RCT of SHAp, PEDOT: PSS, and SHAp/PEDOT: PSS blends are shown in Figure 8. The PEDOT: PSS-modified SPCE produced a negligible RCT value, whereas the RCT of SHAp-modified SPCE produced was 1.64 mΩ. The introduction of PEDOT: PSS into SHAp (SHAp/PEDOT: PSS) reduced the RCT value of SHAp-modified SPCE to 0.25 mΩ.
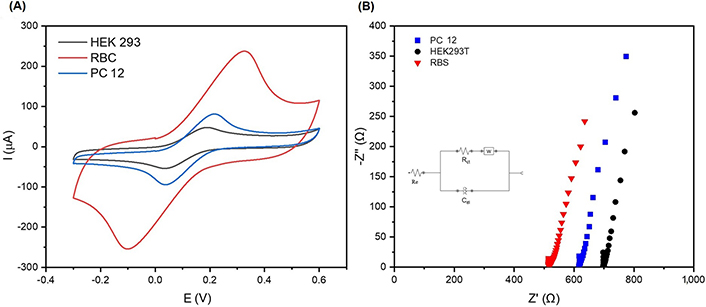
The electrochemical performance of cells immobilized on the SHAp/PEDOT: PSS modified electrode surface. (A) Cyclic voltammograms of RBC, PC 12, and HEK 293T cells immobilised on SHAp/PEDOT: PSS modified SPCE surface; (B) Nyquist plot showing impedance measurements of RBC, PC 12, and HEK 293T in 5 mmol/L ferrocyanide containing 0.1 mol/L KCl with an amplitude of 0.098 V within a frequency range of 0.1 kHz to 100 kHz
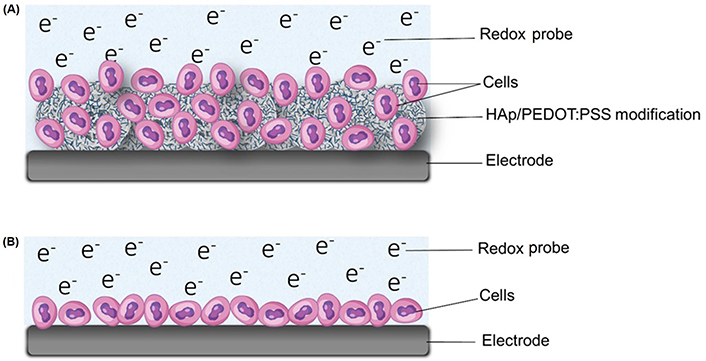
Illustration of the HAp/PEDOT: PSS cytosensor. (A) SHAp/PEDOT: PSS-modified electrode captures cells within its porous matrix in an electrolyte for electrochemical measurements, and other studies; (B) cells directly attaching to electrode surfaces to insulate it
The CV results in Figure 6A show that an increase in scan rates gives a corresponding increase in electrochemical current responses. The cathodic peaks shifted towards the positive potential, while the anodic peaks shifted towards the negative potential. The shifts in potential with increasing scan rates can be related to the internal resistance encountered inherently with the modified SPCE. The increase in current responses with increasing scan rates suggests that the kinetics of interfacial faradic redox reactions and the rate of electronic and ionic transport are increasing accordingly. The scan rate of 100 mV/s was selected for the cell studies because at 100 mV/s, the anodic peak current (Ipa) and cathodic peak current (Ipc) values are distinct from those at scan rates below 100 mV/s. Upper scan rates above 100 mV/s gave higher Ipa and Ipc values, which is an advantage for the sensing platform, but the Ipa and Ipc values occur at a higher potential. The scan rate shows a linear correlation with Ipa and Ipc, as presented in Figure 6B.
Cell lines (HEK 293T and PC 12) and normal RBC were immobilised on the SHAp/PEDOT: PSS-modified SPCEs, and the CV and EIS results are presented in Figure 7A and B. The peak current responses from RBC, HEK 293T, and PC 12 after seeding on SHAp/PEDOT: PSS-modified SPCEs are shown in Figure 7B. The RBC gave the highest peak current response of 230 µA, as compared to the cell lines PC 12 (120 µA) and HEK 293T (50 µA), respectively. The EIS is presented as a Nyquist plot in Figure 7B, which compares the electrolyte resistance (RE) spectra of RBC, HEK 293T, and PC 12 immobilised on the modified SPCEs and complements the CV results. The lowest RE (517 Ω) was recorded for RBC compared to PC 12 (612 Ω), and HEK 293T (700 Ω).
The study aims to investigate the use of HAp as an immobilising material for label-free detection of cells. HAp was synthesised from Achatina achatina snail shells (SHAp) at 850℃ through a wet chemical precipitation method. Structural identification of the SHAp was performed alongside a CHAp using XRD, FTIR, Raman spectroscopy, and SEM. The XRD patterns of CHAp indicated only HAp phases, which confirmed that the CHAp is pure HAp. Also, the HAp and calcite phases present in the XRD pattern of SHAp confirmed that the synthesised material contained HAp and calcite. CHAp and SHAp were further proffered to be HAp molecules with the presence of PO43–, CO32–, and OH– functional groups. FTIR and Raman spectroscopy predict CHAp and SHAp to be type B carbonate (CO32–) substituted HAp, thus replacing the PO43– functional group with CO32–, resulting in a low OH– transmission peak in FTIR and a high-intensity peak in the Raman spectroscopy. Type B carbonate (CO32–) substituted apatite is mostly found in biological sources of apatite [21, 22]. The level and share of CO32– substitution could be influenced by the source of HAp and the calcination temperature used. Snail shells naturally deposit carbonate materials in their shells due to their feeding habits; moreover, the calcination temperature of 850℃ helps to decompose the organic waste for purer calcite formation [17, 23].
The inorganic compound SHAp was exploited for the selective adsorption of cells in the biosensor. Transducers in electrochemical biosensors transform a chemical reaction occurring on the surface of the biological elements into an electrical signal. The SHAp material affords the necessary sensitivity to the sensor, as the signals produced must correlate directly to the signals measured. In this regard, electrochemical biosensors should possess good signal transduction abilities. The suitability of a carbon-based screen-printed electrode (SPE) as a base transducer in the sensor design was in PBS and ferrocyanide solutions. Carbon-based electrodes have a wide potential window and a low background current, making them preferable in the formation of SPE. SPEs come in a simple electrode setup and are cost-effective in mass production, which allows single usage for independent tests without contamination [24, 25].
SHAp is a suitable interface at which redox reactions occur because of the B-type carbonate substitution it underwent. The ionic diameter of carbonate is smaller than that of phosphate, so the replacement of the phosphate with carbonate allows SHAp to have a new structure conformation that makes SHAp more reactive than CHAp [21]. CV and EIS results suggest that SHAp is more conductive and introduces less impedance to the SPCE surface as compared to CHAp. Due to the improved electrochemical responses of the SHAp, it was selected as the suitable material for SPCE modifications in the study. For diagnostic purposes, a good biosensor should be able to produce sharp electrochemical responses; hence, PEDOT: PSS, a conductive polymer, was introduced into SHAp to form a SHAp/PEDOT: PSS composite. The use of composite that involving conductive polymers with other biomaterials has been widely used in biosensor fabrication, and the formation tends to sharpen and increase the electrochemical responses. In addition, conductive polymer composites tend to enlarge the surface area of immobilising materials in biosensors, marking them more sensitive and efficient in capture [25]. A very drastic increase in peak current was observed when PEDOT: PSS was introduced into the SHAp, indicating a sharp rise in conductivity as compared to the SHAp alone. This could be due to the synergistic increase in conductivity of the SHAp and PEDOT: PSS, thus a synergistic conductance from the SHAp and PEDOT: PSS. Impedance results complement the voltametric measurements and show that the introduction of PEDOT: PSS drastically reduced the impedance produced by the SPCE inherently and the SHAp. The introduction of the conductive polymer into SHAp not only increased its conductivity but also improved SHAp adhesion on the electrode surface as compared to SHAp alone for cell immobilisation studies. The high R2 values obtained for the anodic peak (Ipa) and cathodic peak (Ipc) currents of the fabricated SHAp/PEDOT: PSS modified SPCE for both the oxidation and reduction cycles suggest that there is high consistency in current values when the scan rate is increased, and this indicates that the electron flow mechanism of modified SPCEs was in a diffusion-controlled state. The CV and EIS data provided show that SHAp/PEDOT: PSS is a good immobilising material for carbon-based electrodes for sensor development as it allows for good signal transduction by removing all inherent impedance from the transducing surface; hence, any signal obtained is from the biorecognition element immobilised on the transducing surface.
Human cells, both pathogenic and non-pathogenic, contain sialic acid, a carbon receptor molecule that can be found on the terminal regions of glycan chains on cell membranes. Sialic acid moieties have been associated with several diseases, including cancer, and find relevance in cell targeting. Sialic acid moieties are important in key activities including cellular signalling and proliferation, cell-to-cell adhesion and interaction, and host-to-pathogen interactions. HAp is known to have an adhesive interaction with sialic acid on cell surfaces, although this phenomenon has not been exhaustively understood yet [19, 26]. The detection of cells through the interaction of sialic acid on cell surfaces and SHAp can be used for label-free cancer cell detection. This would help in the reduction of interferences from normal cell activities, improvement in kinetic measurement, simplicity in assay formation, and a reduction in assay measurement time [27]. Cell lines (HEK 293T and PC 12) and normal cells (RBCs) were immobilised, and the CV recorded a high current for RBC as compared to PC 12 and HEK 293T, respectively. The CV results were complemented by EIS results, which further suggest that RBC recorded lower electrolyte impedance values than PC 12 and HEK 293T. These results could be attributed to the difference in the electrochemical behaviour of individual cells through polarisation and depolarization mechanisms resulting in an ion-concentration gradient across their cell membranes. Normal human cells mostly undergo polarisation by the efflux of ions from their cytoplasm to their outer environment to obtain a balanced resting potential, thereby increasing their external ion concentration, whereas cancer cells mostly undergo depolarization through the influx of ions from their external environment into their cytoplasm, thereby reducing the ion concentration in the outer environment [19, 28]. Ion concentration across cell membranes is reported to facilitate electron transfer. The electrochemistry of electron transfer along the electrode surface is altered as cells are immobilised on its surface. The electrodes face varying levels of resistivity from cells as charges flow towards the electrode surface. The electrolyte resistivity of cells differs as the types of polarised cells differ. Cancerous cells are reported to possess a net negative charge across their cell membranes, which contributes to the resistance to electron transfer along the electrode surface. On the contrary, RBCs are reported to have a net positive charge on the membrane, hence facilitating the flow of electrons along the electrode surface, resulting in the decreased RE recorded [19, 28].
It is important to note that the SHAp/PEDOT: PSS modification results in an alteration of the surface structure of the SPCE. The asperity of the SHAp surface means cells can attach better without direct attachment to the electrode surface. The proposed attachment mechanism of cells to the SHAp on the SPCE surface is depicted in Figure 8A. Cells are captured within the porous matrix of the SHAp, allowing for direct and effective charge transfer between cells and the SPCE surface. This is in contrast with other studies [8, 29, 30] where cells lie directly on electrode surfaces, insulating the electrode surface from direct charge interaction with the biorecognition elements, as shown in Figure 8B.
HAp, synthesised from Achatina achatina snail shells (SHAp), was investigated as an immobilising material for cytosensor fabrication. The XRD, FTIR, and Raman spectroscopy analyses confirmed SHAp to be type B carbonate (CO32–) substituted HAp. SHAp was found to be a suitable interface for redox reactions and selected as the suitable material for SPCE modifications. PEDOT: PSS, a conductive polymer, was introduced into SHAp to form a SHAp/PEDOT: PSS blend to improve the conductivity and stickiness of SHAp on the electrode surfaces for cell immobilisation studies. Scan rate analysis on the modified SPCE recorded high linear correlation R2 values of 0.98 for the anodic (Ipa) and cathodic (Ipc) currents of the fabricated SHAp/PEDOT: PSS modified SPCE, suggesting its suitability to be used as a sensitive and efficient transducing surface for electrochemical biosensing. Normal RBC and cell lines, HEK 293T, and PC 12 were successfully immobilised onto the SHAp/PEDOT: PSS/SPCE transducing platform. CV and EIS measurements performed recorded significant cell proliferation signals. The findings demonstrate that SHAp can differentiate between the proliferation signals of cells through voltametric and impedimetric measurements.
CHAp: commercial hydroxyapatite
CV: cyclic voltammetry
ddH2O: double distilled water
EIS: electrochemical impedance spectroscopy
EP: electrochemical property
FTIR: Fourier transform infrared
HAp: hydroxyapatite
HEK: human embryonic kidney
PC 12: pheochromocytoma
PEDOT: poly(3,4-ethylenedioxythiophene)
PEDOT: PSS: poly(3,4-ethylenedioxythiophene): poly-4-styrene sulfonate
RBCs: red blood cells
RCT: charge transfer resistance
RE: electrolyte resistance
SEM: scanning electron microscope
SHAp: snail shell hydroxyapatite
SPCE: screen-printed carbon electrode
SPE: screen-printed electrode
XRD: X-ray diffractometry
The authors are grateful to the protein synthesis and diagnostic lab workers at the West Africa Centre for Cell Biology of Infectious Pathogens (WACCBIP), University of Ghana, for their laboratory support.
DA: Data curation, Formal analysis, Methodology, Investigation, Writing—original draft, Writing—review & editing. BOA: Conceptualization, Data curation, Methodology, Writing—original draft, Writing—review & editing, Supervision, Funding acquisition, Project administration. FDK: Validation, Formal analysis, Methodology, Investigation, Supervision, Writing—review & editing. EKT: Supervision, Funding acquisition, Writing—review & editing.
The authors declare that they have no conflicts of interest.
The cell culture assays were approved by the University of Ghana’s Ethics Committee for Basic and Applied Sciences, Reference number ECBAS 072/20-21 and complies with the Declaration of Helsinki.
Not applicable.
Not applicable.
Not applicable.
Research reported in this publication was supported by the Fogarty International Center and National Institute of Biomedical Imaging and Bioengineering (NIBIB) of the National Institutes of Health under award number [D43 TW010543]. The funders had no role in study design, data collection and analysis, decision to publish, or preparation of the manuscript.
© The Author(s) 2023.
Copyright: © The Author(s) 2023. This is an Open Access article licensed under a Creative Commons Attribution 4.0 International License (https://creativecommons.org/licenses/by/4.0/), which permits unrestricted use, sharing, adaptation, distribution and reproduction in any medium or format, for any purpose, even commercially, as long as you give appropriate credit to the original author(s) and the source, provide a link to the Creative Commons license, and indicate if changes were made.