 Original Article


Affiliation:
1College of Computer and Artificial Intelligence, Zhengzhou University, Zhengzhou 450001, Henan, China
ORCID: https://orcid.org/0009-0006-3422-1030

 ,
,
Affiliation:
1College of Computer and Artificial Intelligence, Zhengzhou University, Zhengzhou 450001, Henan, China
ORCID: https://orcid.org/0009-0008-1883-6072
,
Affiliation:
1College of Computer and Artificial Intelligence, Zhengzhou University, Zhengzhou 450001, Henan, China
ORCID: https://orcid.org/0009-0005-4923-7927
,
Affiliation:
1College of Computer and Artificial Intelligence, Zhengzhou University, Zhengzhou 450001, Henan, China
ORCID: https://orcid.org/0009-0008-9274-5128
,
Affiliation:
2National Supercomputing Center in Zhengzhou, Zhengzhou University, Zhengzhou 450001, Henan, China
Email: yangkch@zzu.edu.cn
ORCID: https://orcid.org/0000-0001-9664-1395

Explor Drug Sci. 2026;4:1008170 DOI: https://doi.org/10.37349/eds.2026.1008170
Received: May 09, 2026 Accepted: June 14, 2026 Published: July 19, 2026
Academic Editor: Fernando Albericio, University of KwaZulu-Natal, South Africa, Universidad de Barcelona, Spain
Aim: To address the limitations of current metabolomics analysis, including the neglect of metabolite interdependencies, poor interpretability of black-box models, and incomplete utilization of biological information due to pathway annotation limitations. This study aims to develop and validate a dual-branch biologically informed neural network (Dual-BINN) that integrates metabolic pathway hierarchy and molecular structural hierarchy for improved prediction and interpretability in metabolomics.
Methods: We developed a Dual-BINN, which explicitly incorporates metabolic pathway hierarchy and molecular structural category hierarchy into the model architecture. Pathway and structure subnetworks were constructed and integrated via an adaptive fusion mechanism. SHAP was employed for interpretability analysis. The model was evaluated using multi-center plasma metabolomics data for gastric cancer and a breast cancer dataset.
Results: On the independent gastric cancer test set, Dual-BINN achieved a recall of 0.937, which compares favorably with the recall of 0.905 reported by the 10-DM model on the same dataset split. Key metabolites were enriched in the tricarboxylic acid cycle, one-carbon metabolism, and energy metabolism pathways, while structurally concentrated in organic acids, amino acids, and nucleoside-related compounds. The model also demonstrated excellent classification performance on the breast cancer dataset, confirming strong cross-disease generalization ability.
Conclusions: The proposed framework enhances predictive performance while providing biologically meaningful structured interpretations, offering a robust computational approach for metabolomic mechanism analysis and biomarker discovery in complex diseases.
Metabolomics systematically characterizes the composition and dynamic changes of small-molecule metabolites in biological systems, directly reflecting the functional states of cells and organisms under different physiological and pathological conditions. As downstream products of gene expression and protein regulation, metabolites serve as a crucial molecular link between genotype and phenotype [1, 2]. A growing body of evidence indicates that complex diseases, particularly cancer, are often accompanied by systemic metabolic reprogramming. For instance, gastric cancer remains the fifth most commonly diagnosed malignancy and the fourth leading cause of cancer-related death worldwide [3]. Notably, China recorded the highest disease burden in 2022, with approximately 358,000 new cases and 260,000 deaths [4]. Therefore, it is essential to characterize disease-associated metabolic dysregulation from a global metabolic network perspective to achieve a deeper understanding of disease mechanisms [5–8].
Deep learning has demonstrated remarkable success across diverse biomedical domains. For instance, in medical imaging, deep neural networks have been successfully applied to breast tumor segmentation using discriminative level set methods with deep supervision [9], as well as to tuberculosis detection using deep convolutional neural networks [10]. However, metabolomics data present unique challenges: high dimensionality, complex biological priors, and severe annotation incompleteness.
Current metabolomics analysis methods mainly include differential metabolite analysis and predictive modeling based on machine learning or deep learning [11]. The former typically relies on univariate statistical tests and treats metabolites as independent features, making it difficult to capture coordinated variations among metabolites and regulatory relationships at the pathway level. The latter, although capable of learning complex nonlinear patterns in a data-driven manner and achieving strong performance in classification and prediction tasks, often lacks explicit biological constraints in its internal decision-making process [12–15], thereby limiting interpretability and biological credibility. Similar interpretability concerns have been widely recognized across AI-driven healthcare systems [16]. Consequently, integrating biological prior knowledge into predictive models while maintaining high performance has become a critical challenge in metabolomics modeling.
In recent years, studies in genomics and proteomics have incorporated pathway hierarchical structures into neural network models (e.g., P-NET and BINN), demonstrating that this strategy can improve interpretability while maintaining predictive performance [17, 18]. However, such explorations remain limited in metabolomics. Although existing methods such as PiDeeL [19] incorporate metabolic pathway information, they primarily apply it at early layers of the model, while deeper feature learning still relies on fully connected architectures, leading to a gradual attenuation of pathway information. This attenuation occurs because dense layers allow unrestricted mixing of features across unrelated pathways, and during backpropagation, gradients can bypass biologically meaningful connections, progressively diluting the initial pathway prior. Consequently, the interpretability and functional coherence of deeper representations are significantly reduced. Moreover, these approaches heavily depend on existing pathway annotations. In practical metabolomics data, however, many metabolites are not fully annotated within standard pathway systems or are only partially assigned, resulting in the omission of potentially important biological features during modeling.
In contrast, molecular structural classification is based on chemical scaffolds and physicochemical properties, typically more complete and systematically organized, reflecting intrinsic chemical similarities among metabolites. Pathway and structural hierarchies are fundamentally complementary: the former provides functional constraints, the latter offers chemical similarity unaffected by annotation completeness. By preserving known functional relationships and introducing structural hierarchy as an orthogonal dimension, we can mitigate the limitations of incomplete pathway annotation.
Based on these considerations, we propose a Dual-Branch Biologically Informed Neural Network (Dual-BINN), which integrates metabolic pathway hierarchy and molecular structural category hierarchy. The model constructs pathway and structural subnetworks to hierarchically model metabolites from functional and chemical perspectives, respectively, and employs an adaptive fusion mechanism to achieve synergistic integration of multi-source information. The complementary nature of these two types of priors enables the model to retain known functional relationships while effectively leveraging metabolites that are insufficiently annotated.
This study utilized two independent metabolomics datasets for model training, validation, and generalization performance evaluation.
The gastric cancer dataset was derived from a previously published multi-center plasma metabolomics study [20]. Plasma samples were analyzed using an LC–MS platform. A total of 258 endogenous metabolites were initially detected, of which 147 stable and reliable metabolites were retained after quality control and feature selection. The data were further normalized using quality control samples and corrected for batch effects. In total, 702 subjects were included, comprising 389 pathologically confirmed gastric cancer patients and 313 non-cancer controls. Samples were collected from three independent cohorts (cohort 1: n = 426; cohort 2: n = 95; cohort 3: n = 181). All samples from gastric cancer patients were collected prior to any anti-tumor treatment. As cohort 3 was originally designated for survival analysis in the primary study, it was excluded from the current classification modeling.
The breast cancer dataset was obtained from the Metabolomics Workbench database (Study ID: ST000355). Plasma samples were analyzed using a GC–MS platform, resulting in 128 detected metabolites. The dataset included 211 subjects, consisting of 135 breast cancer patients and 76 non-cancer controls.
Metabolomics data inherently exhibit hierarchical structures, including functional organization defined by metabolic pathways and structural organization based on molecular similarity. However, most existing machine learning and deep learning approaches treat metabolites as independent features, ignoring such biologically meaningful hierarchical information, which limits interpretability.
To address this limitation, we adopt a structure-level interpretable modeling paradigm, in which biological hierarchies are explicitly encoded into the neural network architecture. This design enables intermediate representations of the model to correspond to biologically meaningful functional units, thereby extending interpretability from individual features to structured biological levels.
Based on this principle, we propose a Dual-BINN. The model takes metabolite expression profiles as input and constructs two parallel subnetworks: Pathway subnetwork, which aggregates metabolites according to predefined metabolic pathway mappings to model functional relationships; Structure subnetwork, which groups metabolites based on molecular structural categories to capture intrinsic chemical similarities. The complete workflow is shown in Figure 1.
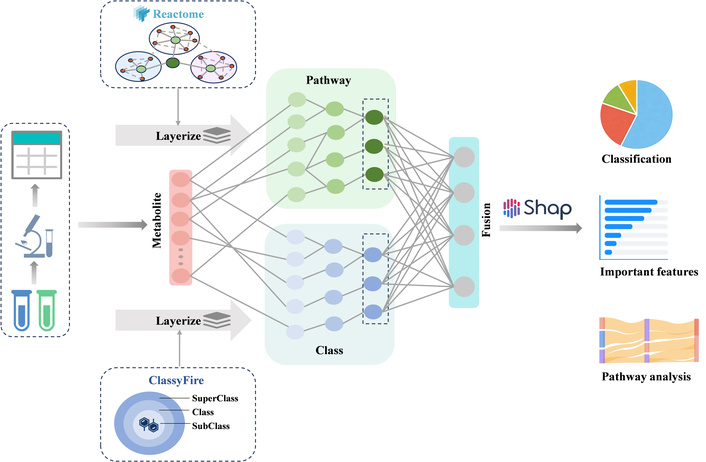
Overall workflow of the Dual-BINN framework. The framework consists of two parallel subnetworks (Pathway and Structure) with biologically constrained sparse connectivity. Features from both branches are integrated via an adaptive complementary fusion module for final prediction. SHAP is applied to the entire model to generate input-level attributions (Equation 8) and hierarchical importance scores (Equation 9) for biological interpretation.
The overall model can be formulated as:
where
The pathway subnetwork is constructed based on hierarchical pathway information obtained from the Reactome database [21] (https://reactome.org/, accessed January 2026), which systematically organizes biological processes from specific reactions to higher-level functional pathways. Metabolites are mapped to corresponding pathway nodes, and hierarchical feature representations are generated through layer-wise aggregation.
The structure subnetwork is constructed based on the ClassyFire chemical ontology [22] (http://classyfire.wishartlab.com/, accessed January 2026), which provides a hierarchical classification from superclass to subclass. Each metabolite is assigned to its most specific subclass and traced upward along the hierarchy to construct multi-level structural representations.
For the Reactome hierarchy, we collect all direct pathway mappings for each metabolite and propagate them to all reachable ancestor nodes using graph traversal. This allows a metabolite to be connected to multiple pathway nodes simultaneously. For the ClassyFire taxonomy, we likewise propagate upward along all possible parent links, enabling a metabolite to belong to multiple structural categories at different hierarchy levels.
To ensure biological consistency and reduce model complexity, hierarchical relationships are mapped into sparse connectivity patterns within the neural network. Specifically, hierarchical graphs are traversed in reverse order, and reachable relationships are encoded into binary connection matrices that constrain connections between adjacent layers. This design enforces biologically meaningful topology while reducing the number of trainable parameters.
Importantly, these binary masks are applied to every linear layer within each subnetwork, not only the input layer. This persistent masking ensures that the hierarchical inductive bias is maintained from the input to the final hidden representation. During backpropagation, gradients are forced to flow only along the biologically allowed connections, preventing the dilution of pathway- or structure-level signals that would otherwise occur in fully connected layers. This design directly addresses the information degradation problem observed in prior works where pathway constraints are applied only shallowly.
A simple concatenation of pathway and structural features implicitly assumes equal and independent contributions, which is often unrealistic in metabolomics data. To address this limitation, we introduce an adaptive complementary fusion mechanism that explicitly models the sample-specific complementarity between the two feature types.
Let
where
The two representations are then adaptively modulated as:
where
To further capture higher-order interactions between the two representations, an interaction term is introduced:
where the
where
The datasets were divided into mutually exclusive training, validation, and external test sets to ensure unbiased evaluation.
For both datasets, the samples were first partitioned into training, validation, and test sets. For the gastric cancer dataset, we followed the fixed split used in the original study: training set (n = 284), validation set (n = 142), and external test set (the entire Cohort 2, n = 95). For the breast cancer dataset, a random stratified split was applied: 80% of the samples for training, 10% for validation, and 10% for testing. All preprocessing steps were performed strictly within the training set only, and the estimated parameters were then frozen and applied to the validation and test sets to prevent data leakage. Specifically, missing value imputation was fitted on the training set only and then used to impute validation and test sets; normalization was performed using the mean and standard deviation estimated exclusively from the training set. Throughout model development, no information from the test sets was used for architecture selection, hyperparameter tuning, or any form of model adaptation. This strict separation ensures unbiased evaluation of model performance.
The model was trained using the cross-entropy loss function and optimized with the Adam optimizer (learning rate = 0.0001). A batch size of 32 was used during training. Batch normalization and dropout (rate = 0.1) were applied to improve training stability and reduce overfitting. Tanh activation was used for nonlinear transformations. Early stopping based on validation loss was employed to select the optimal model checkpoint.
Model performance was evaluated on independent external test sets using multiple metrics, including accuracy, precision, recall, ROC-AUC, and PR-AUC.
To investigate the biological basis of model predictions, SHAP was applied [23]. At the input level, SHAP values quantify the contribution of each metabolite. The global importance of each metabolite is defined as the average absolute SHAP value across samples:
where
where
As illustrated in Figure 1, SHAP analysis is performed on the complete trained Dual-BINN model after the final prediction. It first computes input-level attributions for individual metabolites (Equation 8) and then propagates these values through the hierarchical layers of both the pathway and structure subnetworks (Equation 9), enabling multi-scale interpretation from metabolites to biological modules. This framework enables multi-scale interpretation across metabolite, pathway, and structural levels.
To systematically evaluate the classification performance and robustness of the proposed Dual-BINN across different disease scenarios, we compared it with multiple classical machine learning methods, including Logistic Regression, Support Vector Machine (SVM), Decision Tree, and XGBoost, as well as a general deep learning model (MLP) and an existing biologically interpretable model, PiDeeL [19]. All models were trained and evaluated using identical data preprocessing procedures, training strategies, and evaluation metrics to ensure fair comparison and reproducibility.
The performance of all models on the gastric cancer dataset is presented in Table 1. Dual-BINN achieved strong performance across multiple key metrics (Accuracy = 0.895, ROC-AUC = 0.956, PR-AUC = 0.975). Compared with traditional machine learning methods, Dual-BINN significantly improved overall discriminative ability while maintaining a high recall rate, indicating that the model reduces misclassification without sacrificing sensitivity to positive samples. This balance is particularly important in clinical screening scenarios.
Comparison of model results on the gastric cancer dataset.
| Model | Accuracy | Precision | Recall | ROC-AUC | PR-AUC |
|---|---|---|---|---|---|
| Dual-BINN | 0.895 | 0.908 | 0.937 | 0.956 | 0.975 |
| Decision Tree | 0.737 | 0.806 | 0.794 | 0.709 | 0.777 |
| SVM | 0.811 | 0.817 | 0.921 | 0.923 | 0.964 |
| Logistic Regression | 0.884 | 0.906 | 0.921 | 0.930 | 0.965 |
| XGBoost | 0.853 | 0.855 | 0.937 | 0.925 | 0.958 |
| PiDeeL | 0.884 | 0.933 | 0.889 | 0.926 | 0.948 |
| MLP | 0.790 | 0.771 | 0.741 | 0.811 | 0.883 |
Bold values indicate the best-performing model for each metric.
The results on the breast cancer dataset are shown in Table 2. Dual-BINN achieved near-perfect classification performance across all evaluation metrics. Other models also demonstrated relatively high performance, suggesting that the dataset may exhibit strong separability in the feature space. Nevertheless, Dual-BINN consistently maintained superior performance, indicating its ability to effectively exploit discriminative information even in relatively simple classification scenarios.
Comparison of model results on breast cancer dataset.
| Model | Accuracy | Precision | Recall | ROC-AUC | PR-AUC |
|---|---|---|---|---|---|
| Dual-BINN | 1.000 | 1.000 | 1.000 | 1.000 | 1.000 |
| Decision Tree | 0.884 | 0.875 | 0.911 | 0.911 | 0.938 |
| SVM | 0.930 | 0.917 | 0.946 | 0.988 | 0.994 |
| Logistic Regression | 0.953 | 0.949 | 0.949 | 0.933 | 0.894 |
| XGBoost | 0.977 | 0.969 | 0.982 | 1.000 | 1.000 |
| PiDeeL | 0.952 | 0.929 | 1.000 | 1.000 | 1.000 |
| MLP | 0.953 | 0.948 | 0.948 | 0.933 | 0.894 |
Bold values indicate the best-performing model for each metric.
To further rule out the possibility that these near-perfect results arise from small-sample artifacts, class structure bias, or inadvertent data leakage, we performed two complementary robustness analyses: calibration curve assessment and label-permutation testing. As shown in Figure S1, after temperature scaling, the calibration curve for the breast cancer dataset closely follows the diagonal, with an expected calibration error (ECE) of 0.05 ± 0.023, indicating well-calibrated probabilistic outputs. Additionally, we randomly permuted the training set labels 100 times while keeping all preprocessing steps and model architectures unchanged. As shown in Figure S2, the resulting test-set ROC‑AUC values were centered around 0.5 (random guessing level). In contrast, the original ROC‑AUC (0.998 for breast cancer) lies far outside the null distribution, confirming that the observed high performance cannot be attributed to label leakage, structural class biases, or overfitting to small sample sizes. These results collectively support the robustness and generalizability of Dual-BINN on the breast cancer dataset.
In comparison with the biologically interpretable model PiDeeL [19], Dual-BINN showed improved performance on both datasets.
To further assess the relative performance under previously reported frameworks, we compared our results with the 10-DM model [20] reported in the original gastric cancer study. Given that both studies used the same dataset and a consistent data splitting strategy, the comparison is meaningful. Unlike the 10-DM model, which relies on feature selection and uses a limited number of metabolites, Dual-BINN directly utilizes all metabolites and learns discriminative features through structured constraints. Under this setting, Dual-BINN achieved a higher recall (0.937 vs. 0.905), indicating improved sensitivity in identifying positive samples. It should be noted that the 10-DM results were obtained from the original publication and were not reimplemented in this study; therefore, this comparison serves as a reference rather than a rigorous benchmark.
To address potential concerns regarding the robustness and generalizability of our results, and to rule out the possibility that the strong performance reported in Tables 1 and 2 arose from a particularly favorable data split, we conducted 5-fold stratified cross-validation on the training and validation cohorts. In each fold, the model was trained on a different partition of the development set, and all five fold-specific models were evaluated on the same independent external test set to assess model stability.
As shown in Figure 2 and Figure 3, Dual-BINN exhibited highly stable performance across folds. On the gastric cancer dataset (Figure 2), the model achieved a mean ROC-AUC of 0.929 (95% CI: 0.895–0.963) and a mean Recall of 0.902 (95% CI: 0.836–0.968). Other key metrics, including Accuracy (0.869 ± 0.039), Precision (0.902 ± 0.028), and PR-AUC (0.955 ± 0.030), also demonstrated narrow confidence intervals, indicating low variability across different data partitions. On the breast cancer dataset (Figure 3), Dual-BINN maintained near-perfect performance with a mean ROC-AUC of 0.998 (95% CI: 0.995–1.000) and mean Recall of 0.985 (95% CI: 0.955–1.000). The consistently high metrics and tight confidence intervals across both diseases confirm that the excellent classification performance is robust and not an artifact of a single train-test split.
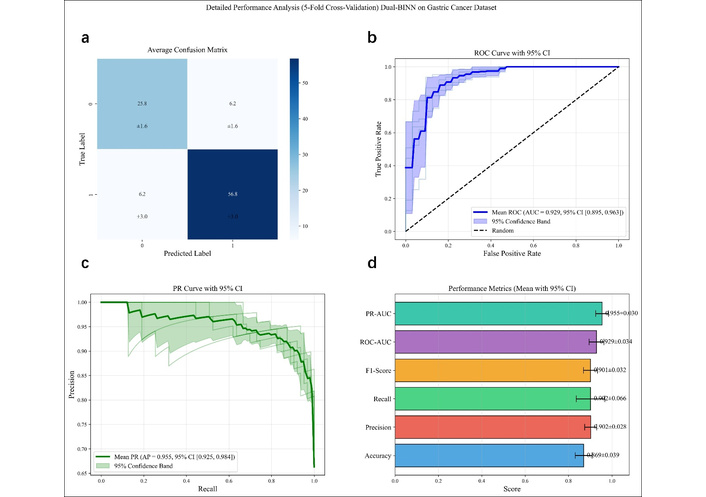
Five-fold model stability evaluation on the external test set for gastric cancer dataset. (a) Average confusion matrix (mean ± standard deviation). (b) ROC curve with 95% confidence interval. (c) PR curve with 95% confidence interval. (d) Classification performance metrics (Accuracy, Precision, Recall, F1-score, ROC-AUC, and PR-AUC) are reported as mean ± 95% confidence interval across the five folds.
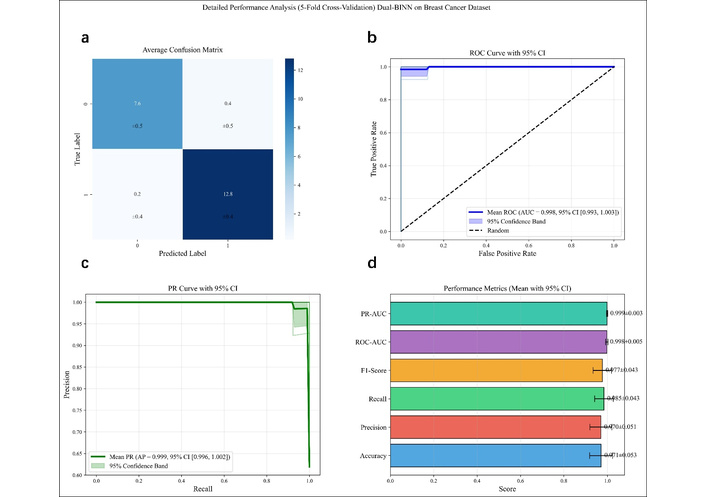
Five-fold model stability evaluation on the held-out test set for breast cancer dataset. (a) Average confusion matrix (mean ± standard deviation). (b) ROC curve with 95% confidence interval. (c) PR curve with 95% confidence interval. (d) Classification performance metrics (Accuracy, Precision, Recall, F1-score, ROC-AUC, and PR-AUC) are reported as mean ± 95% confidence interval across the five folds.
To systematically evaluate the contribution of key components in Dual-BINN, ablation experiments were conducted under identical experimental settings. Three variants were considered:
FullConnectedBINN (without biological prior constraints),
PathwayBINN (pathway subnetwork only),
StructureBINN (structure subnetwork only).
The results on both datasets (Tables 3 and 4) show that the full Dual-BINN consistently outperforms all ablated variants. Removing biological prior constraints leads to performance degradation, indicating the importance of structured sparse connections.
Comparison of ablation experiments of the model on the gastric cancer dataset.
| Model | Accuracy | Precision | Recall | ROC-AUC | PR-AUC |
|---|---|---|---|---|---|
| Dual-BINN | 0.895 | 0.908 | 0.937 | 0.956 | 0.975 |
| FullConnectedBINN | 0.863 | 0.891 | 0.905 | 0.931 | 0.969 |
| PathwayBINN | 0.863 | 0.868 | 0.937 | 0.940 | 0.968 |
| StructureBINN | 0.800 | 0.797 | 0.936 | 0.915 | 0.957 |
Bold values indicate the best-performing model for each metric.
Comparison of ablation experiments of the model on the breast cancer dataset.
| Model | Accuracy | Precision | Recall | ROC-AUC | PR-AUC |
|---|---|---|---|---|---|
| Dual-BINN | 1.000 | 1.000 | 1.000 | 1.000 | 1.000 |
| FullConnectedBINN | 0.909 | 1.000 | 0.857 | 1.000 | 1.000 |
| PathwayBINN | 0.954 | 0.933 | 1.000 | 1.000 | 1.000 |
| StructureBINN | 0.727 | 0.785 | 0.785 | 0.821 | 0.876 |
Bold values indicate the best-performing model for each metric.
To further evaluate whether the proposed adaptive complementary fusion mechanism provides an advantage over simpler fusion strategies, we compared it against three alternative fusion methods under identical training conditions: (i) simple concatenation of the two branch representations, (ii) a gated fusion with a scalar gate, and (iii) multi-head attention-based fusion. All comparisons were performed with matched parameter counts. Detailed results, including 95% confidence intervals, are provided in Table S1. In brief, on the more challenging gastric cancer dataset, the complementary fusion achieved the highest accuracy (0.895), ROC-AUC (0.956), and PR-AUC (0.975), outperforming concatenation, gated, and attention-based alternatives.
To systematically evaluate the biological interpretability of the Dual-BINN model, this study performed feature attribution analysis on the model’s predictions using the SHAP method. Combined with the model’s embedded metabolic pathway hierarchy and molecular structure hierarchy, we systematically dissected the mechanisms by which key metabolites act at different biological scales. Furthermore, through a comparative analysis of two independent datasets—gastric cancer and breast cancer—we assessed the consistency and biological plausibility of the model’s interpretation results in a cross‑disease context.
Among the top 10 key metabolites ranked by their contribution to gastric cancer classification (Figure 4), five (SAM [24], NAD [25, 26], Succinate [27], AMP [28, 29], Citrate [30]) have been confirmed in the literature to be closely associated with gastric cancer tumorigenesis, preliminarily validating the biological plausibility of the model’s identified features.
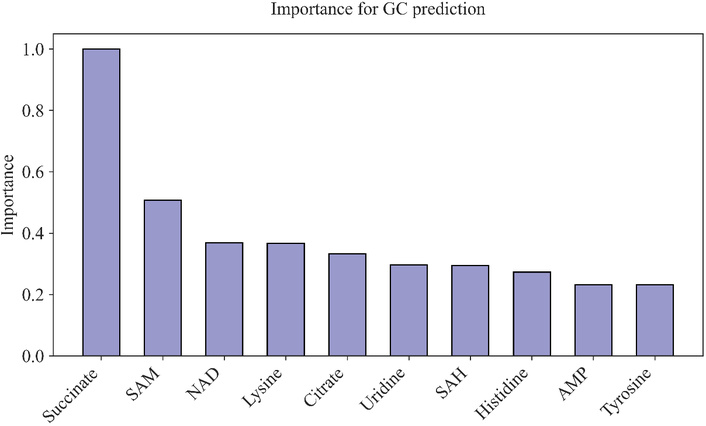
Top 10 metabolites for predicting gastric cancer (GC). The horizontal axis represents metabolites, and the vertical axis represents the relative importance of metabolites.
To further dissect the model’s decision‑making mechanism from the perspectives of functional pathways and chemical structures, we performed independent SHAP importance analyses on the pathway subnetwork and structure subnetwork, respectively, and selected the top 10 metabolites in each subnetwork to construct hierarchical network visualizations. In the pathway subnetwork (Figure 5), succinate and citrate, as core intermediates of the tricarboxylic acid (TCA) cycle, directly map to the “aerobic respiration and electron transport” and “glucose metabolism” nodes, reflecting the features of mitochondrial metabolic uncoupling and TCA flux redistribution in gastric cancer cells [31–33]. The importance of S‑adenosylmethionine (SAM) and S‑adenosylhomocysteine (SAH) is highly concentrated in “one‑carbon metabolism” and “epigenetic regulation” pathways, confirming the driving role of methyl donor cycle redirection and aberrant DNA/histone methylation in gastric cancer progression [34–37]. AMP and uridine support rapid tumor proliferation through “nucleotide synthesis” and “energy sensing” pathways. These metabolites are simultaneously concentrated in the structure subnetwork (Figure 6) among carboxylic acid derivatives, amino acids, and nucleosides.
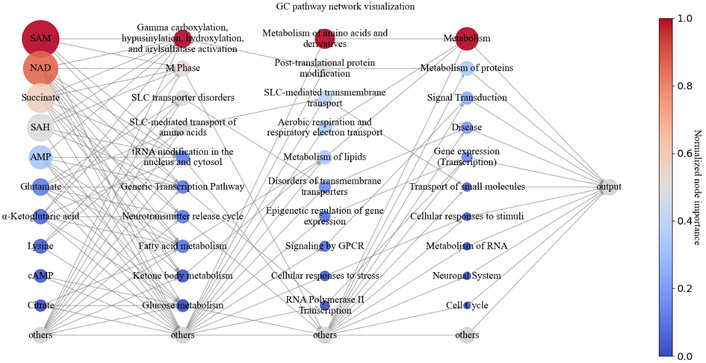
Hierarchical pathway network visualization for gastric cancer (GC). The network displays three levels of Reactome pathway hierarchy. Bottom layer: individual metabolites identified as important by SHAP. Middle layer: sub-pathways. Top layer: broad biological processes. Node colors represent normalized SHAP importance (darker red indicates higher contribution to the model’s prediction). Edges denote the hierarchical parent-child relationships from the Reactome ontology. Only the top-10 most important nodes per layer are labeled for clarity; gray nodes (“others”) aggregate less important nodes at the same level.
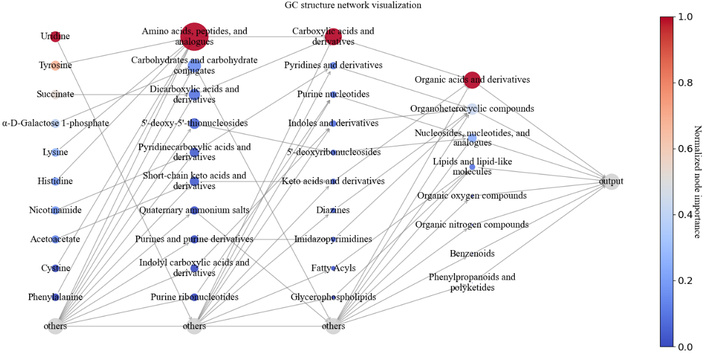
Hierarchical structural network visualization for gastric cancer (GC). The network represents the ClassyFire chemical taxonomy across three hierarchical levels. Bottom layer: individual metabolites. Middle layer: chemical classes. Top layer: superclasses. Node colors encode normalized SHAP importance (darker red indicates higher importance). Edges follow the parent-child relationships from the ClassyFire ontology. Only the top-10 nodes per layer are labeled; “others” nodes group the remaining entities.
Among the top 10 key metabolites ranked by their contribution to breast cancer classification (Figure 7), seven (Arachidonic acid [38], Cholesterol [39], Glutamate [40], Asparagine [41], Cysteine [42], Pseudouridine [43], Aspartate [44]) have been confirmed by literature to be closely associated with breast cancer tumorigenesis.
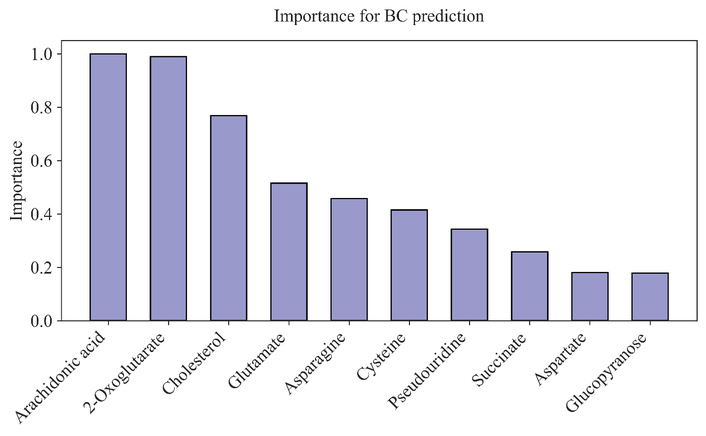
Top 10 metabolites for predicting breast cancer (BC). The horizontal axis represents metabolites, and the vertical axis represents the relative importance of metabolites.
In the pathway subnetwork (Figure 8), high‑importance nodes converge significantly onto “lipid metabolism”, “amino acid metabolism”, and “signal transduction” processes. The high weights of cholesterol and arachidonic acid are directly linked to the lipid signaling axis, where their metabolic derivatives drive invasion and metastasis through ERRα regulation and inflammatory microenvironment modulation [39]. The importance of asparagine and cysteine highlights the metabolic dependency of breast cancer on specific amino acids—asparagine drives distant metastasis, while cysteine maintains the glutathione pool via the xCT system to counteract ferroptosis [41, 42]. The coupling of 2‑oxoglutarate with glutamate/aspartate simultaneously supports both TCA anaplerosis and the epigenetic regulation mediated by α‑ketoglutarate‑dependent dioxygenases [40, 44]. The structural subnetwork further validates this functional mapping, with key metabolites clearly clustered into fatty acyls, steroid derivatives, and organic acids (Figure 9).
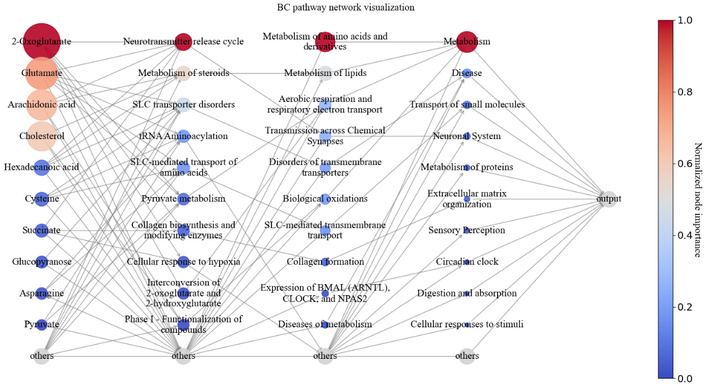
Hierarchical pathway network visualization for breast cancer (BC). The network displays three levels of Reactome pathway hierarchy. Bottom layer: individual metabolites identified as important by SHAP. Middle layer: sub-pathways. Top layer: broad biological processes. Node colors represent normalized SHAP importance (darker red indicates higher contribution to the model’s prediction). Edges denote the hierarchical parent-child relationships from the Reactome ontology. Only the top-10 most important nodes per layer are labeled for clarity; gray nodes (“others”) aggregate less important nodes at the same level.
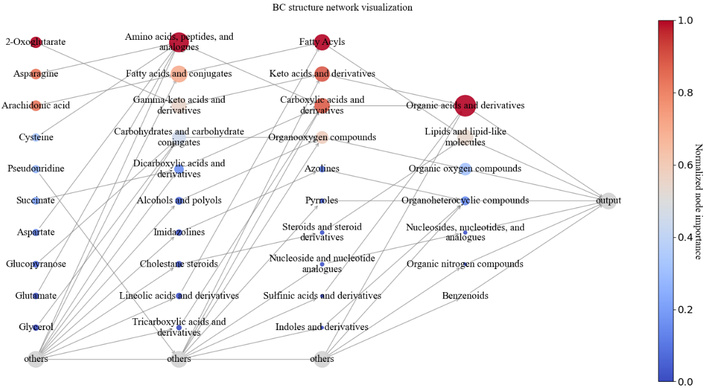
Hierarchical structural network visualization for breast cancer (BC). The network represents the ClassyFire chemical taxonomy across three hierarchical levels. Bottom layer: individual metabolites. Middle layer: chemical classes. Top layer: superclasses. Node colors encode normalized SHAP importance (darker red indicates higher importance). Edges follow the parent-child relationships from the ClassyFire ontology. Only the top-10 nodes per layer are labeled; “others” nodes group the remaining entities.
To empirically validate the faithfulness and robustness of our hierarchical SHAP propagation method, we performed perturbation-based faithfulness tests and bootstrap stability analyses. Given the near-perfect class separability of the breast cancer dataset, these evaluations were primarily conducted on the more challenging gastric cancer dataset, where model predictions have greater room for variation and thus provide more informative assessment.
First, we conducted a perturbation-based faithfulness test. As shown in Figure 10, progressively masking the Top-K most important metabolites resulted in significantly larger drops in ROC-AUC compared to masking Bottom-K or randomly selected metabolites. This pattern confirms that our propagation method successfully identifies metabolites that are truly influential to the model’s predictions.
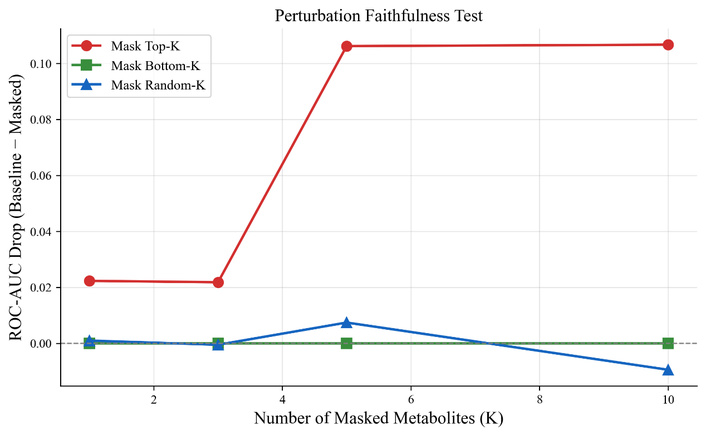
Perturbation faithfulness test. Masking top-ranked nodes causes substantially larger performance degradation, validating the reliability of the hierarchical SHAP propagation.
Second, we assessed stability across bootstrap resamples (n = 100, 80% sampling with replacement of the test set). As summarized in Table S2, node importance rankings became increasingly stable in higher layers. At the top pathway layer and structural class layer, the Top-10 nodes achieved perfect overlap (overlap rate = 1.00) across all resampled subsets. This high stability indicates that the identified key biological pathways and structural classes are robust to sample variation and not driven by outliers.
A key motivation of Dual‑BINN is to mitigate the impact of incomplete pathway annotations through complementary structural information. To quantitatively evaluate this claim, we first assessed metabolite annotation coverage in both datasets (Table 5). The structure branch (ClassyFire) provided substantially higher coverage than the pathway branch (Reactome) in both datasets (90.0% vs. 72.8% for gastric cancer; 89.1% vs. 53.9% for breast cancer). Notably, all metabolites mapped to the pathway branch were also covered by the structure branch. Consequently, metabolites that appear exclusively in the structure branch represent those with structural annotations but missing pathway information.
Metabolite annotation coverage in the two datasets.
| Dataset | Total Metabolites | Pathway Metabolites | Structure Metabolites | Both Branches | Pathway Coverage (%) | Structure Coverage (%) |
|---|---|---|---|---|---|---|
| GC | 147 | 107 | 132 | 107 | 72.8 | 90.0 |
| BC | 128 | 69 | 114 | 69 | 53.9 | 89.1 |
GC represents gastric cancer and BC represents breast cancer.
To further investigate the contribution of these structure‑only metabolites, we conducted a sensitivity analysis by removing them and retraining the model using only dual‑annotated metabolites. The results are shown in Table 6 (gastric cancer) and Table 7 (breast cancer).
Gastric cancer sensitivity analysis without structure-only metabolites.
| Scheme | Number | Retained (%) | Accuracy | Precision | Recall | ROC-AUC | PR-AUC |
|---|---|---|---|---|---|---|---|
| Full | 132 | 90 | 0.895 | 0.908 | 0.937 | 0.956 | 0.975 |
| Dual-annotated | 107 | 72.8 | 0.851 | 0.900 | 0.871 | 0.928 | 0.950 |
Full represents metabolites that can be mapped to at least one subnetwork. Dual-annotated represents metabolites present in both subnetworks.
Breast cancer sensitivity analysis without structure-only metabolites.
| Scheme | Number | Retained (%) | Accuracy | Precision | Recall | ROC-AUC | PR-AUC |
|---|---|---|---|---|---|---|---|
| Full | 114 | 89.1 | 1.000 | 1.000 | 1.000 | 1.000 | 1.000 |
| Dual-annotated | 69 | 53.9 | 1.000 | 1.000 | 1.000 | 1.000 | 1.000 |
Full represents metabolites that can be mapped to at least one subnetwork. Dual-annotated represents metabolites present in both subnetworks.
For the gastric cancer dataset, removing structure‑only metabolites (retaining 72.8% of original metabolites) led to a clear performance drop: accuracy decreased from 0.895 to 0.851, recall from 0.937 to 0.871, and ROC‑AUC from 0.956 to 0.928. This decline demonstrates that the structure‑only metabolites carry valuable predictive signals that partially compensate for missing pathway annotations, supporting the dual‑branch design.
For the breast cancer dataset, performance remained perfect even after removing structure-only metabolites, likely reflecting the strong inherent separability of this dataset rather than an absence of compensatory value.
Dual-BINN consistently outperformed conventional machine learning approaches, including logistic regression, SVM, XGBoost, and the general deep learning model MLP, across both disease datasets. On the gastric cancer dataset, Dual-BINN achieved the highest ROC-AUC (0.956) and PR-AUC (0.975) among all compared methods, while maintaining the highest recall (0.937), a critical property in clinical screening contexts where false negatives carry greater clinical cost than false positives. The notably poor performance of MLP (ROC-AUC = 0.811) relative to structurally constrained models underscores the limitation of unconstrained feature learning in high-dimensional, low-sample metabolomics settings, where data-driven approaches risk overfitting or capturing spurious correlations without biological grounding.
Compared with PiDeeL [19], the most directly comparable biologically informed deep learning model for metabolomics, Dual-BINN achieved higher accuracy and ROC-AUC on both datasets. The key architectural distinction lies in the depth and persistence of biological constraints: PiDeeL applies pathway information only at the initial layers, with deeper representations reverting to fully connected architectures, which progressively dilutes the pathway prior through unrestricted feature mixing during both forward propagation and backpropagation. Dual-BINN addresses this limitation by enforcing binary sparse connectivity masks across every linear layer in both subnetworks, ensuring that hierarchical inductive bias is preserved from input to the final hidden representation and that gradients flow only along biologically sanctioned connections. This persistent constraint not only improves predictive performance but also renders intermediate representations interpretable at every layer of the biological hierarchy.
In reference comparison with the 10-DM model reported by Chen et al. [20] on the same gastric cancer dataset split, Dual-BINN achieved a higher recall (0.937 vs. 0.905). The 10-DM model relies on explicit feature selection, retaining a limited subset of metabolites prior to modeling. In contrast, Dual-BINN operates on the full metabolite set and learns discriminative structure through biologically constrained sparse connectivity, suggesting that structured architectural priors may serve as an effective alternative to upstream feature selection. However, as the 10-DM results were drawn directly from the original publication without re-implementation under matched conditions, this comparison should be treated as indicative rather than definitive.
Ablation experiments were conducted to isolate the contribution of individual architectural components. The full Dual-BINN outperformed all three variants (FullConnectedBINN, PathwayBINN, and StructureBINN) on both datasets, indicating that the performance gains reflect the joint contribution of dual biological priors and structured sparse connectivity rather than any single design choice.
Among the single-branch variants, PathwayBINN achieved recall on the gastric cancer dataset (0.937) comparable to the full model, suggesting that metabolic pathway information constitutes the dominant disease-discriminative signal, in line with the established role of pathway-level reprogramming in gastric cancer pathogenesis. StructureBINN showed markedly reduced precision (0.797) and accuracy (0.800), consistent with the expectation that chemical structural similarity alone, absent functional pathway constraints, provides insufficient basis for discriminating disease states. Of particular note, FullConnectedBINN retains both branches but removes all biological prior constraints; its lower performance relative to the full model (accuracy 0.863 vs. 0.895; ROC-AUC 0.931 vs. 0.956) indicates that biologically constrained sparse connectivity, rather than the dual-branch topology per se, is the primary determinant of the performance advantage. This finding aligns with the broader principle established in P-NET [17] and BINN [18] that encoding prior biological structure into network topology improves both performance and generalization in low-data biomedical settings.
Further comparison of fusion strategies on the gastric cancer dataset confirmed that the proposed adaptive complementary fusion mechanism outperforms simple concatenation, scalar gated fusion, and multi-head attention-based fusion (Table S1) in terms of accuracy, ROC-AUC, and PR-AUC. The advantage of the sample-specific gating mechanism is conceptually important: different samples may exhibit predominantly pathway-driven or structure-driven metabolic signatures, and a fixed-weight fusion cannot accommodate this heterogeneity. By computing the gating coefficient α from the joint representation of each sample’s pathway and structural features, the model dynamically adjusts the relative contribution of the two branches, providing a form of personalized biological integration that is not available in static fusion approaches.
Application of the hierarchical SHAP propagation framework yielded multi-scale interpretations spanning individual metabolites, subpathway nodes, and broad biological process categories. In the gastric cancer analysis, the highest-ranked metabolites (SAM, NAD, succinate, AMP, and citrate) are well-established components of TCA cycle regulation, one-carbon metabolism, and energy sensing pathways, in agreement with known patterns of metabolic reprogramming in gastric cancer [31–37]. Crucially, the pathway and structural subnetworks produced convergent importance patterns: metabolites ranked highly by pathway SHAP were simultaneously clustered into chemically coherent classes (carboxylic acid derivatives, amino acids, nucleosides) in the structural subnetwork. This cross-branch consistency indicates that the model captures coordinated metabolic perturbations rather than isolated statistical associations, lending biological credibility to the identified features.
In the breast cancer analysis, high-importance metabolites (arachidonic acid, cholesterol, asparagine, cysteine, glutamate, and aspartate) showed coherent mapping onto lipid metabolism, amino acid metabolism, and signal transduction in the pathway subnetwork, while the structural subnetwork grouped them into fatty acyls, steroid derivatives, and organic acids. The identification of asparagine and cysteine as high-importance features is particularly noteworthy given their established mechanistic roles: asparagine bioavailability has been shown to govern metastatic capacity [41], while cysteine supports tumor survival through the xCT-glutathione axis [42].
The perturbation-based faithfulness test (Figure 10) confirmed that progressively masking top-ranked metabolites produced substantially larger ROC-AUC degradation than masking bottom-ranked or randomly selected metabolites, validating that the SHAP propagation correctly identifies functionally important nodes. Bootstrap stability analysis (Table S2) further demonstrated that top-pathway and top-structural-class assignments achieved perfect overlap (rate = 1.00) across 100 resamples, confirming that the identified biological modules are robust to sample variation and not driven by outliers.
A core motivation of the dual-branch design was to mitigate the impact of incomplete pathway annotations, a pervasive limitation in metabolomics where a substantial proportion of detected metabolites lack pathway assignments in curated databases. The annotation coverage analysis (Table 5) quantified this gap: Reactome pathway coverage was 72.8% for the gastric cancer dataset and only 53.9% for the breast cancer dataset, while ClassyFire structural coverage reached 90.0% and 89.1%, respectively. The substantially higher and more uniform coverage of the structural branch confirms that chemical ontologies provide a more complete biological prior than pathway databases for current metabolomics data.
The sensitivity analysis on the gastric cancer dataset directly quantified the predictive value of structure-only metabolites. Removing the 25 metabolites with structural but no pathway annotations caused clear performance drops across all metrics (accuracy: 0.895 → 0.851; recall: 0.937 → 0.871; ROC-AUC: 0.956 → 0.928), demonstrating that these metabolites carry genuine predictive signals that are lost when only pathway-annotated metabolites are retained. The breast cancer dataset showed no degradation upon removal of structure-only metabolites, which is attributable to the strong inherent separability of that dataset rather than an absence of compensatory value—a ceiling effect that prevents detection of further improvement when all models already achieve near-perfect performance, as evidenced by the high baseline performance of even simple classifiers such as Decision Tree (ROC-AUC = 0.911) in Table 2.
Several limitations of the current study warrant acknowledgment. First, the framework relies on the completeness and accuracy of Reactome and ClassyFire as external knowledge bases. Potential biases in pathway annotation—such as overrepresentation of well-studied metabolic processes and underrepresentation of lipid and xenobiotic metabolism—may influence which metabolites receive pathway assignments and thereby affect the relative contributions of the two branches. Similarly, the granularity of ClassyFire classification may not fully capture functional distinctions among structurally similar but biologically divergent metabolites. Second, the gastric cancer dataset, while multi-center, originates from a single published study with predefined cohort splits; independent external validation on additional cohorts collected under different analytical conditions would strengthen confidence in the model’s generalizability. Third, the breast cancer dataset is relatively small (n = 211) and exhibits strong class separability, which limits its utility for discriminating among modeling approaches and may not represent more challenging clinical scenarios. Finally, the current model operates on static metabolite concentration profiles and cannot capture temporal dynamics of metabolic reprogramming, which limits mechanistic inference about disease progression.
Future extensions of this work include integration of transcriptomic and proteomic data within the dual-branch framework, incorporation of time-series or dynamic graph representations to model metabolic trajectory, and replacement of linear sparse layers with graph neural network modules operating on molecular graphs. Prospective validation on independent cohorts, formal pathway enrichment testing of model-prioritized modules, and expert-guided functional validation of candidate biomarkers will be necessary prerequisites for clinical application of this approach.
Dual-BINN: dual-branch biologically informed neural network
SVM: Support Vector Machine
TCA: tricarboxylic acid
The supplementary material for this article is available at: https://www.explorationpub.com/uploads/Article/file/1008170_sup_1.pdf. The supplementary tables for this article are available at: https://www.explorationpub.com/uploads/Article/file/1008170_sup_2.xlsx.
LG: Methodology, Investigation, Data curation, Writing—original draft. XW: Investigation, Data curation. SL: Conceptualization, Investigation. CX: Formal analysis, Visualization. KY: Validation, Supervision, Writing—review & editing. All authors read and approved the submitted version.
The authors declare that they have no conflicts of interest.
Not applicable.
Not applicable.
Not applicable.
The gastric cancer metabolomics dataset used in this study is derived from a previously published multi‑center study by Chen et al. (DOI: 10.1038/s41467-024-46043-y), which conducted targeted metabolomics analysis on plasma samples from 702 participants across three independent cohorts.
The breast cancer metabolomics dataset is publicly available from the Metabolomics Workbench repository, a public repository for metabolomics data and metadata supported by the NIH Common Fund’s Metabolomics Program. The dataset can be accessed under Study ID: ST000355 (URL: https://www.metabolomicsworkbench.org/data/DRCCMetadata.php?Mode=Study&StudyID=ST000355). This GC‑MS‑based study includes 211 plasma samples from 135 breast cancer patients and 76 non‑cancer controls.
All data were used in accordance with the repository’s terms of use and the original study’s data sharing policies. No new data were generated during this study.
This work was supported by the National Key R&D Program of China [2024YFC3607500] and the Key Research and Development Project in Henan Province [No.241111114200]. The funders had no role in study design, data collection and analysis, decision to publish, or preparation of the manuscript.
© The Author(s) 2026.
Open Exploration maintains a neutral stance on jurisdictional claims in published institutional affiliations and maps. All opinions expressed in this article are the personal views of the author(s) and do not represent the stance of the editorial team or the publisher.
Copyright: © The Author(s) 2026. This is an Open Access article licensed under a Creative Commons Attribution 4.0 International License (https://creativecommons.org/licenses/by/4.0/), which permits unrestricted use, sharing, adaptation, distribution and reproduction in any medium or format, for any purpose, even commercially, as long as you give appropriate credit to the original author(s) and the source, provide a link to the Creative Commons license, and indicate if changes were made.



View: 765
Download: 7
Times Cited: 0


