 Original Article

Affiliation:
1Liver Diseases Research Lab, Department of Biochemistry, Jawaharlal Institute of Postgraduate Medical Education and Research, Pondicherry 605006, India
Email: balasubramaniyan.v@jipmer.edu.in
ORCID: https://orcid.org/0000-0003-1708-4864
Affiliation:
1Liver Diseases Research Lab, Department of Biochemistry, Jawaharlal Institute of Postgraduate Medical Education and Research, Pondicherry 605006, India
ORCID: https://orcid.org/0009-0002-4100-9688
Affiliation:
2Department of Medicine, Jawaharlal Institute of Postgraduate Medical Education and Research (JIPMER), Pondicherry 605006, India
ORCID: https://orcid.org/0000-0003-0633-4864
Explor Dig Dis. 2025;4:100574 DOI: https://doi.org/10.37349/edd.2025.100574
Received: January 07, 2025 Accepted: April 23, 2025 Published: May 19, 2025
Academic Editor: Jean Francois D. Cadranel, GHPSO, France
The article belongs to the special issue Cirrhosis and Its Complications
Aim: Our previous study provided evidence that systemic zonula occludens (ZO) 1 levels are elevated in cirrhotic and hepatocellular carcinoma (HCC) patients. Here, we aimed to evaluate serum ZO-1 levels in patients with decompensated alcoholic cirrhosis (DCAC) with hepatorenal syndrome (HRS) and compare its diagnostic potential with the well-established HRS biomarker, cystatin C.
Methods: A total of 36 DCAC patients with HRS and 40 healthy volunteers were recruited. Serum ZO-1, cystatin C, and clinical chemistry parameters were analysed.
Results: Compared to control subjects, DCAC patients with HRS exhibited significantly higher ZO-1 levels (7.059 ± 0.29 vs. 0.788 ± 0.11; p < 0.0001) and cystatin C levels (2.97 ± 0.24 vs. 1.59 ± 0.04; p < 0.0001). Serum ZO-1 correlated positively with cystatin C (r = 0.561, p < 0.0001), serum creatinine (r = 0.779, p < 0.0001), and MELD-Na (r = 0.850, p < 0.0001). Moreover, ZO-1 demonstrated a higher area under the curve (AUC) than cystatin C, indicating a better diagnostic potential for HRS in DCAC patients.
Conclusions: These findings suggest that ZO-1 may serve as a valuable biomarker for HRS in DCAC patients. However, further validation in a larger cohort is necessary to confirm its clinical utility.
Hepatorenal syndrome (HRS) refers to the kidney dysfunction that occurs in patients with liver cirrhosis, in particular, in those with hepatic decompensation [1]. Untreated HRS has a 90% mortality rate in three-month intervals, and the only definite treatment is liver transplantation (LT) [2]. Furthermore, HRS accounts for the death rate of 5.4% and 20.2% with compensated cirrhosis (CC) and decompensated cirrhosis (DC), respectively [3, 4]. Two types of HRS have been defined: the acute form implying acute kidney injury (HRS-AKI—type I), which occurs following acute decompensation of cirrhosis in patients with refractory ascites, and the chronic form inferring chronic kidney disease (HRS-CKD—type II). The prevalence of type I HRS is more than type II HRS (67.8% vs. 32.1%) [1, 4, 5]. In the Indian population, HRS-AKI accounts for ~24% in hospitalised cirrhotic patients with acute decompensation and is associated with high mortality [6]. The probability of development of HRS-AKI is 18% at 1st year and 39% at 5 years in cirrhotic patients with ascites [5]. Portal hypertension (PHT), systemic bacterial peritonitis (SBP), and gastrointestinal (GI) tract infections are the key precipitating factors responsible for the onset of HRS [1, 7, 8]. Also, patients with severe alcoholic hepatitis have a higher prevalence of HRS and a short-term mortality rate [2]. To date, the therapeutic approach to managing HRS-AKI remains supportive and the only bridge to LT. Consequently, a better understanding of the different pathophysiological mechanisms is a prerequisite for HRS-AKI. In addition, identifying the new biomarkers for the diagnosis of HRS-AKI is a key unmet need to distinguish between acute tubular necrosis (ATN)-AKI and HRS-AKI.
Although serum creatinine is considered a common biomarker for renal dysfunction, it has several limitations in cirrhotic patients due to muscle wasting, malnutrition, and hyperbilirubinemia [9, 10]. Cystatin C is a reversible cysteine protease inhibitor and is expressed in nearly every nucleated cell. It has emerged as a reliable marker for the determination of estimated glomerular filtration rate (eGFR) than creatinine and effectively reflects the status of kidney dysfunction [9, 11–13]. It was shown in cirrhotic patients that cystatin C was used as a prognostic marker to predict HRS and mortality [12]. Also, cystatin C-based estimation of GFR was used as the predictive marker of overall survival in cirrhosis [9]. Indeed, cystatin C has low accuracy in predicting the differential diagnosis of AKI. Further, it is critical to accentuate that urinary neutrophil gelatinase-associated lipocalin (uNGAL) is a marker of ATN and not a marker of HRS-AKI [14]. Since there is a lack of histologic abnormalities in the kidney, the invention of new biomarkers of HRS-AKI should be in the plasma and not in urine [1]. Therefore, it is imperative to study the specific biomarkers for HRS, which could be used as a positive tool to diagnose HRS-AKI.
Tight junctions (TJs) are cell-cell adhesion complexes that play a crucial dual role as a barrier as well as a fence to restrict molecules of different charge and size across epithelia [15]. Without TJ, transepithelial concentration gradients of ions or nutrients would be dissipated through the paracellular space [15]. Therefore, an appropriate function of epithelial TJ is vital for maintaining tissue homeostasis [16]. Zonula occludens (ZO) 1 is a membrane scaffold protein with a molecular mass of 220 kDa and is required for TJ assembly. ZO-1 expression was shown in different kidney cells, including tubular epithelial cells [17, 18]. It has been shown that dysregulated TJ proteins may contribute to tubular leakage in AKI, resulting in lowered GFR and oliguria [19]. Furthermore, AKI is associated with abnormal expression of TJ proteins and is reversed by reno-protective drugs, thereby restoring kidney dysfunction [20]. Our previous studies show evidence that elevated systemic ZO-1 was associated with inflammation and an independent biomarker in patients with cirrhosis and hepatocellular carcinoma (HCC) [20, 21]. Indeed, the systemic concentration of ZO-1 and its association with renal dysfunction in decompensated alcoholic cirrhosis (DCAC) patients remains unknown. Moreover, identifying biomarkers in cirrhotic patients at increased risk of developing HRS is crucial. Therefore, we aimed to analyse serum ZO-1 levels and compare their diagnostic utility with cystatin C in cirrhotic patients with HRS.
This cross-sectional analytical study was conducted in the departments of Biochemistry and Medicine, Jawaharlal Institute of Postgraduate Medical Education and Research (JIPMER), Puducherry, during February 2020 to February 2021. This study was approved by the JIPMER Ethics Committee (Human Studies) based on the Ethical guidelines of the Helsinki Declaration of 2013. Blood samples were collected from both the controls and cases after their informed consent documents were obtained.
We recruited both male and female participants aged > 18 years with DCAC (Child-Pugh C) who were admitted to the department of medicine ward or OPD at JIPMER. The diagnosis of DC with ascites was based on radiological findings, such as evidence of either shrunken liver or increased liver nodularity. HRS development was confirmed in all patients by elevated serum creatinine levels within the specified time frame, according to the criteria set by the International Ascites Club (IAC). Patients with a history of nephrotoxic drug use within the past month or those with parenchymal kidney disease, indicated by proteinuria > 500 mg/day or microhaematuria, were excluded from the study. Clinical characteristics, including ascites, SBP, hepatic encephalopathy (HE), or variceal bleeding due to PHT, were recorded. Disease severity was assessed using the Child–Pugh score. Age and gender-matched healthy volunteers (n = 40) who were physically and mentally healthy, had normal liver function tests, and had no recent history of infections or tumors were included as control subjects.
After collecting 5 mL of blood from study participants into pre-cooled tubes, either with or without EDTA coating, the samples were centrifuged at 3,000 rpm for 10 min. The separated plasma/serum was immediately used for routine biochemical parameter analysis. In addition, ~1 mL of plasma/serum was stored separately at –80˚C for further analysis of ZO-1 and cystatin C using ELISA.
Biochemical parameters such as alanine aminotransferase (ALT), aspartate aminotransferase (AST), alkaline phosphatase (ALP), gamma-glutamyl transferase (γGT), albumin, total protein, total and direct bilirubin, urea, creatinine, sodium, potassium, and chloride concentrations were measured by AU5800 Beckman Coulter (USA) autoanalyzer. Serum prothrombin time/international normalized ratio (PT/INR) levels in HRS patients were measured using a chemiluminescence immunoassay system (Siemens ADVIA Centaur CP) at the time of diagnosis.
Serum ZO-1 (Catalog No: E-EL-H1516) concentration was analysed using an ELISA with commercially available kits from Elabscience (Houston, Texas, USA). Briefly, either 50 μL of standard solution or 50 μL of plasma was added to wells of a microplate pre-coated with an antibody specific for ZO-1. Subsequently, 10 μL of biotin-labeled anti-ZO-1 antibody was added to each well, and the plate was incubated at 37 °C for 60 min. After incubation, the wells were washed three times with wash buffer to remove unbound components, followed by the addition of streptavidin-HRP conjugate. The plate was then incubated for 30 min at 37 °C. After a second washing step to remove excess enzyme conjugate, substrate solutions A and B were added. The resulting color intensity was measured, which correlated positively with the concentration of human ZO-1 in the samples. Results were expressed in ng/mL. According to the manufacturer’s specifications, the assay had a detection range of 0.2–10 ng/mL and a sensitivity of 0.09 ng/mL. Similarly, serum cystatin C (Catalog No: E-EL-H1835) concentration was analysed by ELISA using commercially available kits from Elabscience (Houston, Texas, USA), with results expressed in mg/L. All ELISA procedures were performed according to the manufacturer’s instructions.
Data are presented as Mean ± SEM. Statistical significance between cases and controls was assessed using two-tailed unpaired t-tests or the Mann–Whitney test, as appropriate. The correlation coefficient (Rho) was determined using Spearman’s correlation analysis. Receiver operating characteristic (ROC) curve analysis was done to evaluate sensitivity and specificity for potential cut-off values of serum ZO-1 and cystatin C levels. All statistical analysis were performed using GraphPad Prism 10.0 (SanDiego, CA) and Microsoft Excel 2021 (Microsoft Corp., Redmond, WA).
The baseline clinical characteristics of the patients are presented in Table 1. All DCAC patients with HRS had developed PHT and had a history of alcoholism. Moreover, pedal edema was observed in most patients, 92% had ascites, and 72% had esophageal varices. Only 3% tested positive for HBs Ag, while the remaining patients had no viral infections. Furthermore, 89% of DCAC patients with HRS exhibited varying grades of HE, and 92% were classified as Child-Pugh class C.
Clinical and radiological findings of decompensated cirrhotic patients with HRS
| Characters | Decompensated alcoholic cirrhosis with HRS | |
|---|---|---|
| n = 36 | % | |
| Alcoholic | 36 | 100 |
| PHT | ||
| Present | 36 | 100 |
| Pedal edema | ||
| Present | 29 | 81 |
| Absent | 7 | 19 |
| Ascites | ||
| Absent | 3 | 8 |
| Mild | 10 | 28 |
| Moderate | 15 | 42 |
| Severe | 8 | 22 |
| Esophageal varices | ||
| Absent | 10 | 28 |
| Grade I | 7 | 19 |
| Grade II | 13 | 36 |
| Grade III | 5 | 14 |
| Grade IV | 1 | 3 |
| Hepatitis infection | ||
| No hepatitis infection | 35 | 97 |
| HBs Ag positive | 1 | 3 |
| HCV positive | 0 | 0 |
| Encephalopathy | ||
| Grade 0 | 4 | 11 |
| Grade I | 10 | 28 |
| Grade II | 12 | 33 |
| Grade III | 7 | 19 |
| Grade IV | 2 | 6 |
| Grade V | 1 | 3 |
| Child class | ||
| A | 0 | 0 |
| B | 3 | 8 |
| C | 33 | 92 |
PHT: portal hypertension; HBs Ag: hepatitis B surface antigen; HCV: hepatitis C virus
The patient’s demographic and biochemical parameters are presented in Table 2. Compared to control subjects, body mass index (BMI) was significantly lower in DCAC patients with HRS (p < 0.0001). Moreover, DCAC patients who developed HRS exhibited worse liver and renal function, with higher model for end-stage liver disease (MELD)-Na and Child-Pugh scores. Urea and creatinine levels were significantly elevated, while sodium levels were markedly lower in HRS patients compared to healthy controls. Serum globulin, bilirubin (total and direct), AST, ALT, γGT, and ALP levels were significantly increased, whereas total protein and albumin concentrations were notably reduced in HRS patients compared to control subjects. Furthermore, serum PT and INR were significantly higher in HRS patients than in control subjects (p < 0.0001, for both).
Demographic, biochemical parameters and disease severity in decompensated cirrhotic patients with HRS
| Variable | Control subjects(n = 40) | Decompensated alcoholic cirrhosis with HRS(n = 36) | p-value |
|---|---|---|---|
| Gender (M/F) | 26/14 | 33/3 | - |
| Age (Years) | 37.65 ± 1.49 | 46.613 ± 1.74 | < 0.0001 |
| BMI (kg/M2) | 25.90 ± 0.55 | 22.26 ± 0.39 | < 0.0001 |
| Total bilirubin (mg/dL) | 0.62 ± 0.05 | 9.63 ± 1.45 | < 0.0001 |
| Direct bilirubin (mg/dL) | 0.13 ± 0.01 | 5.63 ± 1.05 | < 0.0001 |
| Total protein (g/dL) | 7.58 ± 0.07 | 5.92 ± 0.22 | < 0.0001 |
| Albumin (g/dL) | 4.45 ± 0.11 | 2.11 ± 0.10 | < 0.0001 |
| Globulin (g/dL) | 3.03 ± 0.06 | 3.82 ± 0.17 | 0.0002 |
| ALT (IU/L) | 27.30 ± 2.17 | 45.00 ± 4.46 | 0.0001 |
| AST (IU/L) | 24.28 ± 1.02 | 98.03 ± 14.63 | < 0.0001 |
| γGT (IU/L) | 26.55 ± 2.20 | 82.64 ± 16.10 | 0.001 |
| ALP (IU/L) | 67.50 ± 2.74 | 131.4 ± 10.03 | < 0.0001 |
| Urea (mg/dL) | 23.48 ± 0.98 | 81.97 ± 9.94 | < 0.0001 |
| Creatinine (mg/dL) | 0.79 ± 0.03 | 2.63 ± 0.23 | < 0.0001 |
| Sodium (mEq/L) | 135.8 ± 0.43 | 128.1 ± 1.31 | < 0.0001 |
| Potassium (mEq/L) | 4.19 ± 0.07 | 4.26 ± 0.13 | NS |
| Chloride (mEq/L) | 99.75 ± 0.30 | 99.31 ± 1.4 | NS |
| PT (Sec) | 14.63 ± 0.19 | 24.50 ± 2.04 | < 0.0001 |
| INR | 1.08 ± 0.01 | 2.12 ± 0.17 | < 0.0001 |
| Child-Pugh score | - | 12.1 ± 0.27 | - |
| MELD score | - | 28.28 ± 1.42 | - |
| MELD-Na | - | 28.28 ± 1.42 | - |
Data are expressed as mean ± SEM. Mann–Whitney test was performed, and p < 0.05 was considered statistically significant. HRS: hepatorenal syndrome; BMI: body mass index; ALT: alanine aminotransferase; AST: aspartate aminotransferase; ALP: alkaline phosphatase; γGT: gamma-glutamyl transaminase; INR: international normalized ratio; MELD: model for end-stage liver disease; PT: prothrombin time; NS: no significant difference between control subjects and HRS cases
Serum ZO-1 and cystatin C levels in control subjects and DCAC patients with HRS are shown in Figure 1. Compared to control subjects, DCAC patients with HRS exhibited significantly higher concentrations of ZO-1 (7.059 ± 0.29 vs. 0.788 ± 0.11; p < 0.0001) and cystatin C (2.97 ± 0.24 vs. 1.59 ± 0.04; p < 0.0001). A positive correlation was observed between serum ZO-1 and cystatin C (r = 0.561; p < 0.0001) (Figure 1C). Additionally, ZO-1 showed positive correlations with urea, AST, ALT, ALP, γGT, bilirubin, PT, INR, and Child-Pugh score, while it was negatively correlated with total protein, albumin, and sodium (Table 3).
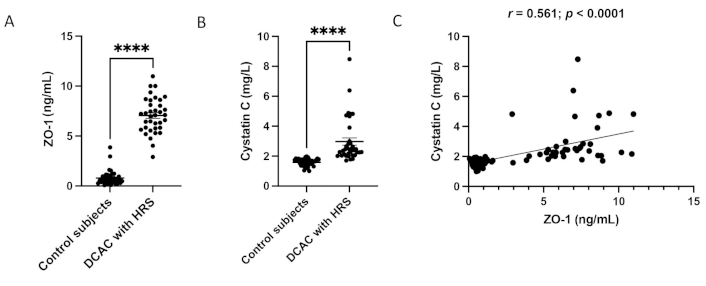
The circulating ZO-1 (A) and cystatin C (B) levels were measured by ELISA. Individual samples are represented as dots (n = 40; n = 36). (C) the correlation between ZO-1 and cystatin C (r = 0.561; p < 0.0001); values are expressed as mean ± SEM. Mann–Whitney test was performed, and p < 0.05 was considered statistically significant. Symbols represent ****p < 0.0001. ZO-1: zonula occludens-1; DCAC: decompensated alcoholic cirrhosis
Correlation of serum ZO-1 with biochemical parameters and disease severity in DCAC patients with HRS
| Parameters | Pearson correlation coefficient | p value |
|---|---|---|
| Creatinine | 0.590 | < 0.0001 |
| Urea | 0.497 | < 0.0001 |
| Total protein | –0.486 | < 0.0001 |
| Albumin | –0.779 | < 0.0001 |
| AST | 0.436 | < 0.0001 |
| ALT | 0.257 | < 0.05 |
| γGT | 0.384 | < 0.001 |
| ALP | 0.563 | < 0.0001 |
| Total bilirubin | 0.515 | < 0.0001 |
| Direct bilirubin | 0.439 | < 0.0001 |
| Sodium | –0.495 | < 0.0001 |
| Potassium | 0.081 | 0.449 |
| Chloride | –0.035 | 0.761 |
| PT | 0.488 | < 0.0001 |
| INR | 0.559 | < 0.0001 |
| Child-Pugh score | 0.708 | < 0.0001 |
| MELD score | 0.419 | < 0.0001 |
| MELD-Na | 0.849 | < 0.0001 |
ZO-1: zonula occludens-1; DCAC: decompensated alcoholic cirrhosis; HRS: hepatorenal syndrome; ALT: alanine aminotransferase; AST: aspartate aminotransferase; ALP: alkaline phosphatase; γGT: gamma-glutamyl transferase; INR: international normalized ratio; MELD: model for end-stage liver disease; PT: prothrombin time
Correlation analysis between ZO-1 and creatinine, cystatin C and creatinine, and ZO-1 and MELD-Na is shown in Figure 2. Serum cystatin C (Figure 2A) exhibited a positive correlation with serum creatinine (r = 0.375, p < 0.01). Similarly, serum ZO-1 showed a strong positive correlation with serum creatinine (Figure 2B) and MELD-Na (Figure 2C) (r = 0.779, p < 0.0001; r = 0.850, p < 0.0001), respectively.
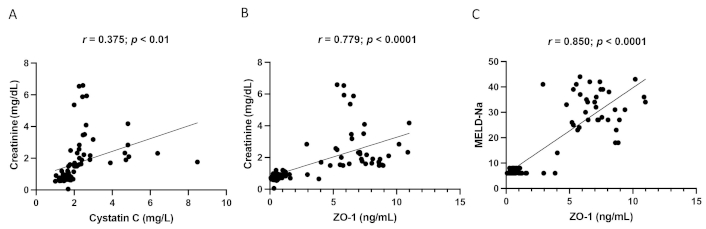
Correlation analysis between cystatin C and creatinine (A), ZO-1 and creatinine (B), and ZO-1 and MELD-Na (C) in DCAC patients with HRS. ZO-1: zonula occludens-1; DCAC: decompensated alcoholic cirrhosis; HRS: hepatorenal syndrome; MELD: model for end-stage liver disease
The ROC curve analysis for sensitivity, specificity, and area under the curve (AUC) of ZO-1 and cystatin C is shown in Table 4 and Figure 3A and Figure 3B. A ZO-1 concentration above the cut off of 3.412 ng/mL had an AUC of 0.998 (95% CI: 0.995–1.000; p < 0.0001) with a sensitivity of 97.22% (95% CI: 87.12–99.87) and a specificity of 97.5% (95% CI: 87.12–99.87), for predicting HRS diagnosis in DCAC patients. Similarly, a cystatin C concentration above the cut-off of 1.958 mg/L had an AUC of 0.978 (95% CI: 0.949–1.000; p < 0.0001), with a sensitivity of 91.67% (95% CI: 80.14–97.42) and a specificity of 97.5% (95% CI: 87.12–99.87) for predicting HRS diagnosis. Compared to cystatin C, ZO-1 exhibited a higher AUC, suggesting a better diagnostic potential for HRS in DCAC patients.
Area under the curve, sensitivity, specificity, and likelihood ratio of ZO-1 and cystatin C
| Parameter | Cut off value | AUC(95% confidence interval) | Sensitivity(95% confidence interval) | Specificity(95% confidence interval) | p-value |
|---|---|---|---|---|---|
| ZO-1 | > 3.412 ng/mL | 0.998 (0.995–1.000) | 97.22% (87.12–99.87) | 97.50% (87.12–99.87) | < 0.0001 |
| Cystatin C | > 1.958 mg/L | 0.978 (0.949–1.000) | 91.67% (80.14–97.42) | 97.50% (87.12–99.87) | < 0.0001 |
AUC: area under the curve; ZO-1: zonula occludens-1
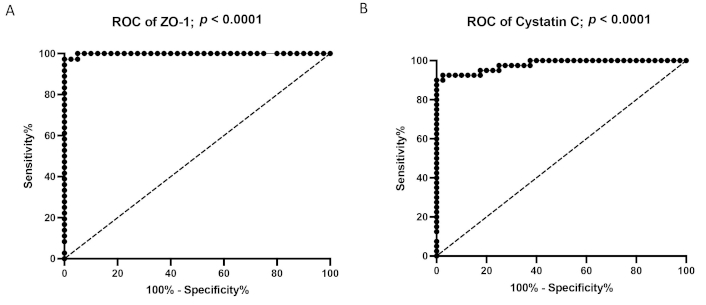
Receiver operator characteristics (ROC) curve analysis of ZO-1 (A) and Cystatin C (B) in HRS patients. ZO-1: zonula occludens-1
In this study, HRS patients exhibited clinical features of acute decompensation and impaired hepatic function, as indicated by elevated MELD and Child-Pugh scores, ascites, PHT, and HE. Laboratory findings included increased PT, INR, elevated liver enzymes, and hyperbilirubinemia were consistent with advanced cirrhosis. The prognostic impact of renal dysfunction in DCAC was reflected by elevated MELD-Na, increased creatinine, hyponatremia, and hypoalbuminemia. A recent study also showed that serum albumin, bilirubin, creatinine, and MELD score correlated with poor prognosis in decompensated cirrhotic patients with HRS [6, 13]. In DCAC-HRS patients, serum potassium and chloride levels did not differ significantly compared to control subjects. Hyponatremia is the common biochemical presentation of patients suffering from cirrhosis and HRS, resulting from systemic and splanchnic vasodilation [21]. Given that sodium contributes to MELD-Na scoring, it remains a strong predictor of survival in LT candidates [22], reinforcing its clinical relevance. Moreover, patients with severe cirrhosis are at increased risk for portal vein thrombosis, observed in 10–25% of LT patients [8] and associated with disease severity. While PT reflects only procoagulant activity and is not a reliable marker for bleeding risk, it remains useful as a prognostic indicator in liver disease [23]. As expected, PT and INR were elevated in our study due to impaired liver function.
Serum creatinine is primarily eliminated through glomerular filtration and minimally reabsorbed by the renal tubule. Its levels are not affected by urine volume, making it a conventional marker for GFR. In this study, serum creatinine levels (> 2.5 mg/dL) were significantly elevated in HRS patients compared to controls. However, Francoz et al. [10] reported that creatinine and eGFR often overestimate true GFR in cirrhotic patients. However, serum creatinine is considered an inaccurate marker for predicting renal function in cirrhosis due to the incidence of sarcopenia, endogenous synthesis, and metabolism in advanced cirrhosis [10, 13].
Cystatin C has emerged as a more accurate biomarker for assessing renal function and predicting mortality in decompensated cirrhotic patients [24]. Moreover, it was recently identified that cystatin C was more closely associated with measured GFR to predict renal insufficiency and survival than creatinine [13]. Consistent with our findings, previous studies have shown that cystatin C, but not creatinine, independently predicts mortality and HRS development in DCAC patients [14, 25]. Kim et al. [26] further demonstrated that cystatin C can predict disease progression in HRS patients, even when creatinine remains within normal levels, and Gerbes et al. [27] identified it as an early marker of moderate renal impairment in cirrhosis. Nevertheless, a lack of reference methods for cystatin C dosage and genetic variability of its synthesis or metabolism has been reported [10]. Nevertheless, several cohort studies support cystatin C as a reliable predictor of HRS in cirrhosis [12, 28]. Further investigation into additional renal biomarkers is needed to improve the assessment of renal dysfunction in DCAC patients with HRS.
TJ play a critical role in maintaining renal tubular integrity and normal kidney function. Tubular epithelial cell injury is one of the important mediators of AKI, disrupts TJ protein expression, increasing paracellular permeability [19]. ZO-1, a major TJ protein, is highly expressed in the distal nephron than in the proximal nephron [17]. Eadon et al. [19] reported that endotoxin exposure in mice led to tubular injury and significantly reduced renal ZO-1 expression. Similarly, Xiong et al. [29] demonstrated that in an ischemia-reperfusion (I-R) model of AKI, decreased ZO-1 expression was associated with deranged kidney function due to increased oxidative stress and inflammation [29]. This study found elevated serum ZO-1 levels in DCAC-HRS patients compared to control subjects. Elevated ZO-1 levels correlated positively with serum cystatin C, a classical marker of AKI with decreased GFR. ZO-1 was also correlated with MELD-Na in cirrhotic patients with HRS. These findings are consistent with our previous research showing increased ZO-1 levels in cirrhosis and HCC, where ZO-1 was also associated with inflammation and disease prognosis [30, 31]. Notably, ZO-1 expression was reduced in HCC liver compared to control liver and was negatively correlated with inflammatory mediators [31]. Fu et al. [32] further demonstrated that disruption of TJs due to glomerular endothelial cell injury increases permeability, promotes inflammatory cell infiltration, podocyte damage, albuminuria, and accelerates kidney disease progression. Given that ZO-1 protein is expressed in both endothelial and epithelial cells across various organs, it is plausible that renal injury leads to the release of ZO-1 into the circulation, potentially explaining the elevated serum ZO-1 levels observed in DCAC patients with HRS. Study limitations include the small sample size and the lack of data on alcohol consumption patterns or alcohol use disorder. Additionally, we did not include a separate cirrhotic control group to compare ZO-1 and cystatin C levels with those in patients with DCAC.
In conclusion, we demonstrated for the first time that elevated systemic ZO-1 levels are positively correlated with serum cystatin C and disease severity in cirrhotic patients with HRS. Moreover, ROC curve analysis revealed that ZO-1 exhibits better diagnostic performance compared to cystatin C, suggesting its potential as a novel biomarker in DCAC patients with HRS. However, these findings require further validation in larger cohorts of DCAC-HRS patients.
AKI: acute kidney injury
ALP: alkaline phosphatase
ALT: alanine aminotransferase
AST: aspartate aminotransferase
ATN: acute tubular necrosis
AUC: area under the curve
DC: decompensated cirrhosis
DCAC: decompensated alcoholic cirrhosis
eGFR: estimated glomerular filtration rate
HCC: hepatocellular carcinoma
HE: hepatic encephalopathy
HRS: hepatorenal syndrome
INR: international normalized ratio
LT: liver transplantation
MELD: model for end-stage liver disease
PHT: portal hypertension
PT: prothrombin time
ROC: receiver operating characteristic
SBP: systemic bacterial peritonitis
TJs: tight junctions
ZO: zonula occludens
γGT: gamma-glutamyl transferase
BV: Conceptualization, Resources, Supervision, Formal analysis, Validation, Writing—original draft, Writing—review & editing. RK: Methodology, Data curation, Formal analysis. MW: Investigation, Supervision. All authors read and approved the final manuscript.
The authors declare that there are no conflicts of interest.
This study was reviewed and approved by the JIPMER scientific advisory committee and Institute Ethics Committee for human studies [JIP/IEC/2019/499].
All patients were provided with informed written consent regarding the data collection and scientific publication.
Not applicable.
The raw data underlying this article will be shared on reasonable request to the corresponding author.
This work was supported by the JIPMER intramural research grant [Phase-I/2020-2021/MSc/23]. The funders had no role in study design, data collection and analysis, decision to publish, or preparation of the manuscript.
© The Author(s) 2025.
Open Exploration maintains a neutral stance on jurisdictional claims in published institutional affiliations and maps. All opinions expressed in this article are the personal views of the author(s) and do not represent the stance of the editorial team or the publisher.
Copyright: © The Author(s) 2025. This is an Open Access article licensed under a Creative Commons Attribution 4.0 International License (https://creativecommons.org/licenses/by/4.0/), which permits unrestricted use, sharing, adaptation, distribution and reproduction in any medium or format, for any purpose, even commercially, as long as you give appropriate credit to the original author(s) and the source, provide a link to the Creative Commons license, and indicate if changes were made.

View: 3551
Download: 34
Times Cited: 0
Guillermo Alejandro Costaguta, Fernando Álvarez
Andrew Johnson, Shahid Habib
Thierry Thevenot ... Hilary M. DuBrock
Paul Carrier ... Laure Elkrief
Sangeetha P. Kademani ... Prabhudas Nelaturi
