Original Article


Affiliation:
1Department of Electronics and Telecommunication Engineering, Jadavpur University, Kolkata 700032, West Bengal, India
Email: sukantbehera10@gmail.com; sukantb.etce.rs@jadavpuruniversity.in
ORCID: https://orcid.org/0009-0005-2481-4433


 ,
,
Affiliation:
1Department of Electronics and Telecommunication Engineering, Jadavpur University, Kolkata 700032, West Bengal, India
Affiliation:
2B M Birla Heart Research Centre, Kolkata 700027, West Bengal, India
Explor Cardiol. 2026;4:1012121 DOI: https://doi.org/10.37349/ec.2026.1012121
Received: April 19, 2026 Accepted: July 13, 2026 Published: September 10, 2026
Academic Editor: Alexandre Abizaid, Institute Dante Pazzanese de Cardiologia, Brazil; Eugenio Picano, Italian National Research Council, Italy
Aim: Valvular heart disease (VHD) is an important factor in cardiovascular mortality. While early diagnosis is essential, existing methods often lack accuracy, leading to misdiagnosis. This study explores the use of deep learning (DL) for multi-class classification of VHD using phonocardiograph (PCG) signals.
Methods: The dataset includes normal PCG heart signals and nine VHD classes such as severe and mild aortic stenosis, mild and moderate mitral stenosis, mild, moderate, and severe mitral regurgitation, and moderate and severe tricuspid regurgitation. A novel convolutional neural network (CNN) is developed to classify these ten classes, demonstrating high accuracy even in noisy data acquisition. Unlike traditional machine learning, which relies on handcrafted features such as spectral, wavelet, and mel-frequency cepstral coefficients, the CNN model automatically learns patterns from raw signals, thereby reducing the need for manual feature engineering. The model is further validated using real-time PCG data from heart clinics diagnosed by heart specialists.
Results: It achieves excellent performance with 99.81% accuracy, 99.84% precision, 99.82% recall, 99.85% F1-score, and an area under the curve of the receiver operating characteristic of 1.0.
Conclusions: This DL model eliminates segmentation and manual pre-processing, enabling early, accurate VHD detection while outperforming existing methods and supporting clinical decisions and patient care.
Valvular heart disease (VHD) is one of the major cardiovascular disorders contributing significantly to global morbidity and mortality. More than 100 million people are affected by VHD [1, 2]. The disease occurs due to abnormalities in the aortic, mitral, tricuspid, or pulmonary valves, leading to stenosis or regurgitation that restricts normal blood flow and impairs cardiac functions [3]. Degenerative valve calcification associated with aging is a major cause of VHD in developed countries [4, 5], whereas rheumatic heart disease caused by streptococcal infection remains prevalent in developing nations [6–8]. Untreated VHD may result in arrhythmias, thromboembolic events, heart failure, and sudden cardiac death [9, 10]. Therefore, early and accurate diagnosis is essential for effective clinical management. Echocardiography, cardiac magnetic resonance imaging, and computed tomography are considered gold-standard techniques for VHD diagnosis [11, 12]. However, these imaging modalities are expensive, require specialised infrastructure, and depend on expert clinicians, limiting their availability in rural and resource-constrained health care settings. Electronic stethoscopes enable non-invasive acquisition of phonocardiograph (PCG) signals and provide an alternative approach for cardiac assessment [13, 14]. Nevertheless, conventional auscultation remains highly dependent on physician expertise and subjective interpretation. Consequently, automated computer-aided analysis of PCG signals has gained increasing attention for intelligent cardiac screening and early disease detection [15]. Despite much progress, most conventional approaches still rely on segmented features and shallow classifiers that often prove insufficient in complex cardiac acoustic environments. DL methods have therefore been explored to automatically extract hierarchical representations from PCG signals [16–19]. Traditional heart sound classification methods mainly rely on hand-crafted feature extraction techniques such as mel-frequency cepstral coefficients (MFCCs), wavelet features, and time-frequency descriptors combined with machine learning (ML) classifiers [20–22]. Although these methods have shown promising results, hand-crafted features require extensive domain knowledge, manual intervention, and careful feature selection. Furthermore, hand-crafted representations may fail to preserve subtle murmur characteristics and complex temporal variations in PCG signals. Recent advances in DL, particularly convolutional neural networks (CNNs), have enabled automatic learning of discriminative features directly from raw biomedical signals without explicit feature engineering [23–26].
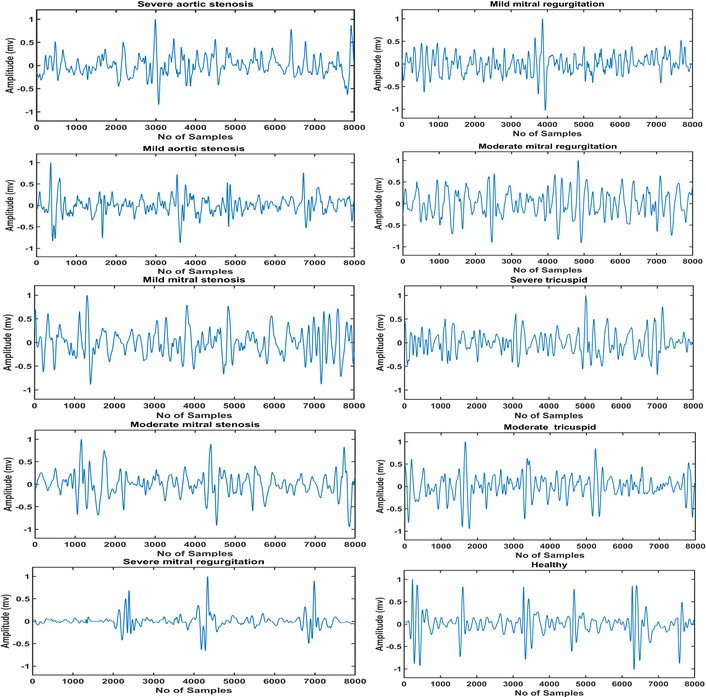
The current study uses heart sounds from electronic stethoscopes to automatically classify VHD using a deep CNN. This work analyses 10,366 heart sounds across ten classes, one normal and nine VHD types of varying severity, offering greater data diversity, complexity, and clinical applicability than previous research, thus enhancing the robustness and generalizability of VHD classification models. Figure 1 shows examples of PCG signals from 10 classes: severe aortic stenosis (AS), mild AS, mild mitral stenosis (MS), moderate MS, severe mitral regurgitation (MR), mild MR, moderate MR, severe tricuspid regurgitation (TR), moderate TR, and healthy.
The majority of research in the literature sought to identify whether VHD was present or not. In [16], the author used a DNN-based auto-encoder to classify heart conditions. The proposed method attained an accuracy of 100.0% on a dataset consisting of 449 heart sound recordings spanning five classes and 99.80% on another dataset consisting of 409 recordings classified into two classes. In [17], the author demonstrated a technique for classifying cardiac sounds using convolutional recurrent neural networks (CRNNs) and the mean frequency cepstral coefficients. When it came to classifying cardiac sounds into normal and pathological categories, they achieved 98.34% accuracy. In [18], the author proposed a CNN architecture for the classification of cardiac sounds. This proposed approach achieved 85.65% classification accuracy for normal versus pathological classes. In [19], the author developed a CNN-based heart sound classification model. They achieved an accuracy of 89.22% in the normal versus abnormal groups. In [20], the author developed a DL technique that used data augmentation to classify heart and lung sounds with a 97.00% accuracy rate. In [21], the authors extracted frequency and statistical information from cardiac sounds and used XGBoost to achieve 92.85% classification accuracy. In [22], the authors created an algorithm for classifying PCG signals using an artificial neural network and the MFCCs. For the classification of abnormal cardiac sounds, they applied the method in the time, frequency, and combined time-frequency domains and obtained accuracy rates of 90.00%, 83.33%, and 93.33%, respectively. In [23], the authors developed a DL technique called Deep Wave Net that achieved 97.00% accuracy in classifying heart sounds. In [24], the authors used backpropagation neural networks and one-dimensional CNNs to classify heart sounds, achieving a 99.01% accuracy rate. The classifier was based on a 1D binary pattern and neighbor component analysis (NCA). In [25], the authors employed recurrent and CNN to classify cardiac sounds into classes corresponding to MR, AS, MS, and mitral valve prolapse, with a 99.32% accuracy rate. In [26], the authors employed DSTP and DWT for feature extraction and INCA for feature selection, followed by an SVM for classification, and achieved an accuracy of 99.58%.
An automated cardiac analysis method is utilized to segment cardiac signals into subsequent cardiac cycles, which are then divided into two subcomponents (S1 and S2). In most circumstances, cardiac cycles are highly incorrect and difficult to employ in the diagnosis of cardiac illness [27, 28]. To address this issue, categorization mainly relies on features rather than divided cardiac subcomponents. As a result, crucial feature selection is critical to classification success, as each disease has its unique set of hand-developed features.
Additionally, some traits and characteristics of several diseases are identical, which may impact how well a diagnosis is made. Thus, high sample rates and complex characteristics are necessary. These complicated features are combined to generate a feature vector. Then, a classifier processes feature vectors of PCG signals to compute and make a diagnosis [29]. The classification approach can either be supervised or unsupervised.
Furthermore, particularly in the medical industry, DL plays a very essential role in the automated analysis of numerous disorders. In existing literature, handcrafted features such as MFCC, Centroid, Energy Entropy, and so on are used. Furthermore, these derived features are extremely limited and cannot capture the complexity of the original signal. Handcrafted features are frequently not robust, requiring subject knowledge and manual intervention. The feature engineering is removed in the suggested CNN model, making it automatic [30, 31]. As a result, there is a need for deep features that may be used for improved classification between types of diseases.
In the majority of the literature currently in publication, ML is used [32–35] to detect whether cardiac sounds are normal or abnormal. The proposed study classifies abnormal heart sounds into several cardiac diseases, including severe AS, mild AS, mild MS, moderate MS, severe MR, mild MR, moderate MR, severe TR, and moderate TR. The goal of this work is to use a 5-layer CNN to address the problem of cardiac signal misclassification between major heart disorders and to develop an artificial intelligence-based model to detect the severity of VHDs using DL. Heart sound classification has traditionally utilized segmentation, which identifies S1, S2, murmurs, and feature engineering, which includes extracting time-domain, frequency-domain, or time-frequency characteristics. However, by immediately learning patterns from raw signals, recent DL techniques [24–26] have lessened the necessity of these human procedures. The CNN models used in this work performed effectively in categorizing heart sounds without requiring feature engineering and heart sound signal segmentation.
The contribution of this article is summarized as follows.
The primary contribution of this work presented here is a fully automatic multi-type VHD diagnosis system using a proposed 5-layer CNN architecture and PCG data.
The approach was evaluated against other previous studies [16–26] with varied numbers of disease types and feature extraction methods applied to sets of available online PCG datasets. Results show superior accuracy to that of the other studies.
This CNN-based model in our work has improved detection robustness and operates even in real-time when collecting PCG data from a heart specialist diagnosis centre by using an electronic device in noisy situations, as an electronic stethoscope contains background noise.
Thus, our designed CNN model results in a low error rate and improved accuracy of (99.81%) for multi-classification of heart disorders, generating significant contributions.
The rest of this article is organized as follows. Section II explores the materials and methods. Section III shows the experimental results. Section IV discusses the experimental results.
A publicly available PCG database [26] was used in this investigation to identify VHDs. PCG signals have been gathered from the clinical environment. The dataset included 10,366 heart sounds from 659 participants that were categorized into one healthy class and nine VHD groups. Every sound was recorded at an interval of 2 seconds with an 8 kHz sampling frequency. Details about the dataset were given in Table 1. Additionally, in order to validate the model, we collected data from numerous heart patients from a heart clinic connected to a qualified doctor using the heart sound collection device [36] built in our laboratory. Patients were recruited from the B M Birla Heart Research Centre in Kolkata, India, under the supervision of certified cardiologists. Jadavpur University Institutional Ethics Committee approved this research. The diagnosis and severity grading of VHD were confirmed using echocardiography. We are not publicizing the patients’ identities, and there is no conflict of interest.
Number of subjects and sounds of data set of different disease classes.
| No. | Class | Number of subjects | No. of sounds |
|---|---|---|---|
| 1 | Severe aortic stenosis | 23 | 959 |
| 2 | Mild aortic stenosis | 54 | 738 |
| 3 | Mild mitral stenosis | 45 | 656 |
| 4 | Moderate mitral stenosis | 69 | 1,035 |
| 5 | Severe mitral regurgitation | 90 | 1,338 |
| 6 | Mild mitral regurgitation | 72 | 1,077 |
| 7 | Moderate mitral regurgitation | 54 | 792 |
| 8 | Severe tricuspid | 72 | 1,077 |
| 9 | Moderate tricuspid | 72 | 1,080 |
| 10 | Healthy | 108 | 1,614 |
| Total | 659 | 10,366 | |
The goal of the proposed effort is to develop a DL classification framework that uses PCG-recorded heart signals to independently determine the severity of VHD. The diagram in Figure 2 illustrates the framework of the suggested proposal. In order to segregate PCG signals for training and testing, the proposed method involves signal processing with a CNN architecture and then determining prominent and discriminatory properties. The suggested CNN model was employed for multi-classification to diagnose the severity of VHD in real time using PCG data.
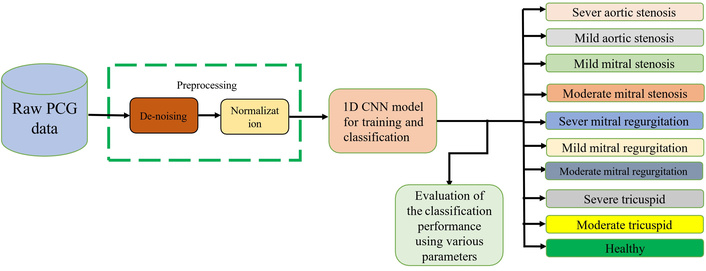
Block diagram model of the proposed work. PCG: phonocardiograph; CNN: convolutional neural network.
Figure 2 displays the flowchart for the suggested cardiac classification model. There are three components to the proposition: (a) Get the PCG signals from individuals or a dataset. (b) Signal processing comprises pre-processing, such as signal filtering and amplitude normalization of a cardiac signal to reduce artefacts like noise that are captured with it. (c) Proposed CNN design for multi-classification of cardiac disorders in diagnosing severe cardiac issues in individuals related to VHDs.
The PCG signal is vulnerable to a variety of interferences, including typical Gaussian white noise and comparatively loud background disturbances in hospitals during the collection process. Despite the fact that it appears that the publicly available heart sound files have previously been denoised, the processing techniques employed are somewhat primitive. Because some data still have excessive noise, it is clear that the noise reduction result does not fulfil the criterion. There is noise surrounding the effective signal, which will lead to inaccurate categorization outcomes. Therefore, before performing any additional processing, it is imperative to recover the effective signal and eliminate as much noise as possible. Many techniques for reducing noise in cardiac sound signals are currently in widespread use [35]. A wavelet function selection and the number of decomposition layers are two of the many unknown parameters of the wavelet transform. It has ultimately been established after numerous studies that there are 10 decomposition levels and that the wavelet function is the db8 wavelet function with soft thresholding [37, 38]. The normalizing procedure has to be used to decrease the variability in data points in order to guarantee a better representation of signals. Every signal in z-score normalization is set to have a mean (μ) of 0 and a standard deviation (σ) of 1. This stops higher trends from overlapping with lower trends and minimizes any large dynamic ranges across the signals [35] as follows.
To enhance the effectiveness of DL models, it is always advised in the literature to make sure that a normalized collection of signals is present before beginning any training or classification process [37].
In this study, we present a 1D CNN model with two parts: a complete CNN and densely connected layers, as shown in Figure 3. A CNN is a kind of neural network design that consists of several convolutional layers accompanied by a small number of dense layers [39]. In recent years, CNNs have demonstrated their ability to analyse audio and video in addition to images, drawing inspiration from the structures found in the visual cortex of the human brain. CNN transfers data from one layer to another, processing more abstract information in the deeper layers after extracting low-level features in the first layer. 1D convolutions are a set of dot products performed over a predetermined time period extracted from a piece of data. Because CNNs are so good at automatically detecting relevant characteristics in objects, they have become one of the most widely utilized artificial intelligence techniques [40]. The basic structure of a CNN is made up of several layers. Every layer in the network is in charge of a particular function. With convolutions, a series of filters work in tandem to produce outputs and display these as activations. Using several convolutions, these activations are enlarged to provide an attribute map or as a vector for the relevant input [41].
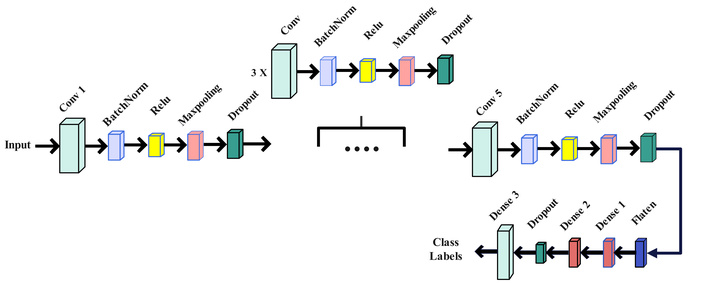
Block diagram of the proposed CNN model for VHD detection. CNN: convolutional neural network; VHD: valvular heart disease.
To develop the best CNN model for diagnosing heart illness, many topologies with three or more convolutional layers have been examined, where a variety of neurons as well as activation algorithms such as the rectified linear unit (ReLU), hyperbolic tangent (Tanh), and sigmoid (Sigm) vary for each layer. It has been found that the performance of these structures is not appreciably improved by increasing the number of neurons. On the other hand, the structure with five convolutional layers performs the best. There are 4,679,178 weights (parameters) in all CNN setups, with a different number for each layer. Table 2 provides a detailed description of the optimal CNN architecture.
Detailed overview of the proposed CNN model.
| Layers | Layer type | Layer parameters | Output shape | Total parameters |
|---|---|---|---|---|
| Input | 16000, 1 | |||
| CNN1 | 1D Convolution | Filter = 128, kernel size = 3, stride = 2, padding = valid, activation = 'ReLU' | (7999, 128) | 512 |
| Batch norm | Momentum = 0.9 | (7999, 128) | 512 | |
| 1D max pooling | Pool size = 4 | (1999, 128) | 0 | |
| Dropout | Rate = 0.3 | (1999, 128) | 0 | |
| CNN2 | 1D Convolution | Filter = 128, kernel size = 9, stride = 2, padding = valid, activation = 'ReLU' | (996, 128) | 147,584 |
| Batch norm | Momentum = 0.9 | (996, 128) | 512 | |
| 1D max pooling | Pool size = 4 | (497, 128) | 0 | |
| Dropout | Rate = 0.3 | (497, 128) | 0 | |
| CNN3 | 1D Convolution | Filter = 256, kernel size = 9, stride = 2, padding = valid, activation = 'ReLU' | (245, 256) | 295,168 |
| Batch norm | Momentum = 0.9 | (245, 256) | 1,024 | |
| 1D max pooling | Pool size = 4 | (122, 256) | 0 | |
| Dropout | Rate = 0.3 | (122, 256) | 0 | |
| CNN4 | 1D Convolution | Filter = 512, kernel size = 9, stride = 2, padding = valid, activation = 'ReLU' | (57, 512) | 1,180,160 |
| Batch norm | Momentum = 0.9 | (57, 512) | 2,048 | |
| 1D max pooling | Pool size = 4 | (28, 512) | 0 | |
| Dropout | Rate = 0.3 | (28, 512) | 0 | |
| CNN5 | 1D Convolution | Filter = 512, kernel size = 9, stride = 2, padding = valid, activation = 'ReLU' | (10, 512) | 2,359,808 |
| Batch norm | Momentum = 0.9 | ( 10, 512) | 2,048 | |
| 1D max pooling | Pool size = 4 | (5, 512) | 0 | |
| Dropout | Rate = 0.3 | ( 5, 512) | 0 | |
| Output layer | Flatten | ------------ | 2560 | 0 |
| Dense | Unit = 256, activation = 'ReLU' | 256 | 655,616 | |
| Dense | Unit = 128 activation = 'ReLU' | 128 | 32,896 | |
| Dropout | Rate = 0.5 | 128 | 0 | |
| Dense | Unit = 10, activation = 'softmax' | 10 | 1,290 | |
Total parameters: 4,679,178 (17.85 MB), Trainable parameters: 4,676,106 (17.84 MB), Non-trainable parameters: 3,072 (12.00 KB).
CNN training is a crucial phase in the ML architecture, and it has a substantial impact on the overall accuracy of the model. To optimize the training process, the recommended technique applies categorical cross-entropy loss. To address memory limitations, we split the training data into small batches. These mini-batches are then utilized to train the CNN through iterations. Each batch contains 64 signals randomly chosen from the training data (without repeat). The model undergoes 200 epochs of training. This CNN model has been trained using 10 distinct heart sound class groups. The suggested CNN architecture for the multi-classification of VHDs was trained using the hyper parameters listed in Table 3.
Hyperparameters for the proposed CNN.
| Hyper parameter | Loss | mini-batch size | Epoch | Optimizer | Padding | Learning rate |
|---|---|---|---|---|---|---|
| Value | categorical cross-entropy | 64 | 200 | adadelta | valid | 0.001 |
CNN: convolutional neural network.
Other parameters have been empirically set through a number of tests, including the filters, stride, epochs with early stopping conditions, and kernel size. The suggested model is trained with training data, and its parameters are adjusted with validation data. The final model is assessed using distinct PCG signals that are gathered from a prominent hospital. The trained deep neural network makes predictions about whether the heart sound is normal or if one of the abnormal conditions, like severe AS, mild AS, mild MS, severe MR, mild MR, moderate MR, severe TR, or moderate TR, is present. These outcomes are contrasted with ground truth values that domain experts have provided.
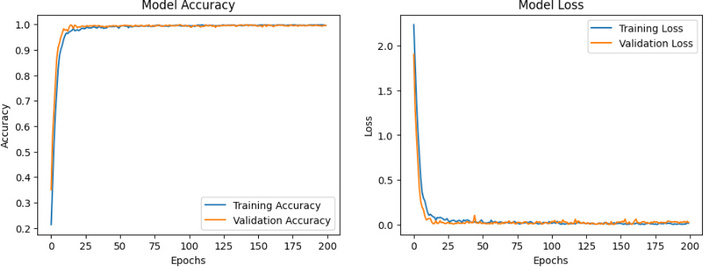
DL was utilized to create a CNN architecture for multi-classification of heart diseases, which included training and testing sets. The outcome of the PCG dataset reveals that the suggested strategy is effective. Figure 4 illustrates the accuracy and loss of the CNN model in the available dataset. The green line depicts training accuracy and loss, whereas the yellow line represents validation accuracy as well as loss. The classification performance was evaluated using the generated confusion matrix, which is depicted in Figure 5. Several performance indicators were retrieved from the confusion matrix, including accuracy, sensitivity, precision, and F1 score. Each metric has been outlined in the equations (Equations 2–5) given below [42].
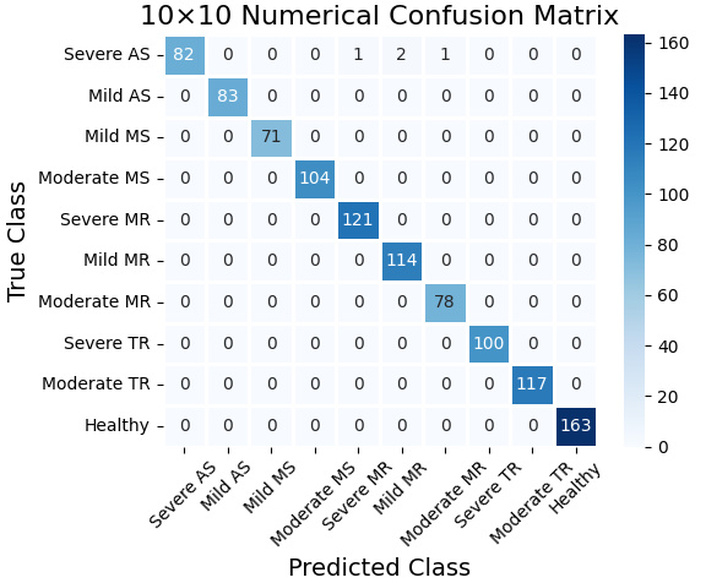
Confusion matrix. AS: aortic stenosis; MS: mitral stenosis; MR: mitral regurgitation; TR: tricuspid regurgitation.
In multiclass classification, the evaluation metrics true positive (TP), true negative (TN), false positive (FP), and false negative (FN) are defined using a one-versus-all strategy for each class. For a given class i, TP represents the number of samples correctly classified as i. TN represents the number of samples that neither belong to class i nor are predicted as class i. FP corresponds to the number of samples from other classes that are incorrectly predicted as class i. FN denotes the number of samples belongs to class i but are misclassified as other classes. These values are computed independently for each class and then used to calculate performance metrics like accuracy, precision, recall, and F1-score in multi-class classification problems.
Figure 6 shows the receiver operating characteristic (ROC) curve and AUC of the CNN model for various cardiac diseases. Cardiac classes are colour-coded and represented by solid lines in the following order: severe AS, mild AS, mild MS, moderate MS, severe MR, mild MR, moderate MR, severe TR, moderate TR, and normal. This curve represents a plot of the FP rate on the x-axis and the TP rate on the y-axis. The dashed line indicates a non-discriminatory test. The AUC of the ROC curve is a scalar value that summarizes the model’s performance. It varies from 0 to 1.
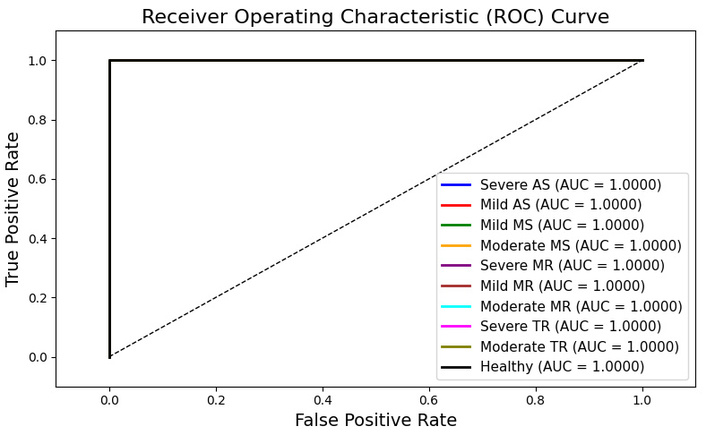
ROC curve. AS: aortic stenosis; MS: mitral stenosis; MR: mitral regurgitation; TR: tricuspid regurgitation.
AUC = 1.0 signifies a perfect model.
AUC = 0.5, this shows that the model is no better than random guessing.
AUC < 0.5, this means that the model performs worse than random guessing.
Table 4 displays the performance of the CNN architecture for multi-class VHDs for performance metrics of precision, recall, and F1-score. F1 score measures a DL model’s accuracy by calculating the harmonic mean of precision and recall, with 1 being the perfect value, as it provides zero FPs or zero FNs, i.e., perfect precision and perfect recall. Table 5 compares accuracy with earlier models for multi-classification of heart diseases. The proposed approach achieves great accuracy using the CNN model without feature engineering.
The performance metrics of the classification of VHDs using CNN network.
| Metric | Severe AS | Mild AS | Mild MS | Moderate MS | Severe MR | Mild MR | Moderate MR | Severe tricuspid | Moderate tricuspid | Healthy |
|---|---|---|---|---|---|---|---|---|---|---|
| Precision | 1 | 1 | 1 | 1 | 0.99 | 0.98 | 0.99 | 1 | 1 | 1 |
| Recall | 0.95 | 1 | 1 | 1 | 1 | 1 | 1 | 1 | 1 | 1 |
| F1-score | 0.98 | 1 | 1 | 1 | 1 | 0.99 | 0.98 | 1 | 1 | 1 |
AS: aortic stenosis; CNN: convolutional neural network; MR: mitral regurgitation; MS: mitral stenosis; VHDs: valvular heart diseases.
Method and performance comparison.
| Study | Year | Method | Sounds (n) | Classes (n) | Results (%) |
|---|---|---|---|---|---|
| [16] | 2020 | Auto-encoder Neural Networks | 449 | Normal | Acc = 100.00 |
| Noisy | |||||
| Normal | Sen = 100.00 | ||||
| Extrasystole | |||||
| Murmur | Spe = 100.00 | ||||
| Noisy murmur | |||||
| 409 | Abnormal | Acc = 99.8 | |||
| Normal | Sen = 99.65 | ||||
| Spe = 99.13 | |||||
| [17] | 2020 | MFCC features, CNN, recurrent neural networks | 3,240 | Abnormal | Acc = 98.34 |
| Spe = 98.01 | |||||
| Normal | Sen = 98.66 | ||||
| [18] | 2020 | Custom CNN architecture | 1,081 | Abnormal | Acc = 85.65 |
| Normal | Spe = 86.73 | ||||
| Sen = 84.75 | |||||
| [19] | 2019 | Custom CNN architecture | 8,272 | Abnormal | Acc = 89.22 |
| Normal | Spe = 89.94 | ||||
| Sen = 86.35 | |||||
| [20] | 2022 | Data augmentation, spectrogram, MFCC, chromagram, CNN | 656 | Normal | |
| Noisy | |||||
| Normal | |||||
| Extrasystole | Acc = 97 | ||||
| Murmur | |||||
| Noisy murmur | |||||
| Unlabeled | |||||
| [21] | 2019 | MFCC statistical and frequency features, decision tree XGBoost | 3,240 | Abnormal | Acc = 92.9 |
| Normal | Spe = 94.5 | ||||
| [22] | 2021 | Time domain, MFCC, artificial neural network, linear discriminant analysis | 3,126 | Abnormal | Acc = 93.33 |
| Normal | |||||
| [23] | 2020 | Deep WaveNet model | 1,000 | AS | |
| MR | Acc = 97.0 | ||||
| MS | Sen = 92.5 | ||||
| MVP | Spe = 98.1 | ||||
| Normal | |||||
| [24] | 2019 | Spectrogram and custom 1D CNN | 13,015 | Abnormal | Acc = 99.01 |
| Normal | Fscr = 99.10 | ||||
| [25] | 2021 | Bi-directional LSTM, CNN | 1,000 | AS | |
| MR | Acc = 99.32 | ||||
| MS | Sen = 98.30 | ||||
| MVP | Spe = 99.5 | ||||
| Normal | |||||
| [26] | 2022 | DSTP, DWT, INCA, SVM | 10,366 | Severe aortic stenosis | |
| Mild aortic stenosis | Acc = 99.58 | ||||
| Mild mitral stenosis | Pre = 99.55 | ||||
| Moderate mitral stenosis | Rec = 99.59 | ||||
| Severe mitral regurgitation | Fscr = 99.57 | ||||
| Mild mitral regurgitation | |||||
| Moderate mitral regurgitation | |||||
| Severe tricuspid | |||||
| Moderate tricuspid | |||||
| Healthy | |||||
| Proposed method | CNN | 10,366 | Severe aortic stenosis | ||
| Mild aortic stenosis | |||||
| Mild mitral stenosis | Acc = 99.81 | ||||
| Moderate mitral stenosis | Pre = 99.84 | ||||
| Severe mitral regurgitation | Rec = 99.82 | ||||
| Mild mitral regurgitation | Fscr = 99.85 | ||||
| Moderate mitral regurgitation | |||||
| Severe tricuspid | |||||
| Moderate tricuspid | |||||
| Healthy |
Acc: accuracy; Sen: sensitivity; Spe: specificity; Pre: precision; Rec: recall; Fscr: F1 score.
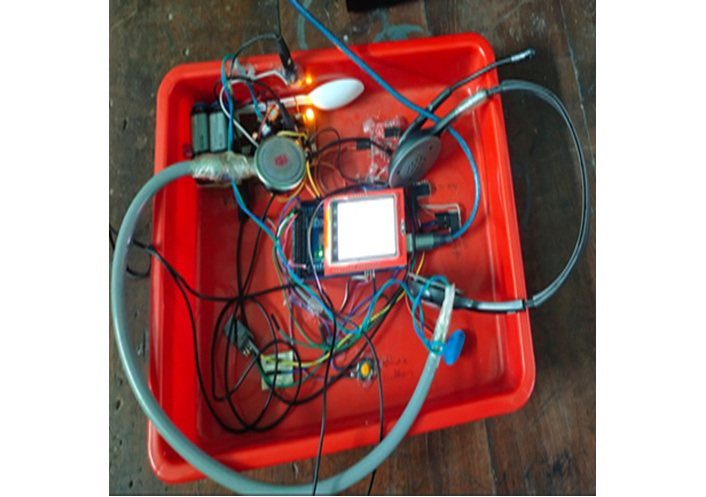
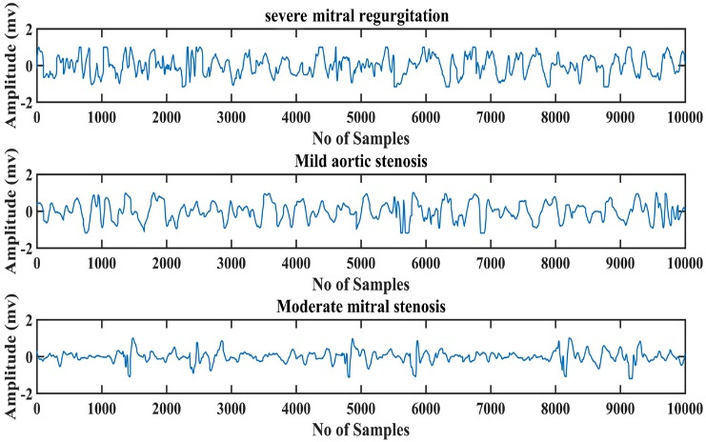
Further, we used a heart sound acquisition device made in our laboratory [36], shown in Figure 7, to gather several PCG signals with VHDs from a reputed hospital in front of a cardiac specialist to confirm the behaviour of our model through real-time testing. Signals shown in Figure 8 were recorded with a heart acquisition device made in our laboratory from a renowned cardiology hospital in the presence of a doctor. The disease identified by the expert doctor and the model prediction are shown in Table 6.
Model validation using real data collection.
| Subject | M/F | Age | Disease identified by doctor | Disease identified by our model | Remarks |
|---|---|---|---|---|---|
| Patient 1 | F | 75 | Severe mitral regurgitation | Severe mitral regurgitation | 100 % accuracy |
| Patient 2 | F | 57 | Mild aortic stenosis | Mild aortic stenosis | 100% accuracy |
| Patient 3 | M | 37 | Moderate mitral stenosis | Moderate mitral stenosis | 100% accuracy |
The present study shows the efficacy of a five-layer 1D CNN for multi-class classification and severity assessment of VHDs utilizing raw PCG signals. The suggested model achieved an overall accuracy of 99.81%, with precision, recall, and F1-score above 99.8% across ten clinically significant classes, including normal heart sounds and nine subtypes of VHD with different severity. By directly processing denoised PCG signals without segmentation or handcrafted feature extraction, the model eliminates several error-prone pre-processing steps commonly found in traditional approaches.
The proposed model achieves competitive performance with most previously reported method for heart sound classification. While earlier studies primarily focused on binary classification or a limited number of disease classes, the current work successfully addresses a more clinically relevant ten-class problem involving both type and severity of VHD. Notably, compared to Barua et al. [26], who reported 99.58% accuracy using extensive feature engineering (DSTP + DWT + INCA) followed by an SVM classifier on the same dataset. Our CNN-based method achieved higher classification accuracy while substantially reducing computational complexity. The proposed method demonstrates competitive performance compared with the previous approach. The real-time PCG signals exhibited in Figure 8 were acquired by a designed device from several heart patients in the presence of an expert heart specialist and fed to the CNN model to generate detection outcomes to be matched with the doctor’s diagnosis, as shown in Table 6.
The disadvantage of this study is that validation was performed on recordings from a single clinical centre. Future studies will integrate multi-centre datasets gathered with various electronic stethoscopes and recording conditions to improve generalizability.
The key findings of this work are stated below.
A DL model that is five layers 1D CNN was proposed to classify 10 classes comprising nine VHD classes and one healthy class.
Using a deep CNN model without feature extraction and feature selection achieved over 99.81% accuracy.
The model outperformed previously reported models in the literature in terms of heart sound classification.
Validate the 1D CNN model with real-time PCG signals collected from different patients using a device designed by us and used in the laboratory in the presence of a heart specialist.
Multi-classification of VHD can be achieved using PCG signals processed by DL technology to generate alarm for mass scale. This research work illustrates the way of using CNN for this multi-disease classification. This model has attained a high accuracy of 99.81%, surpassing the previous studies. Further, the AUC of the ROC curve for each VHD is 1.00, indicating a very good classification model. In comparison to earlier work [26], the suggested method produces improved accuracy with fewer steps for VHD categorization. This technique will benefit decision-making for medical practitioners in the detection of multi-class heart diseases. This DL model has been applied to actual patients’ data suffering from VHDs, and the results matched the diagnosis by a heart specialist. This proposed CNN-based VHD classification and detection model demonstrates potential as a decision support tool for early detection and awareness of VHDs. Future studies will investigate hybrid DL frameworks merging raw PCG data with MFCC and wavelet-based scalogram features to further improve discrimination of minor valvular abnormalities. Future studies will integrate multi-centre datasets acquired using multiple electronic stethoscopes and recording conditions to improve generalizability. Also examine the model’s performance in children, pregnant women, and those with arrhythmias.
AS: aortic stenosis
AUC: area under the curve
CNNs: convolutional neural networks
DL: deep learning
FN: false negative
FP: false positive
MFCCs: mel-frequency cepstral coefficients
ML: machine learning
MR: mitral regurgitation
MS: mitral stenosis
NCA: neighbor component analysis
PCG: phonocardiograph
ReLU: rectified linear unit
ROC: receiver operating characteristic
Tanh: hyperbolic tangent
TN: true negative
TP: true positive
TR: tricuspid regurgitation
VHD: valvular heart disease
SB: Conceptualization, Methodology, Software, Data curation, Investigation, Formal analysis, Writing—original draft. ISM: Conceptualization, Supervision, Writing—review & editing. KNS: Validation, Resources, Investigation. The authors declare that this manuscript is original, has not been published previously, and is not under consideration for publication elsewhere. All authors have read and approved the final manuscript and agree to its submission.
The authors declare that they don’t have conflict of interest that could have appeared to influence the work reported in this paper.
This study was performed in line with the principles of the Declaration of Helsinki. Approval was granted by the institutional Ethics Committee (IEC) of Jadavpur University (Approval No. IEC/73/C/26).
Received the written consent was obtained from the patients whose PCG signals were collected for validation of the model, and such consent can be provided on request.
Not applicable.
Datasets are available on request.
Not applicable.
© The Author(s) 2026.
Open Exploration maintains a neutral stance on jurisdictional claims in published institutional affiliations and maps. All opinions expressed in this article are the personal views of the author(s) and do not represent the stance of the editorial team or the publisher.
Copyright: © The Author(s) 2026. This is an Open Access article licensed under a Creative Commons Attribution 4.0 International License (https://creativecommons.org/licenses/by/4.0/), which permits unrestricted use, sharing, adaptation, distribution and reproduction in any medium or format, for any purpose, even commercially, as long as you give appropriate credit to the original author(s) and the source, provide a link to the Creative Commons license, and indicate if changes were made.



View: 392
Download: 9
Times Cited: 0