Original Article


Affiliation:
1Laboratory of Applied Exercise Physiology, Department of Sports Medicine and Science in Graduate School, Konkuk University, Seoul 05029, Republic of Korea
2Department of Sports Medicine and Science, Graduate School, Konkuk University, Seoul 05029, Republic of Korea
†These authors contributed equally to this work.
ORCID: https://orcid.org/0009-0005-9281-4988

 ,
Affiliation:
1Laboratory of Applied Exercise Physiology, Department of Sports Medicine and Science in Graduate School, Konkuk University, Seoul 05029, Republic of Korea
2Department of Sports Medicine and Science, Graduate School, Konkuk University, Seoul 05029, Republic of Korea
3Physical Activity and Performance Institute (PAPI), Konkuk University, Seoul 05029, Republic of Korea
†These authors contributed equally to this work.
ORCID: https://orcid.org/0009-0004-8435-3926
,
Affiliation:
2Department of Sports Medicine and Science, Graduate School, Konkuk University, Seoul 05029, Republic of Korea
4Department of Orthopaedic Surgery, Konkuk University Medical Center, 120-1, Neungdong-ro, Gwangjin-gu, Seoul 05030, Republic of Korea
ORCID: https://orcid.org/0000-0003-4157-3414
,
Affiliation:
2Department of Sports Medicine and Science, Graduate School, Konkuk University, Seoul 05029, Republic of Korea
4Department of Orthopaedic Surgery, Konkuk University Medical Center, 120-1, Neungdong-ro, Gwangjin-gu, Seoul 05030, Republic of Korea
ORCID: https://orcid.org/0000-0002-7929-478X
,
Affiliation:
1Laboratory of Applied Exercise Physiology, Department of Sports Medicine and Science in Graduate School, Konkuk University, Seoul 05029, Republic of Korea
2Department of Sports Medicine and Science, Graduate School, Konkuk University, Seoul 05029, Republic of Korea
3Physical Activity and Performance Institute (PAPI), Konkuk University, Seoul 05029, Republic of Korea
ORCID: https://orcid.org/0000-0001-5379-5247
,
Affiliation:
1Laboratory of Applied Exercise Physiology, Department of Sports Medicine and Science in Graduate School, Konkuk University, Seoul 05029, Republic of Korea
2Department of Sports Medicine and Science, Graduate School, Konkuk University, Seoul 05029, Republic of Korea
ORCID: https://orcid.org/0009-0005-4021-1237
,
Affiliation:
1Laboratory of Applied Exercise Physiology, Department of Sports Medicine and Science in Graduate School, Konkuk University, Seoul 05029, Republic of Korea
2Department of Sports Medicine and Science, Graduate School, Konkuk University, Seoul 05029, Republic of Korea
ORCID: https://orcid.org/0009-0005-5203-0126
,
Affiliation:
2Department of Sports Medicine and Science, Graduate School, Konkuk University, Seoul 05029, Republic of Korea
3Physical Activity and Performance Institute (PAPI), Konkuk University, Seoul 05029, Republic of Korea
ORCID: https://orcid.org/0000-0001-5976-277X
,
Affiliation:
2Department of Sports Medicine and Science, Graduate School, Konkuk University, Seoul 05029, Republic of Korea
3Physical Activity and Performance Institute (PAPI), Konkuk University, Seoul 05029, Republic of Korea
ORCID: https://orcid.org/0000-0003-2344-6235
,
Affiliation:
2Department of Sports Medicine and Science, Graduate School, Konkuk University, Seoul 05029, Republic of Korea
3Physical Activity and Performance Institute (PAPI), Konkuk University, Seoul 05029, Republic of Korea
5Department of Physical Education, Konkuk University, Seoul 05029, Republic of Korea
ORCID: https://orcid.org/0000-0003-3222-1783
,
Affiliation:
1Laboratory of Applied Exercise Physiology, Department of Sports Medicine and Science in Graduate School, Konkuk University, Seoul 05029, Republic of Korea
2Department of Sports Medicine and Science, Graduate School, Konkuk University, Seoul 05029, Republic of Korea
3Physical Activity and Performance Institute (PAPI), Konkuk University, Seoul 05029, Republic of Korea
Email: parkhy1980@konkuk.ac.kr
ORCID: https://orcid.org/0000-0002-9901-7624

Explor Med. 2026;7:1001438 DOI: https://doi.org/10.37349/emed.2026.1001438
Received: July 06, 2026 Accepted: September 15, 2026 Published: November 12, 2026
Academic Editor: Nikolaos Papanas, Democritus University of Thrace, Greece
Aim: The present study investigated clinical and functional changes after a 12-week rehabilitation exercise program in obese and non-obese patients with knee osteoarthritis (KOA).
Methods: This retrospective, single-cohort pre–post complete-case analysis without a non-exercise control group included 60 patients with radiographically confirmed KOA (Kellgren-Lawrence grades 1–4). Participants were classified into a non-obese group [body mass index (BMI) < 25 kg/m2, n = 30] and an obese group (BMI ≥ 25 kg/m2, n = 30) according to the Asia-Pacific obesity criteria of the World Health Organization (WHO). All participants completed a standardized 12-week rehabilitation exercise program consisting of flexibility, muscle strengthening, and balance exercises, performed for 60 min per session, three times per week. Clinical and functional outcomes were assessed, including body composition, pain and osteoarthritis index scores, thigh circumference, gluteus medius and isokinetic muscle strength, and functional ability.
Results: A significant group × time interaction was observed for body weight (p = 0.006), whereas no significant interactions were observed for BMI or the other clinical and functional outcomes. Significant main effects of time were observed for BMI, body fat mass (BFM), percent body fat (%BF), pain and osteoarthritis index scores, thigh circumference, gluteus medius and isokinetic muscle strength, and functional ability (all p < 0.05), whereas no significant time effect was observed for skeletal muscle mass.
Conclusions: The 12-week rehabilitation exercise program was associated with improvements in clinical and functional outcomes in both obese and non-obese patients with KOA, with a significant group × time interaction observed only for body weight. Trial registration: KCT0012016; https://cris.nih.go.kr/cris/index/index.do.
Knee osteoarthritis (KOA) is one of the most prevalent chronic musculoskeletal disorders and is characterized by progressive structural alterations, including degeneration of the articular cartilage, joint space narrowing, and osteophyte formation, which subsequently lead to pain, impaired gait, muscle weakness, and functional limitations [1, 2]. The development and progression of KOA are considered multifactorial processes influenced by aging, mechanical loading, muscle dysfunction, lower extremity malalignment, and previous joint injury [3, 4].
The prevalence of KOA has been reported to be higher in Asian populations than in European and North American populations, indicating a substantial disease burden among middle-aged and older adults [5].
Among the modifiable risk factors associated with KOA, obesity has been consistently identified as a major contributor to the onset and progression of the disease [3, 4]. Obesity is associated not only with an increased mechanical load on the knee joint, but also with impaired physical function, increased pain, and reduced gait performance [6, 7]. Obesity has been reported to contribute to cartilage metabolic dysregulation and synovial inflammation through increased secretion of adipokines, including leptin, tumor necrosis factor-alpha, and interleukin-6, from adipose tissue [8, 9]. Therefore, obesity may contribute to the progression of the disease and functional deterioration in patients with KOA through both excessive mechanical stress and activation of inflammatory pathways.
Furthermore, KOA accelerates declines in knee joint function due to decreased physical activity and degenerative joint changes, which subsequently contribute to increased pain and decreased capacity for activities of daily living [10, 11]. In cases where aging and obesity coexist, sarcopenic obesity can develop, which is associated with decreased lower extremity muscle strength and impaired joint stability, which could potentially exacerbate knee joint dysfunction [12, 13].
In this context, exercise has been recommended as a non-pharmacological cornerstone intervention to reduce pain, improve muscle strength, and restore physical function in patients with KOA [14, 15]. Structured rehabilitation exercise programs lasting 8 to 12 weeks have been shown to be effective components of conservative treatment strategies for patients with KOA [16]. Although obesity is well established as a risk factor for the development and progression of KOA, its potential role as a modifier of rehabilitation response remains less clear. Furthermore, previous studies have suggested that responses to rehabilitation exercise programs may differ between obese and non-obese patients with KOA depending on the characteristics of the exercise intervention [16, 17]. However, it remains unclear whether obese and non-obese patients with KOA classified using the World Health Organization (WHO) Asia-Pacific body mass index (BMI) threshold exhibit different pre–post clinical and functional changes after participation in the same standardized rehabilitation exercise program.
Previous studies investigating exercise intervention responses have commonly applied heterogeneous BMI criteria or the Western-based WHO global BMI classification system. However, the Asia-Pacific BMI criteria proposed by the WHO reflect body fat distribution and metabolic characteristics of Asian populations and may provide a more appropriate framework for interpreting obesity-related clinical phenotypes in patients with KOA [18–20]. However, this classification represents BMI-defined groups and should not be interpreted as a direct measure of adiposity phenotypes.
Although KOA is generally assessed using the Kellgren-Lawrence (K-L) grading system based on radiographic findings, radiographic severity does not always correspond with pain intensity or functional limitation [21]. Previous studies have repeatedly reported structure–symptom discordance between radiographic structural changes and clinical manifestations [22–24], highlighting the need for multidimensional assessment approaches that incorporate functional and neuromuscular indicators. Therefore, a comprehensive evaluation using function-oriented parameters, including thigh circumference, gluteus medius strength, isokinetic muscle function, and functional performance, has been increasingly emphasized [25, 26].
Therefore, the present study aimed to investigate clinical and functional changes associated with participation in a 12-week standardized rehabilitation exercise program in patients with K-L grade 1–4 KOA, comparing the results between obese and non-obese groups classified according to the WHO Asia-Pacific BMI criteria (BMI ≥ 25 kg/m2 vs. < 25 kg/m2). We hypothesized that pre–post changes in clinical and functional outcomes would differ between obese and non-obese patients with KOA, as reflected by significant group × time interactions.
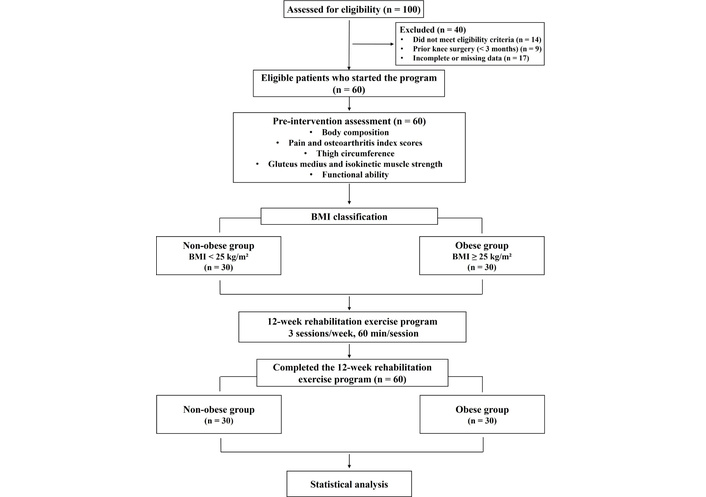
This retrospective study included 60 adults aged 50 to 69 years who were diagnosed with KOA based on radiographic findings. Clinical and assessment data were retrospectively obtained from the hospital electronic medical record (EMR) system for patients who visited the outpatient clinic between January 2023 and December 2024. A total of 100 patient records were assessed for eligibility. Of these, 40 patients were excluded because they did not meet the eligibility criteria (n = 14), had undergone knee-related orthopedic surgery within the previous 3 months (n = 9), or had incomplete or missing data (n = 17). The remaining 60 eligible patients initiated the standardized 12-week rehabilitation exercise program. Participants were stratified into a non-obese group (BMI < 25 kg/m2, n = 30) and an obese group (BMI ≥ 25 kg/m2, n = 30) according to the WHO Asia-Pacific BMI criteria [18]. The physical characteristics of the participants are presented in Table 1. Demographic characteristics and radiographic severity were comparable between the groups at the beginning of the study.
Participant characteristics.
| Variables | BMI < 25 kg/m2 (n = 30) | BMI ≥ 25 kg/m2 (n = 30) | p-value |
|---|---|---|---|
| Demographics | |||
| Sex (male/female) | 5/25 | 6/24 | 0.739 |
| Age (years) | 61.80 ± 4.60 | 60.13 ± 4.98 | 0.183 |
| K-L grade | |||
| Grade 1 | 7 | 7 | 0.670 |
| Grade 2 | 10 | 6 | |
| Grade 3 | 8 | 10 | |
| Grade 4 | 5 | 7 | |
| Anthropometrics | |||
| Height (cm) | 161.00 ± 5.17 | 159.87 ± 7.47 | 0.499 |
| Weight (kg) | 59.10 ± 6.41 | 72.09 ± 7.77 | < 0.001*** |
| BMI (kg/m2) | 22.88 ± 1.91 | 28.48 ± 2.72 | < 0.001*** |
| SMM (kg) | 22.15 ± 2.74 | 23.88 ± 4.48 | 0.078 |
| BFM (kg) | 17.77 ± 3.86 | 26.34 ± 5.41 | < 0.001*** |
| %BF (%) | 29.56 ± 5.05 | 36.88 ± 6.78 | < 0.001*** |
%BF: percent body fat; BFM: body fat mass; BMI: body mass index; K-L grade: Kellgren-Lawrence grade; SMM: skeletal muscle mass. ***: Significant between groups (p < 0.001).
Participants were included if they had radiographically confirmed KOA and had completed the standardized 12-week rehabilitation exercise program. Participants were excluded if they had undergone knee-related orthopedic surgery in the previous three months, had metabolic bone disease, severe systemic disease that could preclude safe participation in the rehabilitation exercise program, or rheumatoid arthritis. For patients with bilateral KOA, the more symptomatic knee was designated as the index knee. Knee-specific measurements were obtained from the index side, and only one knee per participant was included in the analysis. A complete-case analysis was performed, and patients with missing baseline or 12-week follow-up outcome data were excluded. All 60 patients who initiated the rehabilitation exercise program completed the 12-week program, and no participants discontinued the program during the intervention period. All eligible patient records meeting the study criteria during the defined study period were consecutively included, without matching or additional sampling. The rehabilitation exercise program was provided as part of routine clinical management. The participant selection and study flow are presented in Figure 1. The study was approved by the Institutional Review Board of Konkuk University Medical Center [KUMC IRB No. 2026-01-037] on January 22, 2026, and was conducted in accordance with the ethical principles of the Declaration of Helsinki. The study was registered with the Clinical Research Information Service (CRIS), Republic of Korea (KCT0012016), as a retrospective observational study.
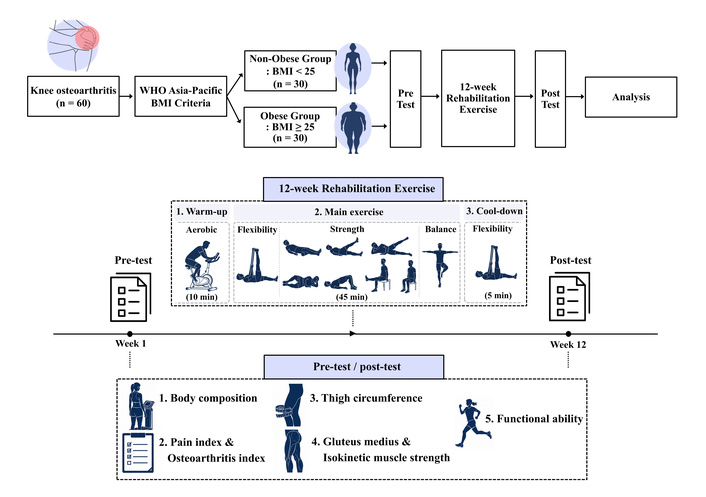
The general design of the study and the rehabilitation exercise protocol are presented in Figure 2. This retrospective study was conducted to compare pre–post clinical and functional changes associated with participation in a standardized 12-week rehabilitation exercise program between obese and non-obese patients with KOA. All participants completed the rehabilitation exercise program three times per week for 12 weeks under the supervision of nationally certified Health Exercise Managers with experience in musculoskeletal rehabilitation. Completion of the program required attendance at all 36 supervised exercise sessions. Each exercise session consisted of warm-up (10 min), main exercise (45 min), and cool-down (5 min), with a total duration of 60 min per session. Treatment fidelity was maintained through direct supervision of all sessions using the standardized exercise protocol.
The warm-up consisted of aerobic exercise using a stationary bicycle (TBR7000, DRAX, Anyang, Republic of Korea) for 10 min. Exercise intensity was prescribed using a 0–10 rating of perceived exertion (RPE) scale and was progressively increased from RPE 4–5 during weeks 1–4 to RPE 5–6 during weeks 5–8 and RPE 6–7 during weeks 9–12.
The main exercise program, which targeted lower extremity function and knee joint stability, consisted of flexibility exercises, strength exercises, and balance exercises, and was performed for a total of 45 min. Flexibility exercises included 3-way hamstring stretching, standing quadriceps stretching, and standing calf stretching, which were performed at an intensity corresponding to RPE 4 to 5 throughout the 12-week intervention period, with each stretch held for 15 s and performed once per side.
Strength exercises included Q-set with foam roller, 4-way straight leg raise (SLR), bridge, leg extension, calf raise, wall squat, and clamshell exercises, whereas balance training consisted of single-leg multidirectional balance exercises. Strengthening and balance exercises were progressively intensified every 4 weeks using the 0–10 RPE scale. During weeks 1–4, exercises were performed primarily using body weight at an intensity corresponding to RPE 4–5. During weeks 5–8, resistance bands (red or green) were introduced to achieve an intensity corresponding to RPE 5–6. During weeks 9–12, the intensity and resistance of exercise increased further using resistance bands (green or blue) to achieve RPE 6–7. Resistance-band intensity and exercise difficulty were individually adjusted by the exercise specialist to maintain the prescribed RPE range according to each participant’s functional capacity and symptoms. Most strength and balance exercises were performed for 15 repetitions × 3 sets. A 30-s rest interval was provided between sets, and a 2-min rest interval was provided between exercises.
The cool-down consisted of static stretching exercises identical to those performed during the flexibility exercise component and was performed for 5 min.
Changes in body composition, pain and osteoarthritis index, thigh circumference, gluteus medius, isokinetic muscle strength, and functional ability were analyzed before and after the exercise intervention.
The radiographic severity of KOA was assessed using the K-L classification system based on standard knee X-ray examinations. The K-L classification system classifies radiographic features, including joint space narrowing, osteophyte formation, subchondral sclerosis, and bony deformity, into grades 1 to 4, with higher grades indicating greater radiographic severity [27, 28].
Body composition assessments included height, body weight, BMI, skeletal muscle mass (SMM), body fat mass (BFM), and percent body fat (%BF). Height was measured using an electronic stadiometer (DS-102, Jenix, Seoul, Republic of Korea). Body weight, BMI, SMM, BFM, and %BF were assessed using a bioelectrical impedance analysis device (InBody 570, InBody, Seoul, Republic of Korea). Participants were instructed to refrain from vigorous physical activity and food intake prior to assessment according to the standardized assessment protocol of the sports medicine center at Konkuk University Hospital. Before measurement, participants removed jewelry and other metallic accessories and stood barefoot on the electrode platform. Measurements were obtained while participants held the hand electrodes with their arms slightly abducted from the trunk.
Pain was assessed using the pain-visual analog scale (P-VAS), with scores ranging from 0 (no pain) to 10 (worst imaginable pain) [29]. Participants selected the number that best represented their overall knee pain intensity. Knee pain, stiffness, and physical function were evaluated using the Korean version of the Western Ontario and McMaster Universities Osteoarthritis Index (WOMAC) [30, 31]. Higher WOMAC scores indicate greater severity of symptoms and functional limitation. The WOMAC consists of 24 items assessing pain (5 items), stiffness (2 items), and physical function (17 items), with each item scored on a 5-point scale from 0 (none) to 4 (extreme). The total score ranges from 0 to 96, with higher scores indicating greater severity of symptoms and functional limitation. The total WOMAC score was used in the analysis without normalization. WOMAC was prespecified as the primary outcome in the Clinical Research Information Service (CRIS) registration, whereas the other clinical and functional outcomes were specified as secondary outcomes.
Thigh circumference was measured using a non-elastic tape (Rollfix, hoechstmass®, Sulzbach, Germany) to evaluate changes in the size of the thigh muscle according to the method described by Mathur et al. [32]. Participants stood upright with their feet shoulder-width apart and body weight evenly distributed. Circumference measurements were obtained at 5 cm and 15 cm proximally to the superior border of the patella using a tape measure. Each site was measured twice, and the mean value was recorded to the nearest 0.1 cm.
Isometric gluteus medius strength was assessed using a handheld dynamometer (K-Myo, Kinvent Biomecanique, Montpellier, France). Participants were positioned supine with both legs approximately shoulder-width apart, the hip in a neutral position, and the knee fully extended. The dynamometer was secured with a strap at the lateral epicondyle of the index limb. Previous studies have demonstrated high reliability for supine hip abductor strength assessment using a handheld dynamometer with external stabilization [33, 34]. Two 5-s maximal voluntary isometric contractions were performed, and the higher value was recorded in Newtons (N) and used for analysis. Quadriceps and hamstring muscle function were evaluated using an isokinetic dynamometer (Biodex System 4 Pro, Biodex Medical Systems, Shirley, NY, USA). Participants were seated with the dynamometer axis aligned with the lateral femoral epicondyle, and the thigh, chest, and pelvis were stabilized to minimize extraneous movement. The knee range of motion was set from 0° to 90°. Peak torque (PT) and relative PT (RPT) were assessed at an angular velocity of 60°/s during concentric knee extension and flexion of the index limb. Before maximal testing, participants performed three repetitions of familiarization at approximately 50% of maximal effort, followed by a 1-min rest period. Four maximal repetitions were then performed with standardized verbal encouragement, and the highest value was used for analysis. RPT was calculated as PT divided by body weight and expressed as a percentage (%).
Lower extremity functional performance was assessed using dynamic balance, the Timed Up and Go (TUG) test, and the 4-m walk time test. The TUG test was used to assess functional mobility and performance in the lower extremities [35]. The 4-m walk time test was used to assess lower extremity functional performance in older adults [36]. Dynamic balance was assessed during a single-leg stance task using a POSTUROMED platform (Zebris FDM-JS System, Zebris Medical GmbH, Isny, Germany) combined with a CMS-10 motion analysis system (Zebris FDM-JS System, Zebris Medical GmbH, Isny, Germany), with the length of the sway path recorded as the outcome measure. A lower sway-path length indicates less postural sway and better dynamic balance performance. The test was performed barefoot on the index limb, with the second toe aligned with the center of the platform, the knee flexed to approximately 30°, and the eyes open. After one familiarization trial, two 10-s trials were performed, and the mean sway-path length, expressed in millimeters, was used for analysis. The TUG test measured the time required to stand up from a chair, walk 3 m, turn, return, and sit down. The 4-m walk time test assessed the time required to walk 4 m at a maximum safe speed.
All statistical analyses were performed using SPSS software (version 29.0; IBM Corp., Armonk, NY, USA). Descriptive statistics are presented as means ± standard deviations. The normality of all outcome variables was assessed using the Shapiro–Wilk test prior to parametric analyses. Baseline continuous variables were compared between groups using independent samples t-tests, and categorical variables were compared using chi-square tests.
A two-way repeated-measures analysis of variance (ANOVA) was performed to examine the main effects of group and time and the group × time interaction, with the interaction serving as the principal test of differences in pre–post changes between the BMI groups. Within-group pre–post changes were additionally examined using paired t-tests as supplementary analyses. Mean changes with 95% confidence intervals were calculated, and between-group differences in changes were assessed using independent-samples t-tests.
Effect sizes for the main and interaction effects of the repeated-measures ANOVA were expressed as partial eta squared (ηp2).
As shown in Table 2, a significant group × time interaction was observed only for body weight (p = 0.006, ηp2 = 0.125), whereas the group × time interaction for BMI did not reach statistical significance (p = 0.051, ηp2 = 0.064). Significant main effects of time were identified for BMI (p = 0.006, ηp2 = 0.123), BFM (p < 0.001, ηp2 = 0.238), and %BF (p < 0.001, ηp2 = 0.216), whereas no significant main effects of time were observed in SMM (p = 0.084, ηp2 = 0.050).
Pre- and post-intervention body composition variables and repeated-measures ANOVA results.
| Variables | Group | Time | Mean change (95% CI) | p-value (ηp2) | ||
|---|---|---|---|---|---|---|
| Pre | Post | |||||
| Weight (kg) | Non-obese | 59.10 ± 6.41 | 58.80 ± 6.76 | –0.297(–0.963, 0.370) | T | < 0.001 (0.207)††† |
| G | < 0.001 (0.428)††† | |||||
| Obese | 72.09 ± 7.77### | 70.11 ± 7.90### | –1.973***(–2.962, –0.984) | |||
| T × G | 0.006 (0.125)†† | |||||
| BMI (kg/m2) | Non-obese | 22.88 ± 1.91 | 22.70 ± 1.99 | –0.177(–0.446, 0.093) | T | 0.006 (0.123)†† |
| G | < 0.001 (0.601)††† | |||||
| Obese | 28.48 ± 2.72### | 27.49 ± 2.46### | –0.997*(–1.794, –0.199) | |||
| T × G | 0.051 (0.064) | |||||
| SMM (kg) | Non-obese | 22.15 ± 2.74 | 22.54 ± 2.60 | 0.383*(0.028, 0.738) | T | 0.084 (0.050) |
| G | 0.061 (0.059) | |||||
| Obese | 23.88 ± 4.48 | 24.34 ± 4.52 | 0.467(–0.457, 1.391) | |||
| T × G | 0.864 (0.001) | |||||
| BFM (kg) | Non-obese | 17.77 ± 3.86 | 16.74 ± 4.34 | –1.027*(–1.928, –0.125) | T | < 0.001 (0.238)††† |
| G | < 0.001 (0.455)††† | |||||
| Obese | 26.34 ± 5.41### | 24.83 ± 5.31### | –1.510***(–2.332, –0.688) | |||
| T × G | 0.421 (0.011) | |||||
| %BF (%) | Non-obese | 29.56 ± 5.05 | 28.20 ± 5.59 | –1.357*(–2.378, –0.335) | T | < 0.001 (0.216)††† |
| G | < 0.001 (0.282)††† | |||||
| Obese | 36.88 ± 6.78### | 35.43 ± 6.63### | –1.447**(–2.456, –0.438) | |||
| T × G | 0.898 (0.000) | |||||
%BF: percent body fat; ANOVA: analysis of variance; BFM: body fat mass; BMI: body mass index; CI: confidence interval; G: group; SMM: skeletal muscle mass; T × G: time × group interaction; T: time; ηp2: partial eta squared. ††: Significant main effect or interaction effect from repeated-measures ANOVA (p < 0.01). †††: Significant main effect or interaction effect from repeated-measures ANOVA (p < 0.001). *: Significant within-group pre–post difference (p < 0.05). **: Significant within-group pre–post difference (p < 0.01). ***: Significant within-group pre–post difference (p < 0.001). ###: Significant between-group difference determined by an independent-samples t-test (p < 0.001).
Within-group analyses revealed significant reductions in BFM (p = 0.027) and %BF (p = 0.011) in the non-obese group, whereas the obese group demonstrated significant reductions in body weight (p < 0.001), BMI (p = 0.016), BFM (p < 0.001), and %BF (p = 0.006). A significant group × time interaction was observed for body weight (p = 0.006), with a greater reduction in the obese group. In contrast, the group × time interaction for BMI did not reach statistical significance (p = 0.051), despite a significant within-group reduction observed only in the obese group.
As shown in Table 3, no significant group × time interactions were observed for P-VAS or WOMAC scores. However, significant main effects of time were identified for both P-VAS (p < 0.001, ηp2 = 0.841) and WOMAC scores (p < 0.001, ηp2 = 0.644).
Pre- and post-intervention pain and knee osteoarthritis index variables and repeated-measures ANOVA results.
| Variables | Group | Time | Mean change (95% CI) | p-value (ηp2) | ||
|---|---|---|---|---|---|---|
| Pre | Post | |||||
| P-VAS (score) | Non-obese | 4.93 ± 1.17 | 2.17 ± 0.83 | –2.767***(–3.191, –2.343) | T | < 0.001 (0.841)††† |
| G | 0.607 (0.005) | |||||
| Obese | 4.90 ± 1.37 | 2.47 ± 1.17 | –2.433***(–2.868, –1.998) | |||
| T × G | 0.266 (0.021) | |||||
| WOMAC (score) | Non-obese | 43.43 ± 16.82 | 19.90 ± 11.70 | –23.533***(–30.009, –17.058) | T | < 0.001 (0.644)††† |
| G | 0.345 (0.015) | |||||
| Obese | 45.03 ± 17.03 | 24.77 ± 15.97 | –20.267***(–26.132, –14.401) | |||
| T × G | 0.448 (0.010) | |||||
ANOVA: analysis of variance; CI: confidence interval; G: group; P-VAS: pain-visual analog scale; T × G: time × group interaction; T: time; WOMAC: Western Ontario and McMaster Universities Osteoarthritis Index; ηp2: partial eta squared. †††: Significant main effect or interaction effect from repeated-measures ANOVA (p < 0.001). ***: Significant within-group pre–post difference (p < 0.001).
Within-group analyses demonstrated significant reductions in the P-VAS and WOMAC scores in the non-obese and obese groups after the intervention (all p < 0.001).
As shown in Table 4, no significant group × time interactions were observed for thigh circumference at either 5 cm or 15 cm. However, significant main effects of time were identified for thigh circumference at 5 cm (p < 0.001, ηp2 = 0.659) and 15 cm (p < 0.001, ηp2 = 0.350).
Pre- and post-intervention thigh circumference variables and repeated-measures ANOVA results.
| Variables | Group | Time | Mean change (95% CI) | p-value (ηp2) | ||
|---|---|---|---|---|---|---|
| Pre | Post | |||||
| TC at 5 cm (cm) | Non-obese | 37.33 ± 3.38 | 38.27 ± 3.43 | 0.947***(0.641, 1.253) | T | < 0.001 (0.659)††† |
| G | < 0.001 (0.414)††† | |||||
| Obese | 41.80 ± 2.05### | 43.15 ± 2.31### | 1.353***(1.031, 1.676) | |||
| T × G | 0.066 (0.057) | |||||
| TC at 15 cm (cm) | Non-obese | 44.04 ± 3.29 | 44.74 ± 3.44 | 0.703**(0.214, 1.193) | T | < 0.001 (0.350)††† |
| G | < 0.001 (0.374)††† | |||||
| Obese | 48.48 ± 3.14### | 49.86 ± 3.03### | 1.380***(0.794, 1.966) | |||
| T × G | 0.075 (0.054) | |||||
ANOVA: analysis of variance; CI: confidence interval; G: group; T × G: time × group interaction; T: time; TC: thigh circumference; ηp2: partial eta squared. †††: Significant main effect or interaction effect from repeated-measures ANOVA (p < 0.001). **: Significant within-group pre–post difference (p < 0.01). ***: Significant within-group pre–post difference (p < 0.001). ###: Significant between-group difference determined by an independent-samples t-test (p < 0.001).
Within-group analyses demonstrated significant increases in thigh circumference at 5 cm in both the non-obese and obese groups (both p < 0.001). Similarly, thigh circumference at 15 cm increased significantly in both the non-obese (p = 0.006) and obese groups (p < 0.001) after the intervention.
As shown in Table 5, no significant group × time interactions were observed for gluteus medius strength, absolute PT (APT) extension, APT flexion, RPT extension, and RPT flexion. However, significant main effects of time were identified for gluteus medius strength (p < 0.001, ηp2 = 0.582), APT extension (p < 0.001, ηp2 = 0.601), APT flexion (p < 0.001, ηp2 = 0.537), RPT extension (p < 0.001, ηp2 = 0.525), and RPT flexion (p < 0.001, ηp2 = 0.391).
Pre- and post-intervention gluteus medius strength and lower extremity isokinetic function variables and repeated-measures ANOVA results.
| Variables | Group | Time | Mean change (95% CI) | p-value (ηp2) | ||
|---|---|---|---|---|---|---|
| Pre | Post | |||||
| GMS (N) | Non-obese | 133.81 ± 42.79 | 177.94 ± 40.85 | 44.133***(27.053, 61.213) | T | < 0.001 (0.582)††† |
| G | 0.052 (0.064) | |||||
| Obese | 147.96 ± 48.25 | 203.32 ± 44.33 | 55.360***(40.515, 70.205) | |||
| T × G | 0.314 (0.017) | |||||
| APT_Ext (Nm) | Non-obese | 66.25 ± 29.10 | 82.90 ± 31.86 | 16.648***(11.660, 21.636) | T | < 0.001 (0.601)††† |
| G | 0.314 (0.017) | |||||
| Obese | 72.56 ± 26.09 | 91.55 ± 30.63 | 18.992***(12.992, 24.992) | |||
| T × G | 0.541 (0.006) | |||||
| APT_Flex (Nm) | Non-obese | 34.99 ± 12.82 | 45.16 ± 14.09 | 10.173***(7.077, 13.269) | T | < 0.001 (0.537)††† |
| G | 0.617 (0.004) | |||||
| Obese | 38.08 ± 15.68 | 45.77 ± 16.62 | 7.691***(4.491, 10.891) | |||
| T × G | 0.259 (0.022) | |||||
| RPT_Ext (%) | Non-obese | 114.31 ± 44.21 | 137.88 ± 39.25 | 23.572***(14.547, 32.596) | T | < 0.001 (0.525)††† |
| G | 0.217 (0.026) | |||||
| Obese | 99.15 ± 34.99 | 129.21 ± 37.76 | 30.062***(19.741, 40.384) | |||
| T × G | 0.337 (0.016) | |||||
| RPT_Flex (%) | Non-obese | 58.81 ± 18.80 | 74.03 ± 21.96 | 15.227***(8.362, 22.092) | T | < 0.001 (0.391)††† |
| G | 0.064 (0.058) | |||||
| Obese | 51.47 ± 19.53 | 63.21 ± 21.59 | 11.739***(5.853, 17.624) | |||
| T × G | 0.433 (0.011) | |||||
ANOVA: analysis of variance; APT: absolute peak torque; CI: confidence interval; Ext: extension; Flex: flexion; G: group; GMS: gluteus medius strength; RPT: relative peak torque; T × G: time × group interaction; T: time; ηp2: partial eta squared. †††: Significant main effect or interaction effect from repeated-measures ANOVA (p < 0.001). ***: Significant within-group pre–post difference (p < 0.001).
Within-group analyses demonstrated significant improvements in gluteus medius strength, APT extension, APT flexion, RPT extension, and RPT flexion in both the non-obese and obese groups following the intervention (all p < 0.001).
As shown in Table 6, no significant group × time interactions were observed for dynamic balance, the 3-m TUG, or 4-m walk time. However, significant main effects of time were identified for dynamic balance (p < 0.001, ηp2 = 0.417), 3-m TUG (p < 0.001, ηp2 = 0.559), and 4-m walk time (p < 0.001, ηp2 = 0.446).
Pre- and post-intervention lower extremity functional performance variables and repeated-measures ANOVA results.
| Variables | Group | Time | Mean change (95% CI) | p-value (ηp2) | ||
|---|---|---|---|---|---|---|
| Pre | Post | |||||
| DB (mm) | Non-obese | 378.30 ± 166.58 | 215.77 ± 88.05 | –162.533***(–224.253, –100.813) | T | < 0.001 (0.417)††† |
| G | 0.986 (0.000) | |||||
| Obese | 348.80 ± 134.84 | 244.27 ± 147.02 | –104.533***(–162.773, –46.293) | |||
| T × G | 0.167 (0.033) | |||||
| 3-m TUG (sec) | Non-obese | 6.92 ± 1.12 | 6.11 ± 0.90 | –0.815***(–1.088, –0.541) | T | < 0.001 (0.559)††† |
| G | 0.525 (0.007) | |||||
| Obese | 7.21 ± 1.13 | 6.15 ± 1.13 | –1.062***(–1.416, –0.707) | |||
| T × G | 0.263 (0.022) | |||||
| 4-m WT (sec) | Non-obese | 3.26 ± 0.50 | 2.82 ± 0.38 | –0.442***(–0.588, –0.297) | T | < 0.001 (0.446)††† |
| G | 0.484 (0.008) | |||||
| Obese | 3.50 ± 0.90 | 2.77 ± 0.45 | –0.726***(–1.044, –0.408) | |||
| T × G | 0.103 (0.045) | |||||
ANOVA: analysis of variance; CI, confidence interval; DB: dynamic balance; G, group; T × G, time × group interaction; T, time; TUG: Timed Up and Go; WT, walk time; ηp2: partial eta squared. †††: Significant main effect or interaction effect from repeated-measures ANOVA (p < 0.001). ***: Significant within-group pre–post difference (p < 0.001).
Within-group analyses demonstrated significant improvements in dynamic balance, 3-m TUG, and 4-m walk time in both the non-obese and obese groups after the intervention (all p < 0.001).
The present study investigated whether pre–post changes in clinical and functional outcomes after a standardized 12-week rehabilitation exercise program differed between obese and non-obese patients with KOA. The primary finding of the present study was that a significant group × time interaction was observed only for body weight. For BMI and the other clinical and functional outcomes, no statistically significant group × time interactions were observed, indicating that the present study did not detect sufficient statistical evidence that the mean pre–post changes differed between the obese and non-obese groups. Although significant within-group changes were observed for several outcomes, these findings should not be interpreted as evidence of equivalent or comparable responses between the groups.
Previous studies have reported inconsistent findings regarding changes in body composition after exercise interventions in patients with KOA. Systematic review and meta-analysis studies have consistently demonstrated that exercise interventions improve pain and physical function in patients with KOA; however, the effects on body weight and BMI appear to be relatively inconsistent and can vary according to the characteristics of the intervention and the severity of obesity [16]. Similarly, exercise and dietary weight-loss interventions have been reported to improve symptoms and physical function in overweight and obese older adults with KOA [37]. In addition, exercise-induced changes in obesity-related parameters can vary according to exercise modality, duration of intervention, intensity of exercise, and baseline severity of obesity. Collectively, these findings indicate that body composition changes associated with rehabilitation exercise in patients with KOA remain inconclusive.
In the present study, significant reductions in body weight and BMI were observed only in the obese group, whereas BFM and %BF decreased significantly in both groups after the intervention. These findings may partly reflect differences in baseline adiposity and metabolic characteristics according to obesity classification. Obese individuals may exhibit altered metabolic responses to exercise due to higher baseline adiposity and obesity-related metabolic dysregulation [38]. Previous studies have suggested that exercise may improve glucose utilization, insulin sensitivity, and lipid oxidation in skeletal muscle in individuals with obesity [39]. Importantly, although significant within-group changes were observed in pain, muscle function, balance ability, and gait performance in both groups, the group × time interactions for these outcomes were not statistically significant. Therefore, the present findings do not provide evidence that the magnitude of these changes was equivalent or comparable between the obese and non-obese groups. These findings suggest that the observed clinical and functional changes may not be explained solely by reductions in body weight. Rather, possible improvements in neuromuscular function, lower-extremity stabilization, and movement efficiency may partly contribute to the observed reductions in pain and improvements in physical function.
Interestingly, SMM did not change significantly after the intervention, whereas thigh circumference increased significantly in both groups. This discrepancy may reflect the localized characteristics of the rehabilitation exercise program applied in the present study. Because whole-body bioelectrical impedance analysis provides global body composition estimates, it may not fully capture regional adaptations around the knee joint. Previous MRI-based studies have shown that individual thigh muscles may exhibit localized changes in patients with KOA [40]. In contrast, increases in thigh circumference may be consistent with localized changes in thigh size associated with exercise participation in patients with KOA [32, 41]. However, thigh circumference is a non-specific measure that may be influenced by muscle mass, subcutaneous fat, fluid accumulation, measurement location, and tape tension. Therefore, the observed increase in thigh circumference should not be interpreted as direct evidence of muscle hypertrophy or reduced arthrogenic muscle inhibition. Furthermore, because the main purpose of the rehabilitation exercise program was functional recovery and movement stabilization rather than resistance training oriented to hypertrophy, substantial increases in total body SMM may not have been expected during the 12-week intervention period.
Another notable finding of the present study was that increases in thigh circumference occurred concurrently with improvements in gluteus medius strength and isokinetic muscle function in both groups. Although the increase in thigh circumference alone cannot be considered direct evidence of muscular adaptation, its concurrent occurrence with improvements in muscle strength may be consistent with functional muscular and neuromuscular adaptations following the rehabilitation exercise program. Previous studies have reported that reduced hip abductor strength and quadriceps weakness are associated with altered lower extremity biomechanics, impaired balance ability, and functional limitations in patients with KOA, potentially contributing to increased medial knee joint loading [26, 42, 43]. Therefore, the improvements in gluteus medius strength and isokinetic muscle function observed in the present study may have contributed to enhanced lower extremity joint stability and movement efficiency during functional activities. These neuromuscular adaptations may partially explain the functional improvements observed despite the absence of substantial increases in SMM.
The present study also demonstrated significant improvements in dynamic balance, 3-m TUG performance, and 4-m walk time after the intervention in both groups. Previous studies have reported that impaired balance ability and reduced walk time are associated with pain severity, muscular weakness, increased risk of falls, and reduced quality of life in patients with KOA [44, 45]. In addition, slower gait performance has been recognized as an important predictor of disability and reduced functional independence in older adults with mobility limitations [46]. Therefore, the improvements in balance and gait performance observed in the present study may indicate enhanced neuromuscular control, improved coordination of the lower extremities, and greater movement efficiency during functional activities after participation in rehabilitation exercise.
Another important finding was that both obese and non-obese groups demonstrated statistically significant improvements in pain and WOMAC scores after the intervention. Obesity has traditionally been considered a major risk factor for the development and progression of KOA because excess body weight increases mechanical load on the knee joint and contributes to low-grade chronic systemic inflammation [7]. Consequently, several previous studies have suggested that individuals with obesity with KOA may experience less favorable rehabilitation outcomes due to excessive joint stress and reduced physical capacity [6, 16]. However, improvements in pain, muscular function, balance ability, and gait performance were observed within both BMI groups, while the corresponding group × time interactions were not statistically significant. These findings indicate that the present study did not detect statistical evidence of differences in the mean pre–post changes in these outcomes between the obese and non-obese groups.
Nevertheless, several limitations should be considered when interpreting the findings of the present study. First, given the retrospective pre–post design and the absence of a non-exercise comparison group, the observed changes cannot be attributed solely to participation in the rehabilitation exercise program. Regression to the mean, natural fluctuations in symptoms, medication use, changes in daily physical activity or dietary intake, familiarization with the assessment procedures, and other concurrent care may also have influenced the observed outcomes. Therefore, caution is warranted when interpreting the observed pre–post changes as intervention effects. In addition, body composition was assessed using a whole-body bioelectrical impedance analysis, which may have limited the ability to detect localized muscular adaptations around the knee joint. Furthermore, inflammatory biomarkers and biomechanical variables associated with neuromuscular adaptations were not evaluated, limiting the ability to fully explain the physiological mechanisms underlying the observed improvements. Finally, because the present study was retrospectively designed and was not randomized, potential measurement bias related to the absence of assessor blinding, selection bias and confounding variables should be considered when interpreting the relationship between obesity status and rehabilitation response. In addition, dichotomization of BMI may have resulted in loss of information when evaluating the relationship between baseline BMI and subsequent changes in clinical and functional outcomes. The multiple outcomes examined may also have increased the risk of type I error, and the sample size may have limited the precision of the estimated group × time interaction effects. Moreover, because the analysis included patients with complete baseline and follow-up assessments and the sample was predominantly female with limited representation of more severe obesity, caution is warranted when generalizing the findings to broader KOA populations.
Future studies may further investigate whether changes in thigh circumference occurring concurrently with improvements in lower extremity strength reflect regional muscular adaptations despite the absence of substantial changes in whole-body SMM in patients with KOA. Prospective studies incorporating regional muscle imaging techniques such as ultrasonography or magnetic resonance imaging together with electromyographic and biomechanical analyses can help clarify whether rehabilitation exercise primarily induces neuromuscular recovery, reductions in arthrogenic muscle inhibition, or localized muscular hypertrophy around the knee joint. Furthermore, longitudinal studies that examine inflammatory and metabolic biomarkers can provide further insight into the improvement of pain and KOA index following rehabilitation exercise participation. Collectively, these findings can contribute to the development of more individualized rehabilitation exercise strategies to improve clinical and functional outcomes in obese and non-obese patients with KOA.
The present study demonstrated that reductions in body weight and BMI were observed in obese patients with KOA, while improvements in clinical and functional outcomes were observed in both obese and non-obese patients over the 12-week rehabilitation exercise period. In particular, reductions in BFM and %BF, as well as improvements in pain and osteoarthritis index, thigh circumference, gluteus medius strength, isokinetic muscle strength, and functional ability were observed following the intervention in both groups. Although a significant group × time interaction was observed only for body weight, improvements in muscular function and functional performance were observed over the 12-week period in both groups. These findings suggest that participation in the structured rehabilitation exercise program was associated with favorable changes in clinical symptoms and lower extremity functional outcomes in patients with KOA, although these findings should not be interpreted as evidence of equivalent responses between the BMI groups.
%BF: percent body fat
ANOVA: analysis of variance
APT: absolute peak torque
BFM: body fat mass
BMI: body mass index
DB: dynamic balance
EMR: electronic medical record
Ext: extension
Flex: flexion
GMS: gluteus medius strength
IRB: Institutional Review Board
K-L: Kellgren-Lawrence
KOA: knee osteoarthritis
PT: peak torque
P-VAS: pain-visual analog scale
RPE: rating of perceived exertion
RPT: relative peak torque
SMM: skeletal muscle mass
TUG: Timed Up and Go
WHO: World Health Organization
WOMAC: Western Ontario and McMaster Universities Osteoarthritis Index
WT: walk time
ηp2: partial eta squared
SyK: Conceptualization, Methodology, Formal analysis, Visualization, Writing—original draft. EL: Conceptualization, Methodology, Formal analysis, Investigation, Writing—original draft, Writing—review & editing. DWL: Investigation, Writing—review & editing. SIC: Investigation, Writing—review & editing. JHC: Investigation, Writing—review & editing. YS: Investigation, Writing—review & editing. SW: Investigation, Writing—review & editing. SWK: Investigation, Writing—review & editing. JK: Investigation, Writing—review & editing. KL: Methodology, Formal analysis, Writing—review & editing. HYP: Conceptualization, Methodology, Formal analysis, Supervision, Writing—original draft, Writing—review & editing. All authors read and approved the submitted version.
The authors declare that they have no conflicts of interest.
The study was approved by the Institutional Review Board of Konkuk University Medical Center (KUMC IRB No. 2026-01-037) and was conducted in accordance with the ethical principles of the Declaration of Helsinki. The study was also registered with the Clinical Research Information Service (CRIS), Republic of Korea (KCT0012016).
The requirement for informed consent was waived by the Institutional Review Board of Konkuk University Medical Center due to the retrospective nature of the study.
Not applicable.
The datasets used and/or analyzed during the current study are available from the corresponding author on reasonable request.
This study was supported by the National Research Foundation (NRF) of Republic of Korea grant funded by the Korean government (MSIT) (NRF-2022R1F1A1063548). The funder had no role in study design, data collection and analysis, decision to publish, or preparation of the manuscript.
© The Author(s) 2026.
Open Exploration maintains a neutral stance on jurisdictional claims in published institutional affiliations and maps. All opinions expressed in this article are the personal views of the author(s) and do not represent the stance of the editorial team or the publisher.
Copyright: © The Author(s) 2026. This is an Open Access article licensed under a Creative Commons Attribution 4.0 International License (https://creativecommons.org/licenses/by/4.0/), which permits unrestricted use, sharing, adaptation, distribution and reproduction in any medium or format, for any purpose, even commercially, as long as you give appropriate credit to the original author(s) and the source, provide a link to the Creative Commons license, and indicate if changes were made.



View: 50
Download: 7
Times Cited: 0