 Original Article


Affiliation:
Basic and Pharmacy Department, Yunnan Medical Health College, Kunming City 650300, Yunnan Province, China
†These authors share the first authorship.
Email: tianruan777@126.com
ORCID: https://orcid.org/0009-0003-2210-8338


 ,
,
Affiliation:
Basic and Pharmacy Department, Yunnan Medical Health College, Kunming City 650300, Yunnan Province, China
†These authors share the first authorship.
ORCID: https://orcid.org/0009-0008-7871-1685
Explor Med. 2026;7:1001428 DOI: https://doi.org/10.37349/emed.2026.1001428
Received: March 28, 2026 Accepted: June 16, 2026 Published: September 14, 2026
Academic Editor: Yingyong Zhao, Northwest University, China
Aim: Chronic kidney disease (CKD) is a major global health burden. Emerging evidence links water quality with kidney outcomes, but ecological panel evidence remains limited and context dependent. We examined hypothesis-generating associations between surface water quality indicators and CKD burden in China, Canada, and Ireland during 2010–2017.
Methods: We integrated age-standardized CKD rates from the Institute for Health Metrics and Evaluation (IHME) GBD Results Tool (DALYs, deaths, incidence, prevalence, years lived with disability (YLDs), and years of life lost (YLLs) per 100,000 population; country-year estimates were restricted to 2010–2017) for China, Canada, and Ireland with 284,965 surface water quality observations. The downloaded IHME citation identified the release as Global Burden of Disease Study 2023 (GBD 2023) Results, while the estimates used in this analysis were limited to 2010–2017. Country-specific ordinary least-squares regression was used for the primary analysis; random-effects meta-analysis was used only to summarize country-specific estimates, and restricted cubic spline (RCS) analyses explored non-linear patterns. Standardized beta coefficients were added to improve comparability across countries and water-quality scales.
Results: CKD DALYs rates declined in China (–13.5%) and Ireland (–5.4%) but rose in Canada (+9.0%). In country-specific models, nitrate was inversely associated with CKD DALYs (beta = –12.10; 95% CI: –19.80 to –4.41; P = 0.002; standardized beta = –0.25) and deaths (beta = –0.94; P = 0.006; standardized beta = –0.26) in Ireland. Total nitrogen was inversely associated with CKD incidence in Canada (beta = –0.63; P = 0.006; standardized beta = –0.20). These associations occurred over narrow exposure ranges and should be interpreted cautiously. Random-effects pooled estimates were not statistically significant, and heterogeneity across outcomes ranged from none to substantial (I2: 0–78.4%).
Conclusions: Surface water nitrate and nitrogen showed inconsistent, country-specific associations with CKD burden and did not yield robust pooled estimates. These hypothesis-generating ecological findings underscore the need for individual-level studies with measured drinking-water exposure, harmonized diagnostic information, and latency-aware designs.
Chronic kidney disease (CKD) is a major global health burden. Global Burden of Disease (GBD) estimates show that CKD deaths, disability-adjusted life years (DALYs), prevalence, and incidence have continued to increase over recent decades, with population growth, ageing, diabetes, hypertension, and environmental exposures contributing to the changing burden [1–5]. Because CKD surveillance depends on diagnostic intensity, vital registration, and claims data, cross-country comparisons require careful interpretation and transparent reporting of age-standardized rates and uncertainty [1–5].
Surface water quality may influence population health through drinking-water source catchments, agricultural irrigation, food chains, and recreational contact. Nitrate and total nitrogen are widely monitored freshwater indicators, but their kidney-related interpretation is not straightforward because exposure source, co-contaminants, redox chemistry, diet, water treatment, and baseline health status may modify risk [6–11]. A large US National Health and Nutrition Examination Survey (NHANES) analysis reported an L-shaped relationship between urinary nitrate and CKD prevalence [9], whereas the Agricultural Health Study found that dietary nitrite from processed meats, rather than drinking-water nitrate alone, was associated with end-stage renal disease (ESRD) risk under low vitamin C intake [10]. In China, PM2.5 nitrate, measured as a particulate mass concentration in air (micrograms per cubic meter), was positively associated with CKD risk and is best interpreted here as an air-pollution confounder rather than a surface-water exposure [11]. These mixed findings support country-specific analyses rather than assuming a uniform nitrate-CKD relationship.
CKD of unknown etiology (CKDu), reported in Sri Lanka, Central America, Nigeria, and other settings, has been linked mainly to groundwater quality, heat stress, agrochemical exposure, dehydration, and socioeconomic vulnerability rather than to a single universal contaminant [12–17]. Multiple Sri Lankan studies identified combined effects of fluoride, water hardness, and metals in well water [12–15]. In Taiwan, China, river water quality showed weak but statistically significant correlations with CKD prevalence, while groundwater arsenic appeared more important [16]. Recent methodological work on ecological analysis and environmental concentration datasets emphasizes bias assessment, transparent exposure-data reliability criteria, and caution when ecological sampling coverage differs across places [18, 19].
We hypothesized that higher surface-water nitrate or total nitrogen would be associated with higher CKD burden, but we anticipated effect modification by country because water treatment, agricultural practices, monitoring networks, healthcare access, and CKD ascertainment differ substantially across settings. China, Canada, and Ireland were selected because they had publicly accessible annual surface-water monitoring data that could be harmonized with Institute for Health Metrics and Evaluation (IHME) GBD Results Tool CKD estimates for 2010–2017 and because they provided contrasting water-quality profiles and health-system contexts. This exploratory study aimed to: (1) describe CKD burden and surface-water quality trends within each country; (2) estimate country-specific associations and summarize them with random-effects meta-analysis; and (3) explore non-linear exposure-response patterns.
Exploratory ecological panel study integrating CKD burden estimates with annual surface-water quality data from China, Canada, and Ireland, 2010–2017 (24 country-year observations). Because country context was expected to modify associations, country-specific models were treated as the primary analysis; pooled estimates were interpreted as descriptive summaries rather than as evidence of a single cross-national effect.
Age-standardized CKD rates (DALYs, deaths, incidence, prevalence, years lived with disability (YLDs), and years of life lost (YLLs) per 100,000 population) were extracted from the IHME GBD Results Tool for all three countries [1–3]. The downloaded IHME citation identified the release as Global Burden of Disease Study 2023 (GBD 2023) Results; the present analysis used only country-year estimates from 2010 to 2017. The GBD Results Tool provides uncertainty intervals (UIs) for each estimate; however, this analysis used point estimates because the small country-year panel and water-quality linkage were not designed to propagate the full GBD posterior uncertainty. We therefore interpret all regression estimates as exploratory and report this as a limitation.
Surface water monitoring data were obtained from national and public monitoring sources: Canada (n = 3,949), China (n = 45,997), and Ireland (n = 235,019) observations. Indicators included total nitrogen (mg/L), nitrate (mg/L), dissolved oxygen (mg/L), water temperature (°C), and the Canadian Council of Ministers of the Environment Water Quality Index (CCME WQI; 0–100) [20]. The CCME WQI was included as a transparent composite descriptor of overall surface-water condition, but it was not developed specifically for kidney outcomes, and its component weighting may not map onto nephrotoxicity. Therefore, nitrate and total nitrogen were treated as the main exposure indicators, and CCME WQI was interpreted descriptively. Country-level annual means were computed after quality-control filtering.
Trend analysis used annual percent change (APC). Country-specific ordinary least-squares regression was fitted for each water quality-CKD pair. Random-effects meta-analysis (DerSimonian-Laird) with I2 was used to summarize country-specific estimates and quantify heterogeneity [21, 22]. Standardized beta coefficients were calculated as beta multiplied by the ratio of the predictor SD to the outcome SD, allowing interpretation per 1-SD higher exposure. Restricted cubic spline (RCS) models used 3 knots (10th, 50th, and 90th percentiles) and 999-iteration bootstrap 95% confidence intervals (CIs) [6, 23]. Pearson correlation analysis was performed for descriptive screening, with pooled correlations interpreted as between-country summaries. As a sensitivity check, we re-estimated key country-specific associations after excluding 2010 or 2017. All analyses were conducted in Python 3.11.
Publicly available, de-identified aggregate data. No ethical review required.
Table 1 presents descriptive statistics by country. China had the highest mean DALYs rate (279.7 ± 14.7), followed by Canada (229.5 ± 9.3) and Ireland (183.5 ± 8.8). Ireland had the highest incidence (250.8 ± 0.6) and prevalence (7,795 ± 23) rates. Water quality profiles were distinct: Ireland had the highest total nitrogen (1.73 ± 0.04 mg/L), Canada the highest nitrate (6.22 ± 3.53 mg/L), and China the highest water temperature (23.4 ± 0.4°C). China’s total nitrogen values were low (annual means 0.031–0.036 mg/L) but traceable to the harmonized source dataset; this likely reflects the specific monitoring records, parameter definitions, and quality-control filters available for the China series rather than national drinking-water exposure.
Descriptive statistics of CKD burden and water quality indicators by country (mean ± SD, 2010–2017).
| Variable | China(mean ± SD) | Canada(mean ± SD) | Ireland(mean ± SD) | Overall(mean ± SD) |
|---|---|---|---|---|
| DALYs_rate | 279.72 ± 14.70 | 229.52 ± 9.32 | 183.47 ± 8.76 | 230.90 ± 41.56 |
| Deaths_rate | 8.68 ± 0.50 | 9.55 ± 0.45 | 8.32 ± 0.66 | 8.85 ± 0.74 |
| Incidence_rate | 153.32 ± 0.09 | 170.96 ± 0.71 | 250.76 ± 0.58 | 191.68 ± 43.31 |
| Prevalence_rate | 7,274.54 ± 5.93 | 6,392.26 ± 12.92 | 7,794.55 ± 22.86 | 7,153.79 ± 591.45 |
| YLDs_rate | 88.56 ± 0.61 | 78.69 ± 0.73 | 66.95 ± 0.32 | 78.07 ± 9.04 |
| YLLs_rate | 191.16 ± 15.23 | 150.83 ± 8.73 | 116.52 ± 9.01 | 152.84 ± 33.01 |
| Nitrogen | 0.03 ± 0.00 | 0.54 ± 0.22 | 1.73 ± 0.04 | 0.77 ± 0.74 |
| Nitrate | 0.16 ± 0.02 | 6.22 ± 3.53 | 1.39 ± 0.18 | 2.59 ± 3.31 |
| Temperature | 23.37 ± 0.36 | 13.46 ± 1.68 | 11.22 ± 0.29 | 16.02 ± 5.48 |
| DO | 8.33 ± 0.13 | 9.80 ± 0.33 | 8.67 ± 0.43 | 8.93 ± 0.71 |
| CCME | 96.60 ± 0.25 | 93.72 ± 4.80 | 98.03 ± 0.44 | 96.12 ± 3.23 |
DO: dissolved oxygen.
CKD trajectories differed markedly (Figure 1). China showed the largest DALYs decline (–13.5%, 306.7 to 265.4) and deaths decline (–13.5%). Canada demonstrated a +9.0% increase in DALYs (210.6 to 229.7). Ireland maintained lower DALYs and death rates with a –5.4% DALYs decline. Incidence was remarkably stable (< 1% APC) in all countries. Ireland’s higher age-standardized incidence relative to DALYs and deaths may reflect differences in diagnostic intensity, case ascertainment, age at diagnosis, survival, or coding practice; age-specific GBD strata were not analyzed in this study.
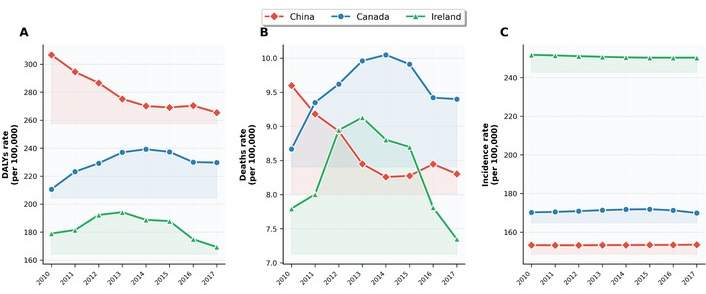
Age-standardized CKD burden trends by country, 2010–2017. A. DALYs rate; B. deaths rate; C. incidence rate (per 100,000). Shaded areas represent country-specific ranges.
Figure 2 shows distinct water quality profiles. Canada’s nitrate declined 65.7% from 2010 to 2017 (7.99 to 2.74 mg/L), with a minimum in 2015 (1.67 mg/L) before partial recovery. China maintained consistently low annual mean total nitrogen and nitrate in the harmonized dataset. Ireland had the highest total nitrogen (1.65–1.77 mg/L) with a 32.5% nitrate increase. CCME WQI was at least 84.8 in all country-years, indicating generally good composite surface-water quality while not excluding kidney-relevant variation in individual nitrogen indicators.
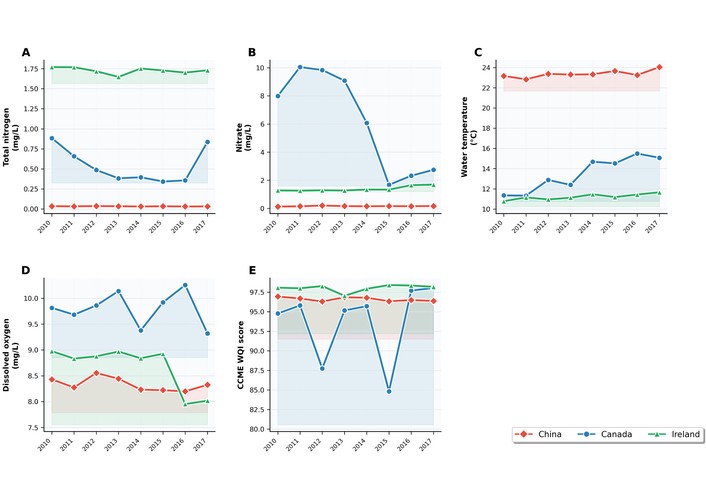
Surface water quality trends by country, 2010–2017. A. Total nitrogen; B. nitrate; C. water temperature; D. dissolved oxygen; E. CCME WQI score.
Table 2 and Figures 3, 4, and 5 present the country-specific and pooled results. In Ireland, nitrate was inversely associated with CKD DALYs (beta = –12.10; 95% CI: –19.80 to –4.41; P = 0.002; standardized beta = –0.25) and deaths (beta = –0.94; P = 0.006; standardized beta = –0.26); total nitrogen was inversely associated with DALYs (beta = –4.70; P = 0.029; standardized beta = –0.02). In Canada, total nitrogen was inversely associated with incidence (beta = –0.63; P = 0.006; standardized beta = –0.20). These estimates should be interpreted cautiously because Ireland’s nitrate range was narrow (1.28–1.69 mg/L) and Canada’s nitrogen range was also modest (0.34–0.88 mg/L), making residual time trends and ecological confounding plausible explanations. Pooled estimates were attenuated and not statistically significant; DALYs-total nitrogen approached significance (beta = –3.03; P = 0.062; I2 = 0.0%). High heterogeneity for some outcomes (I2 up to 78.4%) reflected divergent country patterns.
Country-specific and pooled regression coefficients for water quality indicators and CKD burden.
| Outcome | Predictor | Country | Beta | 95% CI | SE | P_value | N | Std beta |
|---|---|---|---|---|---|---|---|---|
| DALYs | Nitrate | China | –1.326 | –14.0660–11.4150 | 6.5 | 0.8384 | 8 | –0.00 |
| DALYs | Nitrate | Canada | 5.752 | –13.7910–25.2950 | 9.971 | 0.564 | 8 | 2.18 |
| DALYs | Nitrate | Ireland | –12.104 | –19.7990 to –4.4080 | 3.926 | 0.0021 | 8 | –0.25 |
| DALYs | Nitrate | Pooled | –5.128 | –15.3690–5.1130 | 5.225 | 0.3263 | 24 | –0.41 |
| DALYs | Nitrogen | China | –0.338 | –5.4020–4.7250 | 2.583 | 0.8958 | 8 | –0.00 |
| DALYs | Nitrogen | Canada | –5.828 | –21.6030–9.9460 | 8.048 | 0.469 | 8 | –0.14 |
| DALYs | Nitrogen | Ireland | –4.695 | –8.9130 to –0.4770 | 2.152 | 0.0291 | 8 | –0.02 |
| DALYs | Nitrogen | Pooled | –3.028 | –6.2030–0.1460 | 1.62 | 0.0615 | 24 | –0.05 |
| DALYs | Temperature | China | 0.888 | –11.9500–13.7260 | 6.55 | 0.8922 | 8 | 0.02 |
| DALYs | Temperature | Canada | 2.925 | –22.9750–28.8250 | 13.214 | 0.8248 | 8 | 0.53 |
| DALYs | Temperature | Ireland | –4.148 | –19.5850–11.2900 | 7.876 | 0.5985 | 8 | –0.14 |
| DALYs | Temperature | Pooled | –0.651 | –9.8750–8.5720 | 4.706 | 0.8899 | 24 | –0.09 |
| Deaths | Nitrate | China | –0.037 | –0.5930–0.5190 | 0.284 | 0.8955 | 8 | –0.00 |
| Deaths | Nitrate | Canada | 0.323 | –0.7790–1.4250 | 0.562 | 0.5654 | 8 | 2.53 |
| Deaths | Nitrate | Ireland | –0.942 | –1.6070 to –0.2770 | 0.339 | 0.0055 | 8 | –0.26 |
| Deaths | Nitrate | Pooled | –0.281 | –1.0000–0.4370 | 0.367 | 0.4428 | 24 | –1.26 |
| Incidence | Nitrogen | China | –0.005 | –0.0600–0.0490 | 0.028 | 0.8476 | 8 | –0.00 |
| Incidence | Nitrogen | Canada | –0.631 | –1.0760 to –0.1860 | 0.227 | 0.0055 | 8 | –0.20 |
| Incidence | Nitrogen | Ireland | 0.077 | –0.0460–0.1990 | 0.062 | 0.219 | 8 | 0.01 |
| Incidence | Nitrogen | Pooled | –0.046 | –0.2200–0.1290 | 0.089 | 0.6066 | 24 | –0.00 |
Standardized beta is expressed per 1-SD higher water-quality indicator. SE: standard error.
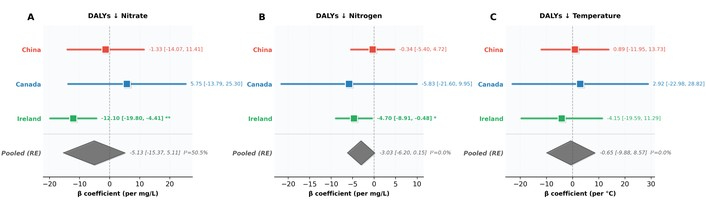
Forest plots for CKD DALYs rate associations. A. Nitrate; B. total nitrogen; C. water temperature. Squares indicate country-specific estimates; diamonds indicate random-effects pooled estimates. Significant markers are shown only where present in the figure.
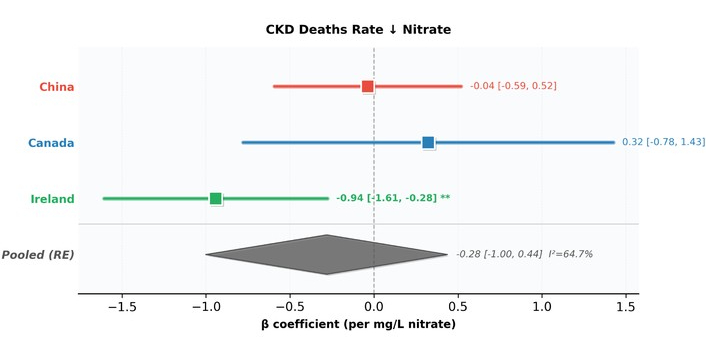
Forest plot for CKD death rate and nitrate. Ireland showed an inverse country-specific association (beta = –0.94; P = 0.006). The pooled random-effects estimate was not statistically significant (I2 = 64.7%).
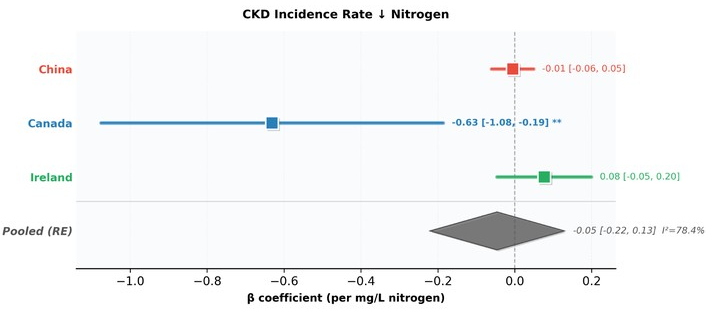
Forest plot for CKD incidence rate and total nitrogen. Canada showed an inverse country-specific association (beta = –0.63; P = 0.006). The pooled random-effects estimate was not statistically significant (I2 = 78.4%).
Pearson correlation analysis (Table 3) showed that total nitrogen was strongly inversely correlated with DALYs (r = –0.940, P < 0.01) and YLDs (r = –0.973), while temperature was positively correlated with DALYs (r = 0.908). These pooled correlations primarily reflect between-country differences and should not be interpreted as causal within-country effects.
Pearson correlation matrix (pooled, n = 24).
| Variable | DALYs_rate | Deaths_rate | Incidence_rate | Prevalence_rate | YLDs_rate | YLLs_rate | Nitrogen | Nitrate | Temperature | DO | CCME |
|---|---|---|---|---|---|---|---|---|---|---|---|
| DALYs_rate | 1.000** | 0.351 | –0.897 | –0.330 | 0.958 | 0.997 | –0.940 | –0.196 | 0.908 | –0.174 | –0.188 |
| Deaths_rate | 0.351 | 1.000** | –0.427 | –0.708 | 0.228 | 0.379 | –0.400 | 0.472 | –0.028 | 0.688 | –0.496 |
| Incidence_rate | –0.897 | –0.427 | 1.000** | 0.666 | –0.952 | –0.869 | 0.976 | –0.130 | –0.751 | –0.114 | 0.355 |
| Prevalence_rate | –0.330 | –0.708 | 0.666 | 1.000** | –0.411 | –0.303 | 0.557 | –0.687 | –0.025 | –0.739 | 0.565 |
| YLDs_rate | 0.958 | 0.228 | –0.952 | –0.411 | 1.000** | 0.932 | –0.973 | –0.136 | 0.913 | –0.159 | –0.214 |
| YLLs_rate | 0.997 | 0.379 | –0.869 | –0.303 | 0.932 | 1.000** | –0.917 | –0.210 | 0.893 | –0.176 | –0.177 |
| Nitrogen | –0.940 | –0.400 | 0.976 | 0.557 | –0.973 | –0.917 | 1.000** | –0.008 | –0.826 | –0.022 | 0.347 |
| Nitrate | –0.196 | 0.472 | –0.130 | –0.687 | –0.136 | –0.210 | –0.008 | 1.000** | –0.495 | 0.721 | –0.387 |
| Temperature | 0.908 | –0.028 | –0.751 | –0.025 | 0.913 | 0.893 | –0.826 | –0.495 | 1.000** | –0.493 | 0.017 |
| DO | –0.174 | 0.688 | –0.114 | –0.739 | –0.159 | –0.176 | –0.022 | 0.721 | –0.493 | 1.000** | –0.486 |
| CCME | –0.188 | –0.496 | 0.355 | 0.565 | –0.214 | –0.177 | 0.347 | –0.387 | 0.017 | –0.486 | 1.000** |
** P < 0.01. Pooled correlations reflect between-country differences and do not imply causation. DO: dissolved oxygen.
RCS analyses revealed exploratory non-linear patterns (Figures 6, 7, and 8). For DALYs-nitrate, a U-shaped curve suggested different associations at low vs. high concentrations. DALYs-total nitrogen showed an inverse trend at 0–1 mg/L, flattening at higher values. Deaths-nitrate showed a non-linear inverse pattern below 5 mg/L. Deaths-temperature showed a positive association at 12–16°C, consistent with concern that warming, heat exposure, dehydration, and climate-sensitive water conditions may contribute to kidney vulnerability [24]. Given n = 24, these RCS patterns should be viewed as descriptive signals rather than confirmatory dose-response evidence.
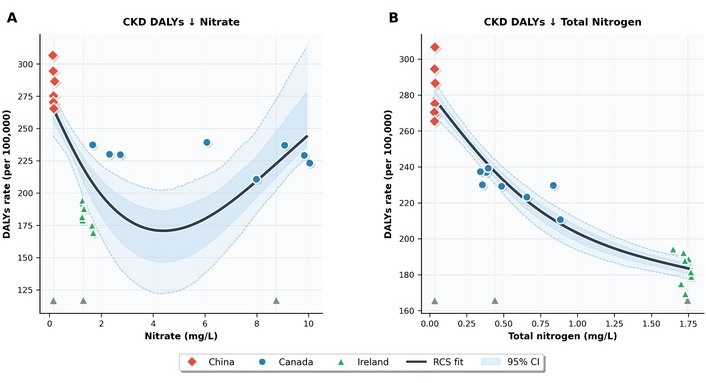
Restricted cubic spline (RCS). CKD DALYs rate vs. A. nitrate; B. total nitrogen. Dark line: RCS fit; blue shading: 95% bootstrap CI; triangles: knot positions. N = 24.
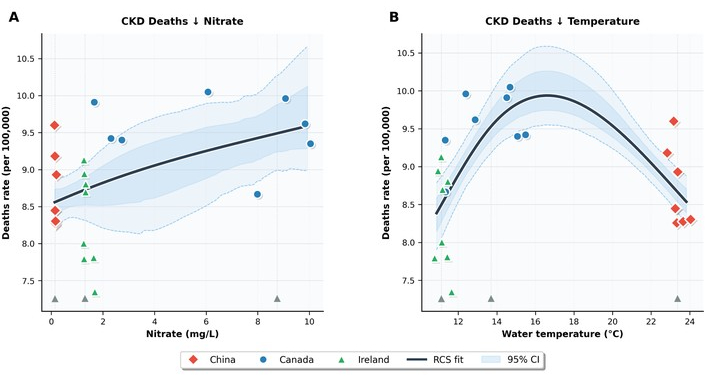
Restricted cubic spline. CKD death rate vs. A. nitrate; B. water temperature. N = 24.
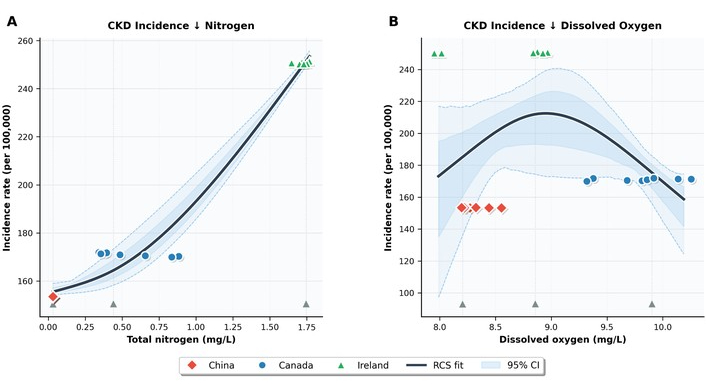
Restricted cubic spline. CKD incidence rate vs. A. total nitrogen; B. dissolved oxygen. N = 24.
Table 4 summarises baseline (2010), endpoint (2017), and percent change. Notable shifts include China’s 13.5% DALYs decline, Canada’s 65.7% nitrate decline, and Ireland’s 32.5% nitrate increase—contextualising the regression findings.
Baseline (2010), endpoint (2017), and percent change by country.
| Variable | China_2010 | China_2017 | China_%Change | Canada_2010 | Canada_2017 | Canada_%Change | Ireland_2010 | Ireland_2017 | Ireland_%Change |
|---|---|---|---|---|---|---|---|---|---|
| DALYs_rate | 306.66 | 265.39 | –13.46 | 210.63 | 229.67 | 9.04 | 179.0 | 169.32 | –5.4 |
| Deaths_rate | 9.6 | 8.3 | –13.5 | 8.67 | 9.4 | 8.46 | 7.79 | 7.35 | –5.74 |
| Incidence_rate | 153.3 | 153.48 | 0.12 | 170.23 | 169.91 | –0.19 | 251.73 | 250.27 | –0.58 |
| Prevalence_rate | 7,276.05 | 7,285.91 | 0.14 | 6,372.66 | 6,399.87 | 0.43 | 7,831.16 | 7,768.03 | –0.81 |
| YLDs_rate | 87.66 | 88.45 | 0.9 | 77.55 | 79.08 | 1.97 | 67.31 | 67.4 | 0.14 |
| YLLs_rate | 219.0 | 176.94 | –19.2 | 133.08 | 150.59 | 13.16 | 111.69 | 101.92 | –8.75 |
| Nitrogen | 0.03 | 0.03 | –6.92 | 0.88 | 0.84 | –5.4 | 1.77 | 1.73 | –2.24 |
| Nitrate | 0.13 | 0.17 | 30.14 | 7.99 | 2.74 | –65.73 | 1.28 | 1.69 | 32.52 |
| Temperature | 23.17 | 24.05 | 3.78 | 11.35 | 15.07 | 32.79 | 10.78 | 11.66 | 8.17 |
| DO | 8.43 | 8.32 | –1.24 | 9.81 | 9.32 | –5.04 | 8.98 | 8.02 | –10.68 |
| CCME | 96.95 | 96.38 | –0.59 | 94.77 | 98.03 | 3.44 | 98.07 | 98.18 | 0.11 |
DO: dissolved oxygen. Percentage changes were calculated from unrounded annual means and may differ slightly from changes computed from the rounded values shown.
Endpoint-year sensitivity analyses excluding 2010 or 2017 preserved the direction of the key Ireland nitrate-DALYs, Ireland nitrate-deaths, Ireland nitrogen-DALYs, and Canada nitrogen-incidence associations. However, because each sensitivity model retained only seven observations, these checks support descriptive stability rather than causal robustness.
This exploratory ecological panel study integrates IHME GBD Results Tool CKD burden estimates with harmonized surface-water quality monitoring across China, Canada, and Ireland. The main finding is not a consistent cross-national association, but rather substantial country-specific heterogeneity: several inverse associations were observed within individual countries, whereas random-effects pooled estimates were not robust or statistically significant. Therefore, the null pooled findings should not be interpreted as evidence of no association; instead, the study is underpowered to detect pooled effects when country-specific directions and exposure ranges differed.
The inverse associations between nitrate and CKD in Ireland are counterintuitive when considered against the broader health concerns raised for drinking-water nitrate and related nitrogen species—concerns that centre mainly on N-nitroso compound formation and cancer and birth-defect outcomes rather than on CKD itself [7, 8]. Several explanations warrant consideration. First, ecological confounding is likely: Ireland’s nitrate changed over a narrow range while CKD DALYs and deaths declined, and shared time-varying factors may have driven both trends. Second, the broader nitrate literature is biologically and epidemiologically mixed. NHANES analyses reported an L-shaped relationship between urinary nitrate and CKD prevalence [9], and the NITRATE-CIN trial found that short-term inorganic nitrate reduced contrast-induced nephropathy in a specific clinical context [25]. These findings do not imply that surface-water nitrate is protective at the population level; rather, they illustrate that nitrate source, dose, co-exposures, and nitric oxide biology can complicate interpretation.
Conversely, the potential harm from nitrate and nitrogen species depends on the exposure context. The Agricultural Health Study found that drinking-water nitrate itself was not associated with ESRD, whereas nitrite from processed meats was associated with higher ESRD risk in participants with low vitamin C intake [10]. In China, PM2.5 nitrate was associated with CKD risk, with temperature-related effect modification reported in air-pollution analyses [11, 26]. These examples reinforce that source, route, co-contaminants, diet, and climate conditions may determine renal effects, a nuance that country-level ecological studies cannot disentangle.
The CKDu literature provides further context. Sri Lankan studies identified synergistic effects of fluoride, Mg-hardness, and metals in groundwater [12–15]. Prospective well-water analyses reported kidney-function decline in CKDu-endemic settings [27], and a Nigerian GIS study found CKD clusters coinciding with elevated nephrotoxic metals [28]. In Taiwan, China, surface-water associations were weak, and groundwater arsenic appeared more important [16]. These studies reinforce that water-source type and co-contaminants matter; the present analysis examines national surface-water indicators rather than individual groundwater or drinking-water exposures.
Divergent CKD trajectories likely reflect differences in demographic structure, metabolic risk, healthcare access, diagnostic coding, vital registration, and claims-data completeness. We removed causal language about improvements in hypertension or diabetes detection because the present analysis did not include health-system indicators. Global analyses indicate that population growth, ageing, diabetes, hypertension, and ascertainment differences are major contributors to CKD burden patterns [2, 3, 29, 30].
Limitations include: (1) ecological design preventing individual-level inference; (2) small panel size (n = 8 per country), limiting power and adjustment; (3) unmeasured confounders, including diet, medications, diabetes, hypertension, occupational heat exposure, socioeconomic conditions, healthcare access, and CKD diagnostic coding; (4) reliance on GBD point estimates without propagating GBD UIs; (5) different water-monitoring networks, sampling fractions, laboratory methods, and parameter definitions across countries; (6) surface-water indicators rather than measured individual drinking-water exposure; (7) potential latency mismatch between annual water quality and chronic CKD outcomes; and (8) data-availability bias, because countries with publicly available harmonized annual surface-water data are not representative of all global regions. Sensitivity analyses excluding 2010 or 2017 did not change the direction of the key Ireland nitrate-DALYs and Canada nitrogen-incidence associations, but they remained vulnerable to ecological time trends. Strengths include transparent use of public data, country-specific modelling, random-effects summary estimates, standardized beta coefficients, and explicit interpretation as hypothesis-generating evidence.
In summary, in this exploratory ecological study of three countries, surface-water nitrate and total nitrogen showed inconsistent, country-specific associations with CKD burden that did not yield robust pooled estimates. These hypothesis-generating findings underscore the need for individual-level studies with measured drinking-water exposure, longer and latency-aware time series, harmonized CKD ascertainment, healthcare-access covariates, and careful assessment of climate-sensitive water and heat exposures.
APC: annual percent change
CCME WQI: Canadian Council of Ministers of the Environment Water Quality Index
CIs: confidence intervals
CKD: chronic kidney disease
CKDu: chronic kidney disease of unknown etiology
DALYs: disability-adjusted life years
ESRD: end-stage renal disease
GBD: Global Burden of Disease
IHME: Institute for Health Metrics and Evaluation
NHANES: National Health and Nutrition Examination Survey
RCS: restricted cubic spline
UIs: uncertainty intervals
YLDs: years lived with disability
YLLs: years of life lost
TR: Conceptualization, Data curation, Formal analysis, Investigation, Methodology, Software, Visualization, Writing—original draft, Writing—review & editing. ZZ: Conceptualization, Investigation, Methodology, Validation, Writing—review & editing. TR and ZZ contributed equally to this work. Both authors read and approved the submitted version.
The authors declare that there are no conflicts of interest.
This study used publicly available, de-identified aggregate data. No ethical review was required.
Not applicable.
Not applicable.
The CKD burden data analyzed in this study were obtained from the Institute for Health Metrics and Evaluation (IHME) GBD Results Tool (https://vizhub.healthdata.org/gbd-results/), subject to IHME data-use terms. The downloaded IHME citation identified the release as Global Burden of Disease Study 2023 (GBD 2023) Results, and the present analysis was restricted to country-year estimates from 2010 to 2017. Water quality data were obtained from public monitoring sources in China, Canada, and Ireland, as documented in the source file. Derived datasets and analysis code are available from the corresponding author upon reasonable request.
This work was supported by the Yunnan Provincial Department of Education Science Research Fund (grant numbers 2026J2256 and 2024J2133). The funders had no role in study design, data collection and analysis, decision to publish, or preparation of the manuscript.
© The Author(s) 2026.
Open Exploration maintains a neutral stance on jurisdictional claims in published institutional affiliations and maps. All opinions expressed in this article are the personal views of the author(s) and do not represent the stance of the editorial team or the publisher.
Copyright: © The Author(s) 2026. This is an Open Access article licensed under a Creative Commons Attribution 4.0 International License (https://creativecommons.org/licenses/by/4.0/), which permits unrestricted use, sharing, adaptation, distribution and reproduction in any medium or format, for any purpose, even commercially, as long as you give appropriate credit to the original author(s) and the source, provide a link to the Creative Commons license, and indicate if changes were made.



View: 329
Download: 19
Times Cited: 0


