 Review

Affiliation:
Emeritus Professor of Cardiac Sciences and Physiology/Pharmacology, Libin Cardiovascular Institute, Cumming School of Medicine, University of Calgary, Calgary, Alberta T2N 4N1, Canada
Email: jtyberg@ucalgary.ca
ORCID: https://orcid.org/0000-0003-0105-7327
Explor Med. 2021;2:198–207 DOI: https://doi.org/10.37349/emed.2021.00042
Received: March 30, 2021 Accepted: April 25, 2021 Published: June 30, 2021
Academic Editor: Kathleen Morgan, Boston University, USA
The article belongs to the special issue Exploring Aortic Disease
Some have said that it is inappropriate and perhaps impossible to consider wave and Windkessel phenomena simultaneously. For 50 years, arterial hemodynamics has been dominated by the frequency-domain “impedance analysis” in which it was assumed that all variations in aortic pressure and flow were caused only by forward- and backward-going waves. This paper is a review of the results of incorporating the effects of Frank’s Windkessel. We have taken the view that measured aortic pressure is the sum of a Windkessel component and forward-going and backward-going wave components. When the Windkessel component is initially subtracted out, the pattern of propagation and reflection of wave components becomes clear. Furthermore, this analysis obviates the implications of impedance analysis that have not been explained satisfactorily.
The “classical” approach to aortic wave propagation and reflection is based upon Westerhof’s 1972 paper [1]. It was assumed that all variations in aortic pressure (P) and velocity (U, flow) could be explained by the summation of forward- and backward-going waves. A wave has been defined by Lighthill as a disturbance that changes both pressure and velocity when it passes [2, 3].
Having come from a background of using wave intensity (WI) analysis (WIA) [4] in which WI is calculated from the change in pressure (∆P) and the change in velocity (∆U), we concluded that ∆P might not be entirely due to the passage of waves but could be related to the elastance of the aorta, if the volume of the aorta changes [5] (Elastance was assumed to be constant and this assumption was supported by unpublished observations). Thus, we suggested that aortic pressure should be considered as the sum of pressures: a Windkessel pressure in addition to the pressures due to the passage of waves. (In our later publications, we substituted “reservoir” for Windkessel.)
As Frank [6] proposed, we consider the Windkessel to be a hydraulic integrator, the change of Windkessel pressure (∆PWk) in which is directly related to its change in Windkessel volume (∆VWk) and inversely related to its compliance. The rate of change in VWk is simply the difference between the inflow from the left ventricle (LV) that can be measured and outflow to the periphery that can be calculated.
These principles are best explained in reference to Figure 1. As shown in the top panel, during diastole aortic pressure (PAo) decreases exponentially with a time constant, τ = resistance and compliance (RC) (a limitation of the approach is that the exponential decay cannot be demonstrated if the heart rate is too high). This implies that PAo will fall to an asymptotic level, asymptotic pressure (P∞), after infinite time, which we found to be 30 to 40 mmHg in our anesthetized dogs [7]. The value of PWk during the remainder of the cardiac cycle is calculated using Equation 3 in Wang’s paper [8], which expresses PWk as a function of PAo at the beginning of ejection, of aortic inflow, and of aortic compliance. In the proximal aorta, velocity is zero during diastole while aortic pressure decreases from the end-systolic value to the end-diastolic value. When the heart rate is normally low, we assumed that there were no waves during the latter part of diastole and that the change in diastolic pressure represented the exponential “bleeding off” of a hydraulic capacitor.
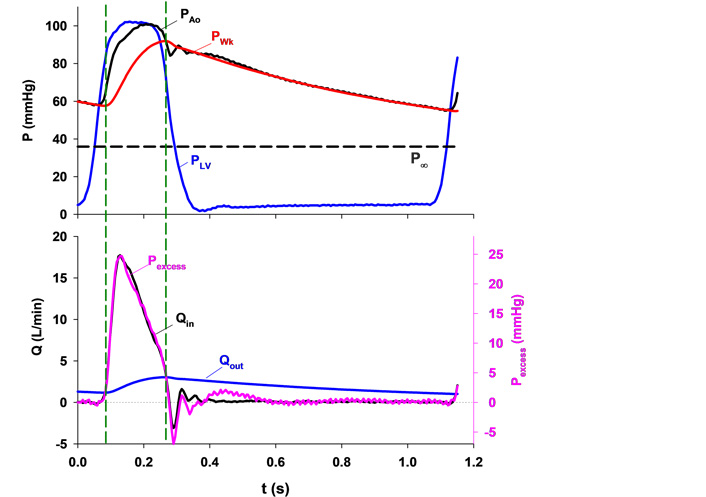
Upper panel: typical aortic root pressure (PAo, black), left ventricular pressure (PLV, blue), calculated Windkessel pressure (PWk, red) and the asymptotic pressure (P∞, black dashed line). Lower panel: excess pressure (Pexcess, pink) calculated by subtracting PWk from PAo and aortic inflow (Qin, black) plotted against time with the scales adjusted so that their peak values coincide. Note that they are almost identical in contour. The Windkessel charges when inflow is greater than outflow and vice versa. Two vertical dashed lines mark the instants when Qin equals outflow (Qout, blue) and, therefore, PWk does not change [5]
Note. Reprinted with permission from “Time-domain representation of ventricular-arterial coupling as a windkessel and wave system” by Wang JJ, O’Brien AB, Shrive NG, Parker KH, Tyberg JV. Am J Physiol Heart Circ Physiol. 2003;284:H1358–68 (https://doi.org/10.1152/ajpheart.00175.2002). © The American Physiological Society.
We measured aortic inflow and calculated aortic outflow, which is proportional to the difference between PWk and P∞ (see the bottom panel). Since integrated outflow must equal integrated inflow, it becomes possible to calculate outflow. Then, by comparing inflow and outflow, the contour of PWk becomes understandable. PWk is the pressure of a volume integrator. When aortic inflow exceeds outflow (i.e., during most of systolic ejection) Windkessel volume and PWk increase and when aortic outflow exceeds inflow (during the remainder of the cycle) Windkessel volume and PWk decrease.
Parker [9] defined excess pressure (Pexcess) as the difference between measured PAo and PWk. Thus, we arbitrarily scaled that pressure and plotted it on the bottom panel of Figure 1. Remarkably, we found it to be precisely proportional to aortic inflow. The ratio of a pressure difference to a flow has units of resistance. We calculated this ratio and found that it was equal to so-called characteristic impedance (in their earlier paper, Westerhof et al. [10] used “resistance” rather than “impedance”). Thus, we interpreted this ratio to be the property of a proximal resistance functionally separating the LV from the Windkessel, as shown in Figure 2 and discussed in detail elsewhere [11, 12].
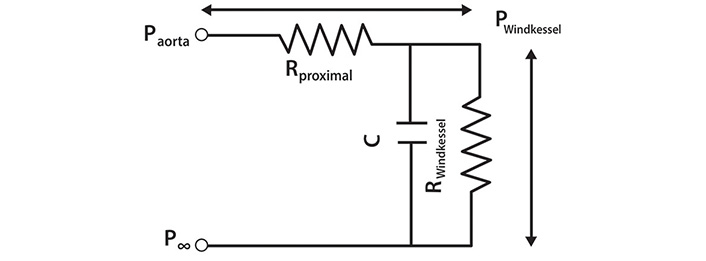
An electrical analogue of the 3-element Windkessel (reservoir). The pressure difference across the whole circuit is equal to the difference between Paorta and P∞. Rproximal is a resistance interposed between the LV and the Windkessel and is equivalent to characteristic impedance. Pwave is generated by the passage of Qin through Rproximal and is equal to the pressure difference across it. C is the compliance and RWindkessel is the resistance of the reservoir (filter). The pressure difference specifically due to the Windkessel is equal to (PWindkessel–P∞) [11]
Note. Reprinted with permission from “The reservoir-wave paradigm: potential implications for hypertension” by Tyberg JV, Shrive NG, Bouwmeester JC, Parker KH, Wang JJ. Curr Hypertens. 2008;4:203–13. (https://doi.org/10.2174/157340208785132572). © EUREKA SCIENCE.
PWk is wave-like in that it, too, is a propagated disturbance [3], as we described [12] (note Animation 3 particularly).
Parker [9] defined Pexcess but Pexcess can be broken down further into that due to forward-going waves (Pexcess+) and that due to backward-going waves (Pexcess–). This is illustrated in Figure 3. PAo (black) recorded from the renal region in a particular experiment is the complex summation of PWk and the pressures due to forward- (red) and backward-going waves (blue).
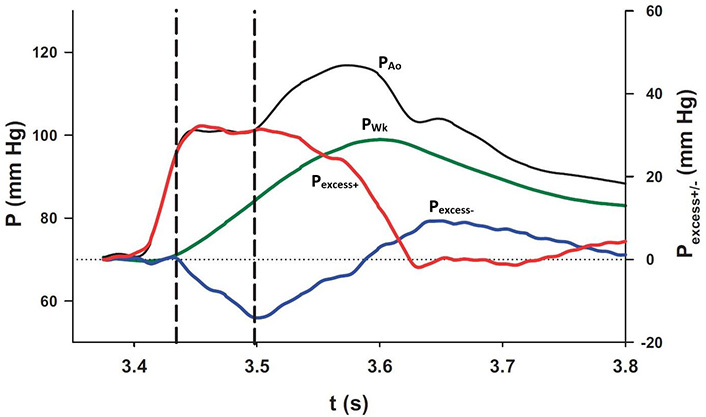
The interaction of each of the pressure components at the diaphragm. PAo and PWk (black and green lines, respectively; scale on the left) were plotted together with Pexcess+ and Pexcess– (red and blue lines, respectively; scale on the right). The plateau in measured pressure is delimited by the vertical dashed lines during which interval the increase in PWk is exactly equalled by the decrease in Pexcess– [8]
Note. Reprinted with permission from “Wave propagation and reflection in the canine aorta: analysis using a reservoir-wave approach” by Wang JJ, Shrive NG, Parker KH, Hughes AD, Tyberg JV. Can J Cardiol. 2011;27:389. (https://doi.org/10.1016/j.cjca.2010.12.072). © Elsevier.
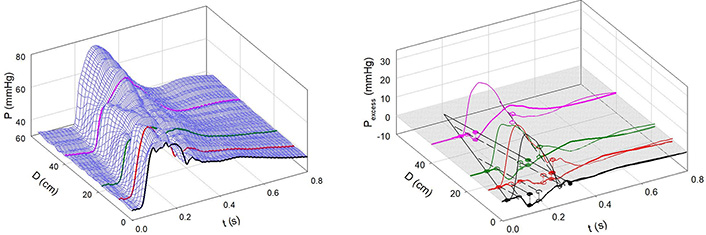
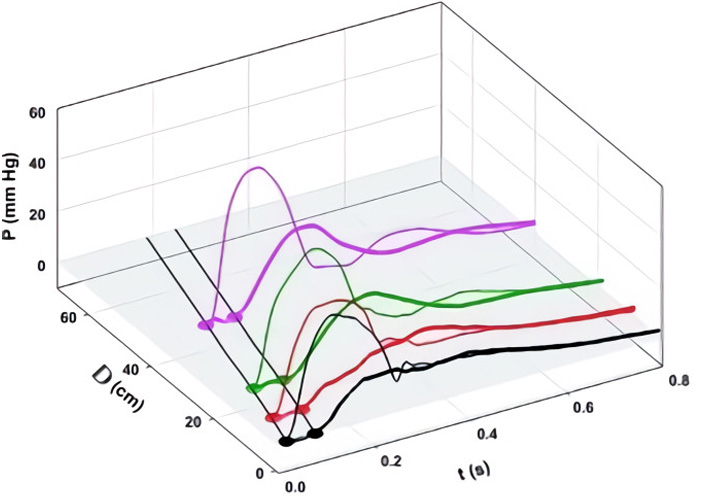
We defined aortic wave propagation and reflection in a series of experiments on anesthetized, open-chest dogs [8]. The atrio-ventricular node was blocked and the hearts were paced from the right ventricle. Aortic pressure was measured with a catheter-tip manometer and aortic flows were measured at 4 locations (just above the aortic valve, just beyond the great vessels, at the diaphragm, and at the bifurcation) with ultrasonic flowmeters. For data recording, the ventilator was stopped at end-expiration for several seconds following which hemodynamic stability was re-established. As illustrated in Figure 4A, pressure was recorded at the aortic valve and then the manometer was pulled back by a 2-cm increment and the measurements repeated. This sequence of maneuvers was repeated until the manometer reached the femoral artery. The data were collated retrospectively and plotted as shown. The onsets of the increases in PAo are indicated by black dots.
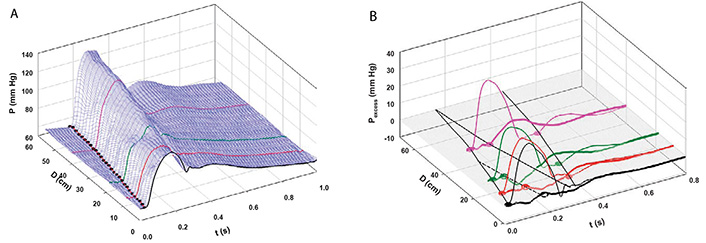
A: Measured aortic pressure (P) during one cardiac cycle, plotted as a function of time (t) and distance (d; from the aortic valve to the femoral artery). Black, red, green, and pink lines indicate the sites at which flows were also recorded (respectively, at the aortic root (0 cm), just beyond the left subclavian artery (8 cm), just above the diaphragm (18 cm), and just above the aortic bifurcation (40 cm from the aortic root). The path of the FCW as a function of time and distance is indicated by black dots; B: pressures due to the passage of forward-going waves (Pexcess+; thin lines) and pressures due to the passage of backward-going waves (Pexcess–; thick lines) were plotted at the locations at which flow was measured. Propagation, distal reflection, and re-reflection and proximal (negative) reflection of the initial FCW are noted in the P = 0 plane. In this and subsequent figures, compression waves will be indicated by filled circles and solid lines and decompression waves, by open circles and dashed lines [8]
Note. Reprinted with permission from “Wave propagation and reflection in the canine aorta: analysis using a reservoir-wave approach” by Wang JJ, Shrive NG, Parker KH, Hughes AD, Tyberg JV. Can J Cardiol. 2011;27:389. (https://doi.org/10.1016/j.cjca.2010.12.072). © Elsevier.
The result of the subsequent analysis is shown in Figure 4B. PWk has been subtracted from PAo to yield Pexcess, which was plotted against time and distance. [WIA requires flow (velocity) as well as pressure measurements so WI was calculated only where flow was measured]. WIA defines whether a wave is forward-going (i.e., in the direction of net blood flow) or backward-going (i.e., in the direction against net blood flow) and whether it is pressure-increasing (a compression wave) or pressure-decreasing (a decompression wave). Thus, respectively, there are four possibilities: a forward-going compression wave (FCW), a forward-going decompression wave (FDW), a backward-going compression wave (BCW), or a backward-going decompression wave (BDW). The FCW followed the course of the black dots in Figure 4A and is indicated by a solid line on the distance-time plane in Figure 4B. As generally anticipated, the FCW proceeded to the femoral circulation where it was reflected positively as a BCW that arrived at the aortic valve after it had closed. (These results in anesthetized animals should not exclude the possibility that the BCW might arrive during systolic ejection and, thus, contribute to systolic hypertension. Pomella et al. [13] have shown recently that wave speed can increase by ~ 50% with exercise.) As not so generally anticipated [14], the FCW was also reflected negatively from an abdominal site approximately 40 cm from the aortic valve; the course of the BDW is depicted by a dashed line. The FDW (not shown) that the LV generates late in ejection and that decelerates the stroke volume was propagated and reflected similarly [8].
Parker [4] has provided an explanation for positive and negative reflection based on the ratio of the area of the “daughter” vessels to the “mother vessel”. As shown in the left side of Figure 5, significant positive reflection (R > 0) occurs when the daughter-to-mother-vessel area ratio (α) is less than approximately 0.5, approaching that of a “closed-end” organ pipe. As shown in the right side, significant negative reflection (R < 0) occurs when the ratio is greater than approximately 2, approaching that of a “open-end” organ pipe.
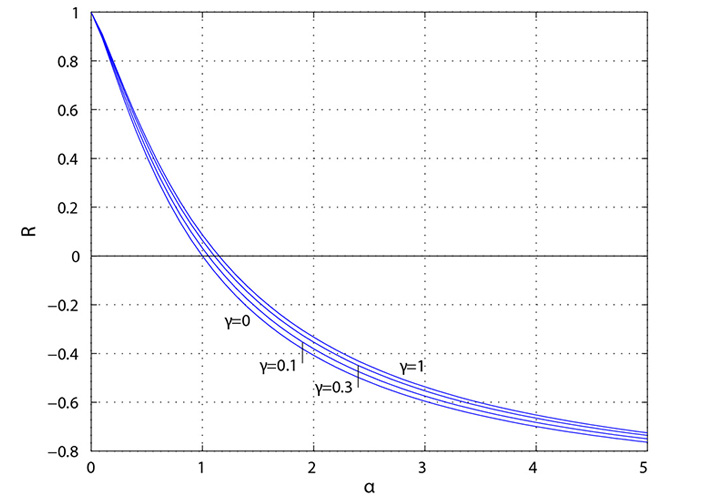
Reflection coefficient (R) plotted as a function of the ratio (α) of daughter-vessel total cross-sectional area to mother-vessel cross-sectional area. The symmetry ratio is given by γ where γ = 0 corresponds to a straight tube with no bifurcations [4]
We compared this normal pattern of aortic wave propagation and reflection to the alterations effected by vasodilatation [sodium nitroprusside (NP)] infusion and vasoconstriction [methoxamine (Mtx)].
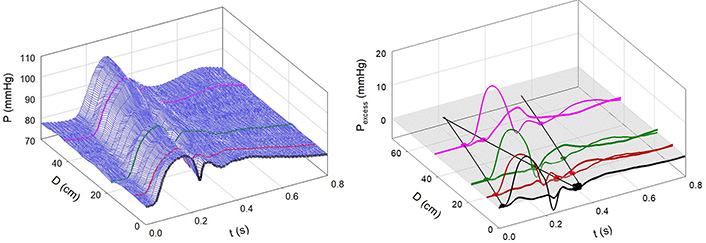
Figure 6A and 6B shows the effects of NP. Notice that the 3-D contour is more complex than that in Figure 4A and that the pressure peaks are diminished in some locations by the effects of decompression waves emanating from new sites of negative reflection (in the femoral circulation approximately 50 cm from the aortic valve and from the aortic arch, approximately 10 cm from the aortic valve). These new, negatively reflecting sites may be due to the nitrate-induced dilatation of conducting arteries, as was demonstrated previously [7, 15, 16].
Infusion of NP. A: Measured aortic pressure plotted as a function of time and distance. Note that the contour is less regular than in Figure 4; B: path of the FCW and the reflected backward waves. Waves were reflected negatively from the descending aorta, a sub-diaphragmatic site near the renal arteries, and near the aorto-iliac junction and positively from a femoral artery site [7]
Note. Reprinted with permission from “Alterations in aortic wave reflection with vasodilation and vasoconstriction in anaesthetized dogs” by Wang JJ, Bouwmeester JC, Belenkie I, Shrive NG, Tyberg JV. Can J Cardiol. 2013;29:243–53. (https://doi.org/10.1016/j.cjca.2012.03.001). © Elsevier.
Figure 7A and 7B shows the effects of Mtx. Notice that the 3-D contour is less complex than that in Figure 4A and that the negative reflection from the abdominal site is absent. Figure 8 shows an example of greatly enhanced wave reflection due to Mtx.
Infusion of Mtx. A: Measured aortic pressure plotted as a function of time and distance. Note that the contour is more regular than in Figure 4; B: path of the FCW and the reflected wave. Note the absence of negative reflection from the abdominal region [7]
Note. Reprinted with permission from “Alterations in aortic wave reflection with vasodilation and vasoconstriction in anaesthetized dogs” by Wang JJ, Bouwmeester JC, Belenkie I, Shrive NG, Tyberg JV. Can J Cardiol. 2013;29:243–53. (https://doi.org/10.1016/j.cjca.2012.03.001). © Elsevier.
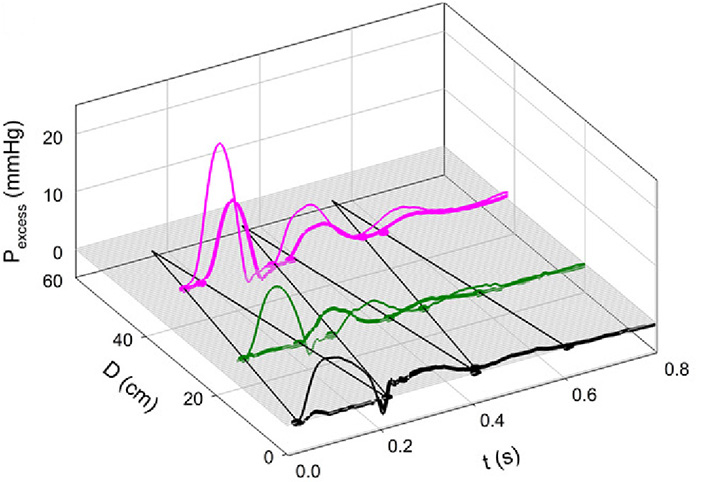
Note the remarkable “billiard-ball” pattern of multiple reflection and re-reflection. The initial FCW was reflected from the periphery, re-reflected from the closed aortic valve, re-re-reflected from the periphery, again re-re-re-reflected from the closed aortic valve, and re-re-re-reflected to cause a BCW above the aortic bifurcation. With Mtx, aortic stiffness and wave speed were increased [7]
Note. Reprinted with permission from “Alterations in aortic wave reflection with vasodilation and vasoconstriction in anaesthetized dogs” by Wang JJ, Bouwmeester JC, Belenkie I, Shrive NG, Tyberg JV. Can J Cardiol. 2013;29:243–53. (https://doi.org/10.1016/j.cjca.2012.03.001). © Elsevier.
Most importantly, it must be appreciated that these remarkably clear definitions of aortic wave propagation and reflection became possible only because we separated PAo into the sum of PWk and Pexcess. PWk is the volume-related pressure and Pexcess is the wave-related pressure. Our first step was to calculate PWk and subtract it from PAo. The distance-time pattern of Pexcess defines wave propagation and reflection
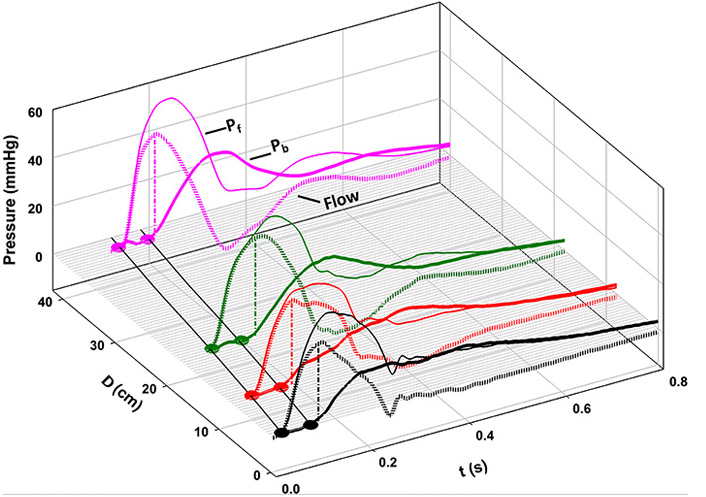
When our original paper was assessed for publication, a reviewer suggested that we apply Westerhof’s concepts [1] to our data at each of the 4 locations, for comparison with our analysis. Figure 9 shows the result. The thinner lines indicate the forward-going wave (Westerhof, Pf), and the thicker lines, backward pressure wave (Westerhof, Pb). At each location, note that Pb follows Pf by approximately the same interval, observations that are consistent with those of Davies et al. [17]. In contrast to a forward-going wave, a backward-going wave should occur first in the periphery and only later, in the proximal circulation.
Separation of forward- (Pf, thin lines) and “backward-going” (Pb, thick lines) pressure waves based on measured pressures and flows, according to the classical method [10]. At every location, note that Pb follows Pf by approximately the same interval [8]
Note. Reprinted with permission from “Wave propagation and reflection in the canine aorta: analysis using a reservoir-wave approach” by Wang JJ, Shrive NG, Parker KH, Hughes AD, Tyberg JV. Can J Cardiol. 2011;27:389. (https://doi.org/10.1016/j.cjca.2010.12.072). © Elsevier.
In 2015, Westerhof et al. [18] responded to these concerns. With respect to the fact that Pb goes forward, they compared the phenomenon to an “echo in a gallery with many arcades”. It is not clear what they think of our observations shown in Figure 9. If they do grant the validity of our observations, we cannot imagine how a gallery with many arcades would create a central Pb waveform that was really propagated backward from the components arising from these peripheral locations. Furthermore, how does a gallery composed of fixed arches respond appropriately to a great range of heart rates? With respect to the “flow waves” during diastole, they remained adamant stating “self-cancelling waves are perfectly in line with wave theory because the compound forward and compound backward flow waves cancel when reflecting against a closed valve resulting in net zero diastolic flow”. However, they do not provide any physical or physiological explanation for either the systolic or diastolic phenomena.
As indicated at the outset, Westerhof et al. [10] assumed that all the variation in aortic pressure and flow could be explained completely by the summation of the effects of forward- and backward-going waves. While this conceptual framework has been almost universally accepted for five decades, it led to two difficult-to-explain implications: during systole, it implied “backward waves” that are forward-going and, during diastole, it implied opposite and self-cancelling flow waves, the physical source of which has never been explained. Given these profound conceptual difficulties, we suggested that some of the change in pressure could be due to a change in the volume of the proximal aorta, Frank’s Windkessel mechanism [6].
How can a forward-going backward wave be explained? In the ascending aorta and throughout the arterial circulation local flow reaches its peak while local pressure is still increasing. If only forward and backward waves are involved, the logic is simple: it must be caused by a backward-going, pressure-increasing wave. This seemed to be an acceptable explanation until we performed the classical analysis on each data set at 4 different locations, which demonstrated that the “backward” wave was propagated forward. These phenomena are illustrated in Figure 10. Note that the onsets of the Pb’s (thicker lines) occur precisely simultaneously with the peaks of the local flow contours (interrupted thick lines).
Comparison of the beginning of the Pb waveform at each location to the time of the peak of the flow waveform (interrupted thick lines). Because the magnitudes of flow at each location were so different, they have been scaled arbitrarily to facilitate comparison (the flow at the aortic root was divided by 5; flows at just beyond the subclavian artery and at the diaphragm were divided by 2.5; and the flow at the bifurcation was multiplied by 1.5). Notice that the Pb waveform begins when flow begins to decrease at each location [19]
Note. Reprinted with permission from “Origin of the forward-going ‘backward’ wave” by Tyberg JV, Burrowes LM, Shrive NG, Wang JJ. J Appl Physiol. 2017;123:1406–7. (https://doi.org/10.1152/japplphysiol.00350.2017). © The American Physiological Society.
Considering the effects of Frank’s Windkessel enables precise definition of wave propagation and reflection as demonstrated here. Furthermore, it eliminates the logically troublesome implications of the wave-only explanation of aortic pressure and flow variation: the forward-going “backward” wave and equal and opposite diastolic flow waves that were never explained mechanistically and that served only to satisfy the numerical constraints imposed by decreasing diastolic aortic pressure in the absence of flow.
BCW: backward-going compression wave
FCW: forward-going compression wave
LV: left ventricle
Mtx: methoxamine
NP: sodium nitroprusside
P: pressure
P∞: asymptotic pressure
PAo: aortic pressure
Pb: backward pressure wave (Westerhof)
Pexcess–: backward-going waves excess pressure
Pexcess: excess pressure
Pexcess+: forward-going waves excess pressure
Pf: forward pressure wave (Westerhof)
PWk: Windkessel pressure
Qin: aortic inflow
U: velocity
WI: wave intensity
WIA: wave intensity analysis
Dr. Tyberg acknowledges the substantial help of Dr. Maryell Urroz Lopez in the preparation of the manuscript, the critical scientific contributions of Drs. Jiun-Jr Wang and Nigel Shrive, and the great surgical skill and assiduous attention to quality demonstrated by Cheryl Hall with respect to all the experiments upon which this paper is based.
The author contributed solely to the work.
The author declares that he has no conflicts of interest.
Not applicable.
Not applicable.
Not applicable.
Not applicable.
Not applicable.
© The Author(s) 2021.
Copyright: © The Author(s) 2021. This is an Open Access article licensed under a Creative Commons Attribution 4.0 International License (https://creativecommons.org/licenses/by/4.0/), which permits unrestricted use, sharing, adaptation, distribution and reproduction in any medium or format, for any purpose, even commercially, as long as you give appropriate credit to the original author(s) and the source, provide a link to the Creative Commons license, and indicate if changes were made.

Lova Prasadareddy Kajuluri ... Kathleen G Morgan
Anne-Maree Kelly
Korin Karabulut ... James Morgan
Preetha Rajasekaran ... Bashi V. Velayudhan
Said Makani ... Youssef Tijani
Dharmsheel Shrivastav ... Vimal Mehta
