Original Article

Affiliation:
1Amity Institute of Biotechnology, Amity University Rajasthan, Jaipur 303002, India
ORCID: https://orcid.org/0000-0002-2022-3290
Affiliation:
2Department of Biochemistry, G.B. Pant Institute of Postgraduate Medical Education & Research, Associated Maulana Azad Medical College, New Delhi 110002, India
Email: pradeep_dabla@yahoo.com
ORCID: https://orcid.org/0000-0003-1409-6771
Affiliation:
1Amity Institute of Biotechnology, Amity University Rajasthan, Jaipur 303002, India
Email: ddsbms@gmail.com
ORCID: https://orcid.org/0000-0003-2967-8838
Affiliation:
3Department of Cardiology, G.B. Pant Institute of Postgraduate Medical Education & Research, Associated Maulana Azad Medical College, New Delhi 110002, India
Explor Med. 2023;4:336–342 DOI: https://doi.org/10.37349/emed.2023.00145
Received: December 02, 2022 Accepted: February 17, 2023 Published: June 28, 2023
Academic Editor: Kathleen G. Morgan, Boston University School of Medicine, USA
The article belongs to the special issue Exploring Aortic Disease
Aim: Cardiovascular diseases (CVD) are the leading cause of death globally. In the condition of type 2 diabetes mellitus (T2DM), the prevalence of CVD increase parallel with the rise of metabolic complication and higher incidence of coronary artery stenosis. The aim of this study was to compare the level of percent stenosis in coronary arteries in patients with coronary artery disease (CAD) with and without T2DM, and to measure the severity of CVD using Gensini score (GS) through angiographic data.
Methods: The current study was conducted in tertiary care specialized hospital in Delhi, India. The level of percent stenosis in coronary arteries was compared in patients with CAD with and without T2DM. The patients were divided into two groups: group I included 100 patients with T2DM, and group II included 100 non-diabetic CAD patients who underwent coronary angiography by Judkin’s technique. The severity of CVD was measured by GS through angiographic data. The serum levels of glycated haemoglobin (HbA1c) ≥ 6.5% were considered diabetic.
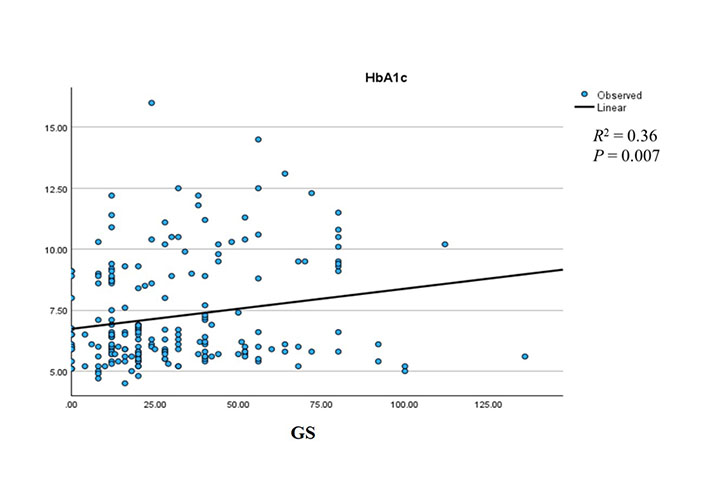
Results: Significant difference was observed in serum HbA1c, and random blood sugar levels between group I and group II were also observed (P ≤ 0.001). Serum HbA1c shows a significant positive association with GS (r = 0.36, P = 0.007).
Conclusions: The study shows a significant level of stenosis in coronary arteries of CAD diabetic patients. However, further prospective analysis of a larger population size will be needed to strengthen the findings and the significant association.
Cardiovascular diseases (CVD) are the leading cause of death, accounting for an estimated 17.5 million deaths annually. It is predicted that the spread of CVD in the population will reach 23.6 million by 2030 [1]. Atherosclerosis, a severe and progressive inflammatory reaction of the blood vessel wall triggered by metabolic illnesses such as diabetes, hypertension, and dyslipidemia, is a significant risk factor for CVD [2]. Type 2 diabetes mellitus (T2DM) patients are more prone to acute vascular events and cardiac death compared to non-T2DM patients [3]. Studies suggest that diabetic patients show extensive pathological complications compared to non-diabetic coronary artery disease (CAD) patients, characterized by calcified, hardened, diffuse, multivessel disease, and a high plaque burden [4]. Therefore, T2DM patients need additional assessment of coronary lesions, revascularization, and optimal medical therapy to control angina. Coronary angiographic studies show that T2DM patients have a higher incidence of the left main stem and multivessel disease, distal disease with severe plaque burden, and limited collateral formation [5]. However, it is not clear if glycemic management impacts the link between poor endothelial function and the degree of CAD in T2DM patients.
This study focuses on the association between angiographic coronary artery stenosis patterns in different coronary arteries and its severity in diabetic and non-diabetic CAD patients based on their glycemic control.
This hospital-based cross-sectional study was performed at the Departments of Biochemistry and Cardiology, G.B. Pant Institute of Postgraduate Medical Education & Research, Delhi, India. A total of 200 age and sex-matched properly consented angiographically proven patients with diagnosed CAD were enrolled. Among them 100 were diagnosed with diabetes and were assigned to group I; the rest 100 were non-diabetic CAD patients and were assigned to group II.
We collected 5mL of venous blood sample from consented patients and divided 3mL in an ethylene diamine tetra acetic acid (EDTA) vial for the analysis of serum glycated haemoglobin (HbA1c), while the remaining sample was transferred to a glucose vial for blood sugar analysis. The level of HbA1c was taken as a serum biomarker for diabetes where HbA1c levels more than 6.5% were considered as diabetes and less than 6.5% as non-diabetic [6]. In all recruited patients, coronary angiography studies were performed using Judkin’s technique [7] to study angiography patterns. The left coronary artery was separated into left anterior descending (LAD), circumflex, and obtuse marginal branches, while the right coronary artery (RCA) was considered a single artery [8]. The patients were separated into three subgroups based on the results of the angiography: single, double, and triple vessel disease (disease defined by obstruction of 50% or more) [9].
The severity of CAD was calculated using the Gensini score (GS) system, which is based on angiographic data from the cathlab. Independent senior cardiologists used the GS assessment to grade the severity of CAD. The coronary artery lesion site and degree of stenosis were scored as follows: 1 point for 25% narrowing, 2 points for 26–50% narrowing, 4 points for 51–75% narrowing, 8 points for 76–90% narrowing, 16 points for 91–99% narrowing, and 32 points for total occlusion. The score for each lesion was then multiplied by a factor that took into account the significance of the lesion’s location in the coronary circulation, as follows: 5 for left main coronary artery (LMCA), 2.5 for proximal LAD coronary artery and proximal left circumflex artery (LCX), 1.5 for mid LAD, 1 for RCA, distal segment of LAD, posterolateral artery, and obtuse marginal (OM) artery, and 0.5 for other segments. The final GS was determined by adding the scores from each coronary segment [10].
The Statistical Package for Social Sciences (SPSS) version 22, IBM Corp., Chicago, USA, was used to analyse the data. The mean, standard deviation (SD), frequency, and percentage were used to express quantitative and qualitative data, respectively. For quantitative data, the student t test and Mann-Whitney U test were used for the analysis. Chi-square test was applied to access the difference within the group. Spearman’s correlation was performed to find the correlation between variables. All statistical tests were carried out at a P < 0.05 significance level.
The demographic and biochemical profile and severity of CAD patients are presented in Table 1. The mean age of group I (CAD patients with T2DM) and group II (CAD patients without T2DM) was 54.19 ± 10.15 and 53.15 ± 10.36, respectively (P value = 0.50). The gender distribution was 81% male and 19% female in group I, and 89% male and 11% female in the control group. The mean HbA1c and random blood sugar (RBS) were 8.83 ± 2.03 and 220.63 ± 100.26 in group I, and 5.66 ± 0.38 and 120.61 ± 42.52 in group II, respectively, with a highly significant difference (* P < 0.001). The GS was higher in group I (31.98 ± 24.13), but the difference was not significant compared to group II (30.22 ± 25.53).
Baseline demographic and biochemical profile and severity of CAD patients
| Serial number (S. No.) | Demographic variables | Group I | Group II | P value |
|---|---|---|---|---|
| 1 | Age (mean ± SD) | 54.19 ± 10.15 | 53.15 ± 10.36 | 0.504 |
| 2 | Male | 81 (81%) | 89 (89%) | 0.082 |
| 3 | Female | 19 (19%) | 11 (11%) | |
| 4 | HbA1c (mean ± SD) | 8.83 ± 2.03 | 5.66 ± 0.38 | < 0.001* |
| 5 | RBS (mean ± SD) | 220.63 ± 100.26 | 120.61 ± 42.52 | < 0.001* |
| 6 | GS (mean ± SD) | 31.98 ± 24.13 | 30.22 ± 25.53 | 0.476 |
* P < 0.001
According to angiographic implication, CAD patients CAD patients were divided into three groups, which are patients with single vessel disease, patients with double vessel disease, and patient with triple vessel disease. In group I, 57 (57%) patients were with single vessel disease, 27 (27%) patients were with double vessel disease, and 8 (8%) patients were with triple vessel disease. However, in group II, 35 (35%) patients were with single vessel disease, 36 (36%) patients were with double vessel disease, and 15 (15%) were with triple vessel disease. Apart from this in group I, 8 (8%) and group II, 14 (14%) represent normal angiograms (Table 2).
Distribution of single, double, and triple vessel disease in group I and group II
| Angiography study | Group I | Group II |
|---|---|---|
| Single vessel disease | 57 (57%) | 35 (35%) |
| Double vessel disease | 27 (27%) | 36 (36%) |
| Triple vessel disease | 8 (8%) | 15 (15%) |
| Normal angiography | 8 (8%) | 14 (14%) |
The stenosis patterns in various arteries supplying blood to the heart are presented in Table 3. The stenosis in LAD artery was 90.51 ± 8.51 in group I and 87.85 ± 12.31 in group II, while in LCX, the stenosis was 90.19 ± 8.08 in group I and 82.22 ± 22.33 in group II. In RCA, the stenosis in group I was 89.26 ± 12.90 and 90.32 ± 10.15 in group II. The difference in stenosis between LAD, RCA, and LCX in both groups was found to be non-significant.
Difference of stenosis in coronary arteries between group I and group II
| Stenosis pattern | Group I | Group II | P value |
|---|---|---|---|
| LAD | 90.51 ± 8.51 | 87.85 ± 12.31 | 0.57 |
| LCX | 90.19 ± 8.08 | 82.22 ± 22.33 | 0.23 |
| RCA | 89.26 ± 12.90 | 90.32± 10.15 | 0.73 |
In Table 4, the Spearman’s correlation coefficient was observed for HbA1c to percent stenosis of coronary arteries (LCX, LAD, and RCA) and GS. It reveals that serum HbA1c showed a positive correlation with GS (r = 0.151, P < 0.001). Further, we also observed the logistic regression between HbA1c and GS which shows a significant positive association (R2 = 0.36, P = 0.007, Figure 1).
The Spearman’s correlation between HbA1c and stenosis of coronary arteries and GS
| Parameters | r | P value | |
|---|---|---|---|
| HbA1c | LAD | 0.119 | 0.12 |
| LCX | –0.003 | 0.98 | |
| RCA | 0.054 | 0.62 | |
| GS | 0.151 | < 0.001* | |
* P < 0.001
In T2DM patients, CVD is a major cause of morbidity and mortality [11]. Obesity, hypertension, and dyslipidemia are common risk factors for CVD and diabetes. Additionally, oxidative stress and endothelial dysfunction are often reported in diabetic patients and might play a direct role in atherosclerosis and CVD development [12].
In this current cross-sectional study, we found a significant difference of diabetic specific parameters (random blood sugar and serum HbA1c level) between diabetic vs. non-diabetic CAD patients (Table 1). Similar types of results have been revealed in a study by Ghazanfari et al. [13], which suggested that fasting blood glucose is a significant contributor to HbA1c in T2DM patients. These findings suggest that these parameters can be of help to healthcare providers to set a goal of plasma glucose testing with specific HbA1c values. Similarly, Nicholas et al. [14] in 2013 suggested that less than 6.5% or more than 9.0% levels of HbA1c might be significantly associated with higher mortality in clinically T2DM patients.
We distribute the single, double, and triple vessel disease patients in group I and group II (Table 2). Similarly, Hegde et al. [15] suggested that diabetic patients are very much prone to multi-vessel disease. Ezhumalai and Jayaraman [16] revealed the higher prevalence of double and triple vessel disease in elderly patients. An observational study conducted by Dave et al. [17] found a non-significant variation in the proportion of single, double, and triple vessel disease among female CAD patients.
We compare the percent stenosis in LAD, LCX, and RCA coronary arteries between both groups and found the difference was non-significant (Table 3). Wu and Wang [18] revealed that most of the diabetic patients diagnosed stenosis in LCX, followed by LAD artery and RCA respectively. However, in non-diabetic patients, the stenosis in LAD artery was more prevalent. Chu et al. [19] compared the characteristics of CAD in diabetic patients by using computed tomography angiography. Their findings revealed that individuals who had both CAD and T2DM had a greater amount of calcified plaque in the LAD artery, which was the primary cause of obstructive stenosis.
We observed positive significant correlations between Spearman’s correlation between HbA1c with stenosis in coronary arteries (Table 4). These results are strongly supported by recent studies conducted [20, 21].
Our study shows that CAD patients with diabetes tend to have more rigorous and diffused and significant levels of atherosclerosis disease compared to non-diabetic ones. However, larger population studies are needed to strengthen such conclusions in further prospective analysis. It is supported that T2DM and CAD are closely related and T2DM is one of the major CAD risk factors. Clinic preventive programs for CAD should include and emphasize clear prevention strategies for T2DM and other associated metabolic risk factors, such as obesity. Thus, including physical exercise and change in lifestyle habits as a daily regimen is required as an important factor for better health. However, the tight regulation of blood glucose levels should be included in the treatment plan of CAD patients to reduce the risk of atherosclerosis and coronary artery stenosis.
CAD: coronary artery disease
CVD: cardiovascular diseases
GS: Gensini score
HbA1c: glycated haemoglobin
LAD: left anterior descending
LCX: left circumflex artery
RCA: right coronary artery
T2DM: type 2 diabetes mellitus
DS, PKD, and DDS: Conceptualization, Methodology, Formal analysis, Validation, Writing—original draft. PKD: Resources, Data curation. VM: Resources, Data curation, Validation.
The authors declare that they have no conflicts of interest.
The study is approved by Institutional ethical committee of Maulana Azad Medical College and associated hospitals, Delhi, India (F1/IEC/MAMC/85/03/21/no.422; Dt-30.08.2021) and complies with the Declaration of Helsinki.
Informed consent to participate in the study was obtained from all participants.
Not applicable.
Not Applicable.
Not applicable.
© The Author(s) 2023.
Copyright: © The Author(s) 2023. This is an Open Access article licensed under a Creative Commons Attribution 4.0 International License (https://creativecommons.org/licenses/by/4.0/), which permits unrestricted use, sharing, adaptation, distribution and reproduction in any medium or format, for any purpose, even commercially, as long as you give appropriate credit to the original author(s) and the source, provide a link to the Creative Commons license, and indicate if changes were made.

Lova Prasadareddy Kajuluri ... Kathleen G Morgan
John V. Tyberg
Anne-Maree Kelly
Korin Karabulut ... James Morgan
Preetha Rajasekaran ... Bashi V. Velayudhan