Original Article

Affiliation:
1Guangxi Key Laboratory of Multimodal Biomarkers and Precision Diagnosis, College of Medical Laboratory and Biotechnology, Guilin Medical University, Guilin 541004, Guangxi, China
2Clinical Laboratory, the First Affiliated Hospital of Guilin Medical University, Guilin 541001, Guangxi, China
Affiliation:
1Guangxi Key Laboratory of Multimodal Biomarkers and Precision Diagnosis, College of Medical Laboratory and Biotechnology, Guilin Medical University, Guilin 541004, Guangxi, China
Email: zliu1111@163.com
ORCID: https://orcid.org/0000-0003-4158-6768
Explor Med. 2026;7:1001414 DOI: https://doi.org/10.37349/emed.2026.1001414
Received: January 12, 2026 Accepted: April 27, 2026 Published: June 12, 2026
Academic Editor: Hua Su, University of California, USA
Aim: Tremor is one of the most common neurological movement disorders, arising from dysfunction in the neuromuscular system. However, comprehensive analyses of peripheral blood elements, red blood cells (RBC) and white blood cells (WBC) counts, as well as liver and kidney function in patients with tremor remain limited. This cross-sectional study investigated alterations in serum elements, complete blood counts, and liver function in patients with tremor. The study sought to identify independent risk factors and evaluate their diagnostic performance.
Methods: Blood samples from 79 patients with tremor and 82 healthy controls were analyzed. Serum elements, RBC, WBC, platelet (PLT), liver function, and renal function were measured using the QL8000 element analyzer, XN 2800 automated hematology analyzer, and Roche Cobas 8000 system.
Results: Serum copper (Cu) and lead (Pb) levels were significantly elevated in tremor patients. These patients also showed increased monocytes, decreased eosinophils, and impaired liver function, including elevated aspartate aminotransferase and globulin with reduced albumin.
Conclusions: Tremor patients show distinct alterations in Cu, Pb, monocyte counts, eosinophil counts, and liver function markers. These findings suggest that these parameters may serve as potential diagnostic indicators and therapeutic targets. Cu and Pb were identified as independent risk factors, and their combination significantly improved diagnostic efficiency.
Tremor is the most common movement disorder, characterized by rhythmic, involuntary muscle contractions that cause shaking, most frequently in the hands [1]. According to the 2018 Consensus Statement on the Classification of Tremors (CS-2018), tremor is defined as “an involuntary, rhythmic, oscillatory movement of a body part” [2]. While hand tremors are the most prevalent, the condition may also involve the arms, legs, head, or vocal cords [3]. Tremor syndromes arise from diverse etiologies, and a single etiology may lead to different clinical subtypes. Neurological disorders such as Parkinson’s disease, Alzheimer’s disease, and other neurodegenerative conditions are well-recognized causes, primarily due to disrupted communication between nerves and muscles [4]. Despite extensive research, treatment remains challenging, and the pathophysiological mechanisms underlying tremor are not fully understood.
Recent studies suggest that alterations in serum element concentrations may play a role in tremor pathogenesis by affecting neuromuscular function. Elements such as calcium (Ca), magnesium (Mg), zinc (Zn), iron (Fe), and copper (Cu) have been shown to influence tremor occurrence [5, 6], as they are essential for neural development and synaptic processes [7]. For example, Mg and Ca regulate neuronal excitability, synaptic vesicle release, and neurotransmitter receptor function [8, 9]. Fe is required for myelination and neurotransmitter synthesis, whereas Cu is involved in neurotransmitter production and antioxidant defense [10, 11]. However, systematic analyses of serum elements and their relationship with other physiological parameters in tremor patients remain limited, and no diagnostic markers for essential tremor (ET) are currently available [12].
In this study, we analyzed blood samples from 79 patients with tremor and 82 healthy controls to evaluate serum concentrations of Cu, Zn, Ca, Mg, Fe, and lead (Pb). In addition, complete blood count (CBC), liver function, and renal function were assessed. This comprehensive approach aims to clarify the potential contributions of altered element levels and physiological markers to tremor pathogenesis, and to identify possible diagnostic indicators or therapeutic targets.
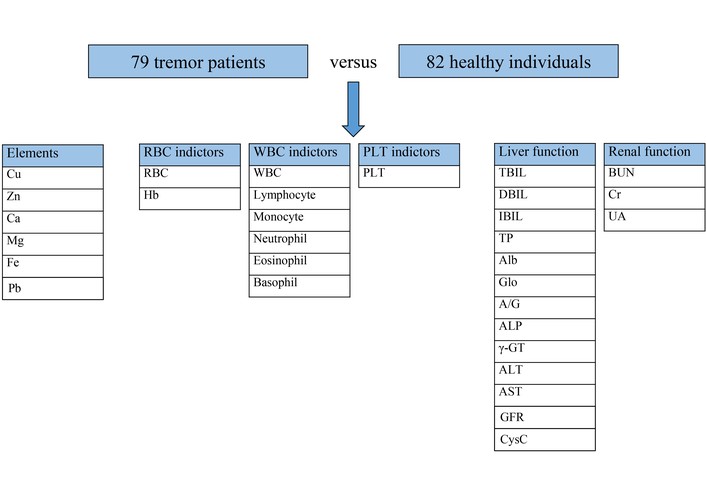
A total of 79 tremor patients were enrolled from the Department of Neurology at the First Affiliated Hospital of Guilin Medical University between January 2021 and January 2025. The inclusion criteria were as follows: (1) age ≥ 18 years; (2) clinical diagnosis of tremor confirmed by a neurologist; (3) first-time diagnosis of ET with unilateral or bilateral tremor of undetermined significance; (4) absence of other neurological signs; (5) symptom duration exceeding 3 years; (6) no use of tremor-suppressing medications. The exclusion criteria were as follows: (1) sudden onset or rapid disease progression (defined as only one or two tremor episodes occurring more than one month apart); (2) presence of significant brain lesions that could cause tremor or mood disturbances; (3) past history of psychosis; (4) adverse drug reactions; (5) definite diagnosis of Parkinson’s disease or drug-induced tremor; (6) diagnosis of Wilson’s disease or other conditions that may affect serum biomarkers. Inclusion criteria for healthy controls: (1) no history of tremor or any movement disorder; (2) no diagnosed neurological disorders (e.g., Parkinson’s disease, Wilson’s disease, ET); (3) no chronic diseases known to affect serum biomarkers (e.g., liver disease, kidney disease, diabetes mellitus, hypertension); (4) no use of medications that may influence tremor or serum metal levels (e.g., dopamine antagonists, beta-blockers, chelating agents); (5) no occupational or environmental exposure to heavy metals (e.g., smelting, battery manufacturing, welding) within the past year; (6) age- and sex-matched to the patient group. The diagnosis was based on a review of their medical history, symptoms, and a physical examination, in accordance with the Consensus Statement on the Classification of Tremors 2018 [13]. A control group of 82 healthy individuals, matched for age and gender with the patients, was also included. Figure 1 describes the experimental design of this study.
This study analyzed 79 tremor patients and 82 healthy individuals, comparing alterations in serum elements, red blood cells (RBC) indicators, white blood cells (WBC) indicators, platelet (PLT) indicators, as well as liver and renal function.
All blood samples were collected after an overnight fast of at least 8 hours, and the blood collection time was controlled within 60 seconds. Venous blood samples (5 mL) were collected from all subjects after fasting. These samples were drawn into evacuated blood collection tubes containing heparin. The serum elements, including Zn, Ca, Fe, and Pb, were detected using a QL8000 elements analyzer from Jinan Qili Optoelectronic Technology Co., Ltd, China. Cu and Mg levels were measured using polarography. Biochemical tests for liver and renal function indicators, including total bilirubin (TBIL), direct-reacting bilirubin (DBIL), indirect bilirubin (IBIL), total protein (TP), albumin (Alb), globulin (Glo), Alb/Glo (A/G), alkaline phosphatase (ALP), gamma-glutamyl transferase (γ-GT), alanine aminotransferase (ALT), aspartate aminotransferase (AST), blood urea nitrogen (BUN), creatinine (Cr), uric acid (UA), glomerular filtration rate (GFR), and cystatin C (CysC), were carried out using a Roche Diagnostics Cobas 8000 analyzer and corresponding methods.
A venous blood sample (5 mL) was collected in a vacuum tube containing EDTA-K2. The RBC, hemoglobin (Hb), WBC, lymphocyte, monocyte, neutrophil, eosinophil, basophil, and PLT were analyzed using the XN 2800 automated hematology analyzer from Sysmex Corporation. Hematocrit (HCT) was analyzed and measured using pulse signals. The red cell distribution width standard deviation (RDW-SD) and coefficient of variation (RDW-CV) were analyzed based on histograms. Mean corpuscular volume (MCV), mean corpuscular Hb (MCH), mean corpuscular Hb concentration (MCHC), PLT distribution width (PDW), mean PLT volume (MPV), and PLT HCT (PCT) were calculated.
Categorical variables were presented as frequencies. Continuous variables were expressed as mean ± SD or median (interquartile range, IQR) based on the results of the Shapiro-Wilk normality test. For data following a normal distribution, mean ± SD was used, and differences between groups were compared using the t-test, with t-values and P-values reported. For data not following a normal distribution, median (IQR) was used, and intergroup differences were compared using the Mann-Whitney U test. Univariate logistic regression analysis was performed. Variables with P < 0.05 and a low proportion of missing values were then selected to explore independent risk factors (multivariate logistic regression). Receiver operating characteristic (ROC) analysis was performed using the rms and pROC packages, and visualization was conducted using the ggplot2 package. Differences were considered statistically significant at P < 0.05. All statistical analyses were performed using SPSS version 20.0 (SPSS Inc., Chicago, IL, USA) and R (Version 4.5.3).
During the study period, 79 patients with tremor and 82 healthy individuals were registered. The average age of the tremor patients was 42.99 ± 18.20 years, while the average age of the healthy individuals was 38.87 ± 14.65 years. Among the tremor patients, 37 were female, and among the healthy individuals, 39 were female (Table 1). There were no significant differences in demographic characteristics between the tremor patients and the healthy controls (P > 0.05).
Characteristics of the participant.
| Variable | Tremor (N = 79) | Healthy control (N = 82) | P-Value |
|---|---|---|---|
| Ages | 42.99 ± 18.20 | 38.87 ± 14.65 | 0.104 |
| Sex, N | 0.927 | ||
| Male | 42 | 43 | |
| Females | 37 | 39 | |
| Diagnostic subtype, N | - | ||
| Essential tremor (ET) | 28 | - | |
| Tremor of undetermined significance | 51 | - | |
As shown in Table 2, the levels of Cu (16.41 µmol/L vs. 10.59 µmol/L, P < 0.001) and Pb (23.01 µg/L vs. 14.86 µg/L, P < 0.001) are significantly increased in patients with tremor. The levels of Zn and Fe in patients with tremor are higher than those in healthy individuals, while Mg is lower than in healthy individuals (P > 0.05).
Comparison of elements between tremor patients and healthy controls.
| Feature | Tremor/N | Healthy control/N | Z | P-Value | Reference range |
|---|---|---|---|---|---|
| Cu, µmol/L | 16.41 (10.69, 24.29)/79 | 10.59 (9.93, 12.40)/82 | 5.375 | < 0.001 | 9–29 |
| Zn, µmol/L | 120.10 (80.66, 125.78)/78 | 119.50 (77.75, 126.40)/82 | 0.222 | 0.824 | 38–165 |
| Ca, µmol/L | 1.24 (1.14, 1.33)/78 | 1.24 (1.12, 1.39)/82 | –0.746 | 0.456 | 1.05–1.80 |
| Mg, µmol/L | 1.21 (0.88, 1.34)/79 | 1.24 (1.12, 1.36)/82 | –1.882 | 0.060 | 0.75–1.90 |
| Fe, µmol/L | 9.42 (7.64, 10.75)/78 | 8.79 (7.35, 10.08)/82 | 1.166 | 0.244 | 6.0–12 |
| Pb, µg/L | 23.01 (13.43, 41.12)/78 | 14.86 (11.60, 20.56)/82 | 4.172 | < 0.001 | 0–100 |
Note: N refers to the number of participants who completed this test.
As shown in Table 3, the levels of monocytes (0.49 × 10⁹/L vs. 0.37 × 10⁹/L, P < 0.001) are significantly increased in patients with tremor, while eosinophils (0.11 × 10⁹/L vs. 0.17 × 10⁹/L, P = 0.023) and PDW (10.15 fL vs. 16.00 fL, P < 0.001) are significantly decreased. The RBC, RDW-SD, and MPV levels in patients with tremor were higher than those in healthy individuals, while the levels of Hb, HCT, MCV, MCH, MCHC, WBC, lymphocyte, neutrophil, PLT, and PCT are lower (P > 0.05).
Comparison of CBC between tremor patients and healthy controls.
| Feature | Tremor/N = 51 | Healthy control/N = 80 | Z | P-Value | Reference range |
|---|---|---|---|---|---|
| RBC indicators | |||||
| RBC (× 1012/L) | 4.98 (4.57, 5.33) | 4.89 (4.59, 5.43) | –0.224 | 0.823 | 4–5.5 |
| Hb (g/L) | 143.00 (128.00, 156.00) | 144.00 (134.00, 158.00) | –0.840 | 0.401 | 130–175 |
| HCT | 0.43 (0.40, 0.47) | 0.44 (0.42, 0.48) | –1.008 | 0.314 | 0.4–0.54 |
| MCV (fL) | 89.20 (86.00, 92.30) | 90.20 (88.30, 92.85) | –1.407 | 0.159 | 82–94 |
| MCH (pg) | 29.60 (27.90, 30.80) | 29.80 (28.70, 30.80) | –0.791 | 0.429 | 27–32 |
| MCHC (g/L) | 326.00 (321.00, 335.00) | 329.00 (323.25, 332.75) | –0.269 | 0.788 | 320–360 |
| RDW-SD (fL) | 41.80 (39.60, 44.30) | 41.05 (39.45, 42.70) | 1.076 | 0.282 | 37–54 |
| RDW-CV | 0.13 (0.12, 0.13) | 0.13 (0.13, 0.13) | –1.267 | 0.205 | 0.11–0.16 |
| WBC indicators | |||||
| WBC (× 109/L) | 6.13 (5.46, 7.41) | 6.22 (5.47, 7.38) | –0.437 | 0.662 | 4–10 |
| Lymphocyte (× 109/L) | 1.96 (1.66, 2.40) | 2.10 (1.71, 2.50) | –1.076 | 0.282 | 1–3.7 |
| Monocyte (× 109/L) | 0.49 (0.41, 0.62) | 0.37 (0.28, 0.46) | 4.938 | < 0.001 | 0–0.7 |
| Neutrophil (× 109/L) | 3.39 (2.73, 4.47) | 3.65 (2.92, 4.49) | –0.961 | 0.337 | 1.5–7 |
| Eosinophil (× 109/L) | 0.11 (0.07, 0.23) | 0.17 (0.10, 0.24) | –2.266 | 0.023 | 0–0.4 |
| Basophil (× 109/L) | 0.03 (0.02, 0.04) | 0.03 (0.02, 0.04) | –0.796 | 0.426 | 0–0.1 |
| PLT indicators | |||||
| PLT (× 109/L) | 252.00 (212.00, 289.00) | 264.00 (223.00, 287.00) | –0.810 | 0.418 | 100–300 |
| PDW (fL) | 10.15 (9.08, 11.72) | 16.00 (15.80, 16.28) | –9.574 | < 0.001 | 10–15 |
| MPV (fL) | 9.50 (8.90, 10.23) | 9.40 (8.60, 9.98) | 1.097 | 0.273 | 6–15 |
| PCT | 0.24 (0.20, 0.27) | 0.25 (0.21, 0.27) | –0.404 | 0.686 | 0.11–0.28 |
Note: N refers to the number of participants who completed this test.
As shown in Table 4, the levels of Glo (30.70 g/L vs. 29.30 g/L, P = 0.001) and AST (19.30 U/L vs. 17.60 U/L, P = 0.007) are significantly increased in patients with tremor, while TBIL (9.10 µmol/L vs. 10.45 µmol/L, P = 0.042), IBIL (5.60 µmol/L vs. 6.45 µmol/L, P = 0.044), Alb (44.10 g/L vs. 46.10 g/L, P = 0.001), and A/G (1.41 vs. 1.57, P < 0.001) are significantly decreased. The levels of TP, ALP, ALT, BUN, UA, and CysC are increased, while DBIL, γ-GT, Cr, and GFR are decreased.
Comparison of liver and renal function between tremor patients and healthy controls.
| Feature | Tremor/N | Healthy control/N | Z | P-Value | Reference range |
|---|---|---|---|---|---|
| Liver function | |||||
| TBIL (µmol/L) | 9.10 (5.80, 12.47)/65 | 10.45 (8.00, 13.20)/80 | –2.030 | 0.042 | 0–23 |
| DBIL (µmol/L) | 3.40 (2.68, 4.91)/65 | 3.75 (3.03, 4.90)/80 | –1.372 | 0.170 | 0–8 |
| IBIL (µmol/L) | 5.60 (3.20, 8.28)/65 | 6.45 (4.90, 8.85)/80 | –2.018 | 0.044 | 0–15 |
| TP (g/L) | 74.80 (73.00, 78.10)/65 | 74.75 (72.80, 77.89)/82 | 0.595 | 0.552 | 65–85 |
| Alb (g/L) | 44.10 (41.90, 46.75)/65 | 46.10 (44.08, 47.93)/82 | –3.358 | 0.001 | 40–55 |
| Glo (g/L) | 30.70 (28.60, 33.25)/65 | 29.30 (27.03, 31.40)/82 | 3.415 | 0.001 | 20–40 |
| A/G | 1.41 (1.32, 1.61)/65 | 1.57 (1.46, 1.73)/82 | –4.371 | < 0.001 | 1.2–2.4 |
| ALP (U/L) | 74.80 (62.45, 90.28)/64 | 65.00 (55.00, 80.75)/32 | 1.885 | 0.059 | 45–135 |
| γ-GT (U/L) | 18.00 (14.70, 24.00)/27 | 20.00 (14.00, 25.00)/19 | –0.469 | 0.639 | 0.001–45 |
| ALT (U/L) | 15.30 (11.55, 23.65)/65 | 14.05 (10.38, 23.45)/82 | 0.193 | 0.847 | 0–40 |
| AST (U/L) | 19.30 (16.75, 24.00)/65 | 17.60 (14.40, 21.03)/82 | 2.703 | 0.007 | 0–35 |
| Renal function | |||||
| BUN (µmol/L) | 4.65 (3.78, 5.43)/46 | 4.35 (3.70, 5.33)/82 | 0.432 | 0.432 | 3.2–7.5 |
| Cr (µmol/L) | 71.50 (60.00, 79.00)/46 | 73.00 (60.00, 85.25)/82 | –0.417 | 0.676 | 44–115 |
| UA (µmol/L) | 351.50 (271.00, 394.00)/46 | 335.00 (279.25, 398.25)/80 | –0.109 | 0.913 | 110–420 |
| GFR (mL/min/1.73 m2) | 85.29 (73.88, 100.41)/26 | 91.15 (80.77, 105.13)/12 | –0.895 | 0.376 | 69.22–170.92 |
| CysC (mg/L) | 0.90 (0.80, 1.01)/25 | 0.87 (0.77, 0.96)/12 | 0.730 | 0.471 | 0.51–1.09 |
Note: N refers to the number of participants who completed this test.
As shown in Tables 5 and 6, univariate logistic regression analyses adjusted for age and sex revealed that Cu (OR = 1.256, 95% CI 1.153–1.368, P < 0.001), Pb (OR = 1.065, 95% CI 1.034–1.097, P < 0.001), Glo (OR = 1.240, 95% CI 1.096–1.402, P = 0.001), and AST (OR = 1.068, 95% CI 1.006–1.134, P = 0.030) were risk factors for tremor, whereas monocyte, PDW (OR = 0.068, 95% CI 0.012–0.373, P = 0.002), TBIL (OR = 0.923, 95% CI 0.849–1.003, P = 0.057), IBIL (OR = 0.888, 95% CI 0.794–0.994, P = 0.039), Alb (OR = 0.776, 95% CI 0.669–0.901, P = 0.001), and A/G (OR = 0.010, 95% CI 0.001–0.094, P < 0.001) were protective factors. Subsequent multivariate logistic regression analysis demonstrated that only Cu (OR = 1.206, 95% CI 1.095–1.327, P < 0.001) and Pb (OR = 1.054, 95% CI 1.016–1.093, P = 0.005) were independent risk factors for tremor. As shown in Table 7, there were no differences in laboratory parameters between patients with ET and those with tremor of undetermined significance; therefore, no subgroup analysis was performed based on ET and tremor of undetermined significance. ROC analysis showed that the area under the curve (AUC) for the combination (0.799) of Cu and Pb was larger than that for Cu (0.743) or Pb (0.691) alone (Figure 2).
Univariate logistic regression analysis for potential risk factors.
| Groups | OR (95% CI) | P-Value | OR (95% CI)* | P-Value* |
|---|---|---|---|---|
| Cu | 1.246 (1.147–1.353) | < 0.001 | 1.256 (1.153–1.368) | < 0.001 |
| Pb | 1.066 (1.035–1.098) | < 0.001 | 1.065 (1.034–1.097) | < 0.001 |
| Monocyte | 371.383 (22.997–599.534) | < 0.001 | 529.891 (27.264–10,298.788) | < 0.001 |
| Eosinophil | 0.255 (0.019–3.473) | 0.305 | 0.195 (0.013–3.026) | 0.243 |
| PDW (fL) | 0.071 (0.015–0.331) | 0.001 | 0.068 (0.012–0.373) | 0.002 |
| TBIL | 0.929 (0.861–1.002) | 0.057 | 0.923 (0.849–1.003) | 0.057 |
| IBIL | 0.897 (0.809–0.995) | 0.040 | 0.888 (0.794–0.994) | 0.039 |
| Alb | 0.808 (0.716–0.912) | 0.001 | 0.776 (0.669–0.901) | 0.001 |
| Glo | 1.233 (1.098–1.385) | < 0.001 | 1.240 (1.096–1.402) | 0.001 |
| A/G | 0.021 (0.003–0.139) | < 0.001 | 0.010 (0.001–0.094) | < 0.001 |
| AST | 1.071 (1.011–1.135) | 0.020 | 1.068 (1.006–1.134) | 0.030 |
* Adjusted for age and sex.
Multivariate logistic regression analysis for independent risk factors.
| Groups | OR (95% CI) | P-Value | OR (95% CI)* | P-Value* |
|---|---|---|---|---|
| Cu | 1.221 (1.111–1.341) | < 0.001 | 1.206 (1.095–1.327) | < 0.001 |
| Pb | 1.047 (1.012–1.084) | 0.008 | 1.054 (1.016–1.093) | 0.005 |
| Alb | 0.849 (0.489–1.476) | 0.563 | 0.801 (0.442–1.452) | 0.465 |
| TBIL | 1.237 (0.636–2.405) | 0.531 | 1.177 (0.591–2.341) | 0.643 |
| IBIL | 0.691 (0.283–1.685) | 0.416 | 0.712 (0.284–1.786) | 0.469 |
| Glo | 1.429 (0.617–3.309) | 0.404 | 1.464 (0.606–3.534) | 0.397 |
| A/G | 13.308 (0.001–72,049,940.92) | 0.744 | 9.385 (0.001–98,099,502.09) | 0.786 |
| AST | 1.047 (0.965–1.136) | 0.269 | 1.044 (0.962–1.133) | 0.305 |
* Adjusted for age and sex.
Comparison of laboratory parameters between ET and tremor of undetermined significance.
| Groups | ET | Tremor | t/Z | P-Value* |
|---|---|---|---|---|
| Cu | 16.34 (10.74, 26.91) | 16.41 (10.53 ,23.66) | 765.00 | 0.601 |
| Pb | 21.06 (10.38, 33.89) | 26.85 (15.27, 46.34) | 614.00 | 0.370 |
| Monocyte | 0.49 (0.36, 0.63) | 0.50 (0.43, 0.62) | 264.00 | 0.380 |
| Eosinophil | 0.10 (0.05, 0.23) | 0.11 (0.08, 0.23) | 260.50 | 0.340 |
| PDW (fL) | 11.00 (8.85, 11.78) | 9.95 (9.28, 11.58) | 314.50 | 0.774 |
| TBIL | 9.10 (6.90, 13.70) | 9.10 (5.35, 12.25) | 531.00 | 0.510 |
| IBIL | 6.53 ± 3.34 | 5.83 ± 3.13 | 0.846 | 0.401 |
| Alb | 44.67 ± 2.80 | 44.09 ± 3.46 | 0.688 | 0.494 |
| Glo | 30.50 (27.80, 32.60) | 31.30 (29.23, 34.25) | 394.00 | 0.222 |
| A/G | 1.49 ± 0.22 | 1.41 ± 0.24 | 1.443 | 0.154 |
| AST | 21.60 (19.00, 24.10) | 18.20 (16.05, 24.13) | 603.00 | 0.100 |
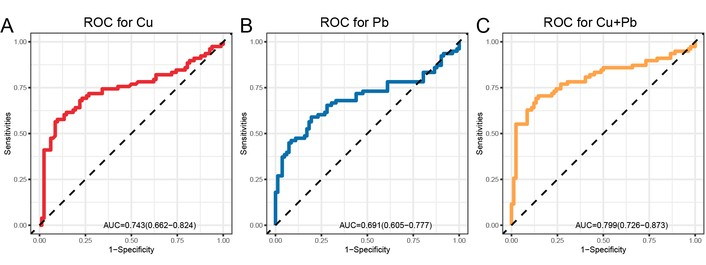
Receiver operating characteristic (ROC) curves of independent risk factors for distinguishing tremor patients from healthy controls. (A) ROC curve of serum copper (Cu), with an area under the curve (AUC) of 0.743; (B) ROC curve of serum lead (Pb), with an AUC of 0.691; (C) ROC curve of the combination of Cu and Pb, with an AUC of 0.799. The combination of Cu and Pb demonstrated improved diagnostic efficiency compared to either marker alone.
This cross-sectional study yielded two main findings. First, Cu and Pb were identified as independent risk factors for both ET and tremor of undetermined significance. Second, no significant differences in laboratory parameters were observed between the two patient groups. However, compared to healthy controls, tremor patients showed significant alterations in several other laboratory parameters, including increased monocytes, decreased eosinophils, decreased PDW, decreased TBIL, decreased IBIL, decreased Alb, increased Glo, decreased A/G, and increased AST. Despite these differences, only Cu and Pb emerged as independent risk factors capable of distinguishing tremor patients from healthy controls in the multivariate analysis. The observed alterations in other laboratory parameters may therefore be influenced by Cu and Pb, a possibility that will be explored further in the following section.
In this study, we found that serum Cu and Pb levels were elevated in tremor patients. Cu is a trace element present in all tissues and is required for cellular respiration, neurotransmitter biosynthesis, and connective tissue strength [14]. Cu is also a cofactor for numerous enzymes and plays an important role in central nervous system development [15]. Tremors can be associated with Cu metabolism disorders. For instance, Wilson’s disease is a genetic disorder that is associated with the accumulation of Cu in the liver and brain, resulting in tremors [16]. Studies have found that Cu accumulation in the basal ganglia could be related to Parkinsonian symptoms [17]. The mechanism of this may involve free radical production, resulting in mitochondrial damage, DNA breakage, and neuronal injury [18]. Pb is a ubiquitous environmental neurotoxicant suspected to be a risk factor for neurological disorders [19]. Patients with tremors had a significant increase in monocytes and a decrease in eosinophils and PDW. Monocytes are a type of WBC that play a crucial role in fighting infections and maintaining the immune response [20]. High levels of monocytes and low levels of eosinophils indicate an ongoing immune response or inflammation [21]. A high monocyte count indicates that the immune system is working to destroy an infection or could be a sign of physical or emotional stress [22]. We speculate that the increase in monocytes in tremor patients is also related to the alteration of serum Cu levels. A study found that a high concentration of Cu was associated with elevated monocyte counts [23]. The mechanism is that increased Cu levels can trigger an inflammatory response in the body, leading to a rise in monocyte count [24].
Our research results indicate an increase in Glo and AST, along with a decrease in TBIL, IBIL, Alb, and A/G, suggesting impaired liver function in tremor patients. Tremors can sometimes be linked to liver function, particularly in cases of a condition called “flapping tremor”. This condition, characterized by involuntary jerking movements of the hands and wrists, is a neurological disorder associated with liver diseases such as cirrhosis or hepatitis [25]. When the liver is impaired and unable to filter toxins efficiently, these toxins can accumulate in the blood and travel to the brain, disrupting brain function and leading to symptoms like tremor [26]. We speculate that high serum Cu and Pb may contribute to liver damage. Many studies have confirmed the association between excessive serum Cu exposure and impairments of liver and renal function [27]. Elevated Cu levels can lead to its deposition in the kidneys, causing nephrotoxicity and resulting in interstitial damage [28]. Pb is a highly poisonous metal that affects almost every organ in the body and interferes with various biological processes [29]. For example, AST and ALT levels have been reported to increase due to chronic exposure to Pb, while the levels of TG, Alb, and Glo decrease [30]. High serum Pb can cause damage to the kidneys, a condition known as Pb-related nephrotoxicity [31].
In conclusion, this study comprehensive analysis of the alterations in serum elements, RBC, WBC, PLT, liver function, and renal function in tremor patients. The findings revealed changes in the levels of serum Cu and Pb, along with monocyte, eosinophil, and liver function indicators. Cu and Pb were identified as independent risk factors for tremor. The underlying causes of these changes need further investigation. Additionally, these findings could provide valuable insights for the prevention, diagnosis, and treatment of tremor.
A/G: albumin/globulin
Alb: albumin
ALP: alkaline phosphatase
ALT: alanine aminotransferase
AST: aspartate aminotransferase
AUC: area under the curve
BUN: blood urea nitrogen
Ca: calcium
CBC: complete blood count
Cr: creatinine
Cu: copper
CysC: cystatin C
DBIL: direct-reacting bilirubin
ET: essential tremor
Fe: iron
GFR: glomerular filtration rate
Glo: globulin
Hb: hemoglobin
HCT: hematocrit
IBIL: indirect bilirubin
IQR: interquartile range
MCH: mean corpuscular hemoglobin
MCHC: mean corpuscular hemoglobin concentration
MCV: mean corpuscular volume
Mg: magnesium
MPV: mean platelet volume
Pb: lead
PCT: platelet hematocrit
PDW: platelet distribution width
PLT: platelet
RBC: red blood cells
RDW-CV: red cell distribution width coefficient of variation
RDW-SD: red cell distribution width standard deviation
ROC: receiver operating characteristic
TBIL: total bilirubin
TP: total protein
UA: uric acid
WBC: white blood cells
Zn: zinc
γ-GT: gamma-glutamyl transferase
YJZ: Conceptualization, Investigation, Methodology, Writing—original draft, Formal analysis, Visualization. MC: Investigation, Data curation, Writing—original draft. XHH: Investigation, Writing—original draft. SEL: Investigation, Writing—original draft. ZL: Conceptualization, Investigation, Writing—original draft, Writing—review & editing, Supervision, Funding acquisition. All authors read and approved the submitted version.
The authors declare that they have no conflicts of interest.
This study was performed in line with the principles of the Declaration of Helsinki (Version 2024). Approval was granted by the Ethics Committee of Guilin Medical University (No. GYLL2022009).
Written informed consent was obtained from all individual participants after explaining the goals of the study.
Not applicable.
The datasets used and/or analysed during the current study are available from the corresponding author on reasonable request.
The study was supported by the National Natural Science Foundation of China (No. 32260175) and the Guangxi Key Laboratory Capacity Building Project (Guike LT2600640059). The funders had no role in study design, data collection and analysis, decision to publish, or preparation of the manuscript.
© The Author(s) 2026.
Open Exploration maintains a neutral stance on jurisdictional claims in published institutional affiliations and maps. All opinions expressed in this article are the personal views of the author(s) and do not represent the stance of the editorial team or the publisher.
Copyright: © The Author(s) 2026. This is an Open Access article licensed under a Creative Commons Attribution 4.0 International License (https://creativecommons.org/licenses/by/4.0/), which permits unrestricted use, sharing, adaptation, distribution and reproduction in any medium or format, for any purpose, even commercially, as long as you give appropriate credit to the original author(s) and the source, provide a link to the Creative Commons license, and indicate if changes were made.

View: 938
Download: 20
Times Cited: 0