 Original Article


Affiliation:
1Shanxi Medical University, Taiyuan 030001, Shanxi Province, China
2Department of Rheumatology, Second Hospital of Shanxi Medical University, Taiyuan 030001, Shanxi Province, China
3Key Laboratory of Cellular Physiology, Shanxi Medical University, Ministry of Education, Taiyuan 030001, Shanxi Province, China
4Shanxi Provincial Key Laboratory, Rheumatism Immune Microecology, Taiyuan 030001, Shanxi Province, China
ORCID: https://orcid.org/0009-0003-5158-6806

 ,
,
Affiliation:
1Shanxi Medical University, Taiyuan 030001, Shanxi Province, China
3Key Laboratory of Cellular Physiology, Shanxi Medical University, Ministry of Education, Taiyuan 030001, Shanxi Province, China
4Shanxi Provincial Key Laboratory, Rheumatism Immune Microecology, Taiyuan 030001, Shanxi Province, China
Affiliation:
1Shanxi Medical University, Taiyuan 030001, Shanxi Province, China
3Key Laboratory of Cellular Physiology, Shanxi Medical University, Ministry of Education, Taiyuan 030001, Shanxi Province, China
4Shanxi Provincial Key Laboratory, Rheumatism Immune Microecology, Taiyuan 030001, Shanxi Province, China
ORCID: https://orcid.org/0009-0005-1758-705X
,
Affiliation:
2Department of Rheumatology, Second Hospital of Shanxi Medical University, Taiyuan 030001, Shanxi Province, China
3Key Laboratory of Cellular Physiology, Shanxi Medical University, Ministry of Education, Taiyuan 030001, Shanxi Province, China
4Shanxi Provincial Key Laboratory, Rheumatism Immune Microecology, Taiyuan 030001, Shanxi Province, China
Affiliation:
2Department of Rheumatology, Second Hospital of Shanxi Medical University, Taiyuan 030001, Shanxi Province, China
3Key Laboratory of Cellular Physiology, Shanxi Medical University, Ministry of Education, Taiyuan 030001, Shanxi Province, China
4Shanxi Provincial Key Laboratory, Rheumatism Immune Microecology, Taiyuan 030001, Shanxi Province, China
Affiliation:
5SXMU-Tsinghua Collaborative Innovation Center for Frontier Medicine, Shanxi Medical University, Taiyuan 030001, Shanxi Province, China
6School of Pharmacy, Shanxi Medical University, Taiyuan 030001, Shanxi Province, China
Affiliation:
3Key Laboratory of Cellular Physiology, Shanxi Medical University, Ministry of Education, Taiyuan 030001, Shanxi Province, China
7School of Pharmacy and Second Clinical Medical College, Shanxi Medical University, Taiyuan 030001, Shanxi Province, China
Affiliation:
2Department of Rheumatology, Second Hospital of Shanxi Medical University, Taiyuan 030001, Shanxi Province, China
4Shanxi Provincial Key Laboratory, Rheumatism Immune Microecology, Taiyuan 030001, Shanxi Province, China
Email: sunshine5670@hotmail.com
 ,
,
Affiliation:
2Department of Rheumatology, Second Hospital of Shanxi Medical University, Taiyuan 030001, Shanxi Province, China
3Key Laboratory of Cellular Physiology, Shanxi Medical University, Ministry of Education, Taiyuan 030001, Shanxi Province, China
4Shanxi Provincial Key Laboratory, Rheumatism Immune Microecology, Taiyuan 030001, Shanxi Province, China
5SXMU-Tsinghua Collaborative Innovation Center for Frontier Medicine, Shanxi Medical University, Taiyuan 030001, Shanxi Province, China
Email: zhangshengxiao1@sxmu.edu.cn
ORCID: https://orcid.org/0000-0003-1341-7588
Explor Med. 2026;7:1001406 DOI: https://doi.org/10.37349/emed.2026.1001406
Received: January 10, 2026 Accepted: May 09, 2026 Published: May 28, 2026
Academic Editor: Apostolos Zaravinos, European University Cyprus, Cyprus
Aim: Adult-onset Still’s disease (AOSD) is a rare systemic inflammatory disorder marked by fever, rash, joint pain, and hyperferritinemia. While immune dysregulation is implicated in AOSD, the exact causal mechanisms remain unclear. This study aimed to investigate the genetic causal relationship between 731 immune cell phenotypes and AOSD, and to identify protective or risk-associated profiles.
Methods: Using a two-sample Mendelian randomization (TSMR) approach, we applied inverse variance weighted (IVW) as the primary method, supplemented by MR-Egger, weighted median, simple mode, and weighted mode methods for robustness. Genetic instrumental variables for immune traits were sourced from recent genome-wide association studies (GWAS), and AOSD genetic predispositions were derived from the finn-b-STILL_ADULT cohort, comprising 201,947 individuals of European ancestry (3,403 AOSD cases and 198,544 controls).
Results: We identified 49 immune cell-related traits showing nominally significant associations with AOSD (all adjusted P > 0.05 after FDR correction). Among these, 34 traits showed nominally protective trends, while 15 showed nominally risk-associated trends. Reciprocally, AOSD showed nominally suggestive effects on 40 immune cell traits, with 25 exhibiting a trend toward decreased levels and 15 toward increased levels. Additionally, we conducted multiple sensitivity analyses to explore potential heterogeneity and pleiotropy, though the primary findings did not survive FDR correction.
Conclusions: These nominally significant associations between immune cell traits and AOSD, though not surviving FDR correction, may offer hypothesis-generating insights for future therapeutic research. The observed directional trends—with certain traits showing nominally protective or risk-associated patterns—suggest potential avenues for further exploration in the development of targeted treatment approaches for AOSD.
Adult-onset Still’s disease (AOSD) is a rare systemic inflammatory disorder characterized by symptoms such as arthritis, spiking fever, skin rash, and elevated ferritin levels [1, 2]. AOSD is a rare systemic inflammatory disorder with an estimated annual incidence of approximately 0.16 to 0.62 cases per 100,000 population. It most commonly affects young adults, with a peak age of onset between 16 and 35 years, and shows a slight female predominance [3, 4]. Its rarity and the limited availability of therapeutic options present challenges in diagnosis and treatment [1], primarily impacting young individuals and leading to multi-organ involvement along with potentially life-threatening complications [5]. Current solutions for the disease include biologics, such as IL-1 inhibitors and anti-TNF, yet the unclear etiology and complex clinical manifestations of AOSD persist as significant challenges for its diagnosis and cure [6].
AOSD is recognized at the intersection of innate immunity and autoimmunity, highlighting its significant relationship with immune cells [7]. Previous studies have suggested that immune cells play a role in the pathogenesis of AOSD [8]. Factors such as immune abnormalities, germ infection, or gene inheritance are considered possible causes, with HLA-DR4 being widely acknowledged in the development and progression of AOSD, which is related to inflammatory responses [1]. The expression of CD64, CD11b, and CD32 on peripheral blood monocytes is upregulated in patients with AOSD [9, 10]. Additionally, the proportion of CD8+ naive T cells in the whole blood of AOSD patients is higher than that in healthy individuals, and the proportions of various T cell subsets are significantly correlated with systemic scores in peripheral blood [11]. There are also reports indicating that the levels of CD4+ CD25high regulatory T cells (Tregs) in the circulation of patients with active AOSD are significantly lower than those in healthy individuals, with negative correlations between Treg cell levels and disease activity scores or inflammatory markers, suggesting an anti-inflammatory and suppressive role in the pathogenesis of AOSD [12]. These findings collectively indicate the importance of immune cells in the incidence and development of AOSD.
Mendelian randomization (MR) is robust in exploring the relationship between traits and disease in many research areas, like the gut microbiome and BCC, melanoma skin cancer, and ease of skin tanning [13]. Another study also utilizes MR to test the causal relationship between gut microbiota along with specific immune cells and hypertrophic scarring risk, whose result demonstrates the positive and reverse causality between 5 genera on hypertrophic scar [13]. All of these contribute to the credibility of MR and inspire us to adopt MR to analyze the relationship between immune cells and AOSD.
Despite accumulating evidence suggesting associations between various immune cell subsets and AOSD, the causal nature of these associations remains unclear. Previous observational studies are limited by potential confounding, reverse causation, and small sample sizes. Furthermore, whether immune cell abnormalities are a cause or a consequence of AOSD has not been established. To address these gaps, we performed a bidirectional MR analysis using large-scale genome-wide association studies (GWAS) data to systematically investigate the causal relationships between 731 immune cell phenotypes and AOSD [14]. This approach allows us to infer causality while minimizing biases inherent in observational studies.
The decision to include all 731 immune cell phenotypes in a MR study is based on the comprehensiveness of the available data and the principle of a non-biased, systematic approach. This GWAS analyzed genomic data from 3,757 European individuals and included relative cell counts (RC) (n = 192), absolute cell counts (AC) (n = 118), morphological parameters (MP) (n = 32), and median fluorescence intensity (MFI) (n = 389) [15]. For the AOSD data (finn-b-STILL_ADULT), by doing so, we can systematically identify associations between genetic variants and approximately immune phenotypes.
Our MR study was executed with strict adherence to the STROBE-MR guidelines [16], focusing on the causal relationship between 731 immune cell traits and AOSD using two-sample MR analyses. We also utilized reverse MR to examine the potential causality from the disease to the immune cell traits. MR uses genetic variants as instrumental variables (IVs) to address potential confounding and reverse causality issues [17]. Ensuring the robustness of the analysis relies on three key assumptions: 1) the genetic variants are strongly associated with the exposure, 2) the genetic variants are not associated with potential confounders, and 3) the genetic variants affect the outcome only through the exposure [18] (Figure 1).
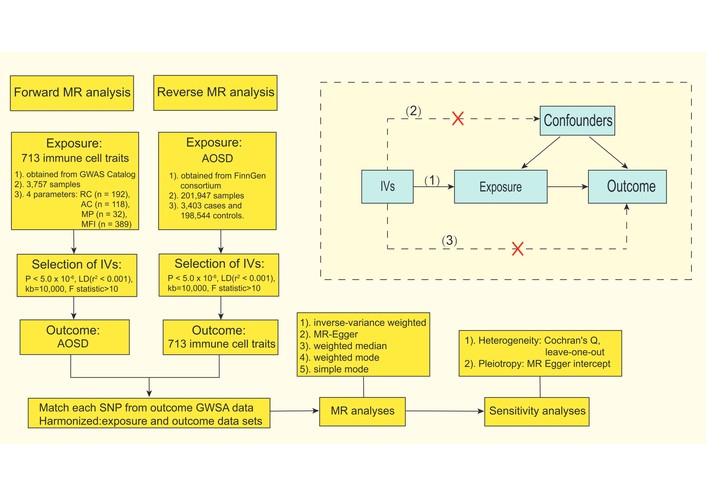
Flowchart and principal assumptions of the bidirectional MR study. The three key assumptions for valid IVs are: (1) relevance: genetic variants (SNPs) are strongly associated with the exposure; (2) independence: genetic variants are not associated with potential confounders; and (3) exclusion restriction: genetic variants affect the outcome only through the exposure (no direct effect or pleiotropic pathways). AOSD: adult-onset Still’s disease; MR: Mendelian randomization; AC: absolute cell counts; RC: relative cell counts; MFI: median fluorescence intensity; MP: morphological parameters; GWAS: genome-wide association studies; IVs: instrumental variables; LD: linkage disequilibrium; SNPs: single nucleotide polymorphisms.
For the 731 immune cell traits, we sourced GWAS summary statistics from the GWAS Catalog (identifiers ranging from GCST90001391 to GCST90002121), accessible through the IEU open GWAS project (https://gwas.mrcieu.ac.uk/). The GWAS data encompassed 3,757 European individuals and included RC (n = 192), AC (n = 118), MP (n = 32), and MFI (n = 389) [15]. For the AOSD data (finn-b-STILL_ADULT), we accessed the GWAS summary statistics from the FinnGen consortium R10 release in 2023 (https://r10.finngen.fi/). The dataset included 201,947 European individuals, with 3,403 cases and 198,544 controls. The FinnGen R10 release (2023) was used in this study, as it was the most recent version available at the time of analysis.
Although the conventional genome-wide significance threshold is P < 5 × 10⁻⁸, applying this threshold in our study resulted in an insufficient number of IVs for most immune cell traits. Hence, we adopted a relaxed threshold of P < 5 × 10⁻⁶, consistent with prior MR studies investigating immune phenotypes [19, 20]. The linkage disequilibrium (LD) threshold was defined with an r2 of 0.001 and a physical distance of 10,000 kb, determined using RStudio (v.4.4.3) [21]. Palindromic single nucleotide polymorphisms (SNPs) were excluded to minimize bias. The F statistic, with a condition of F > 10, was used to ensure the selection of strong IVs.
The immune cell phenotypes used in the reverse MR analysis were derived from publicly available GWAS summary statistics, in which all traits were standardized to a mean of 0 and a standard deviation (SD) of 1. Accordingly, all causal effect estimates are reported as beta coefficients, representing the change in the outcome variable per one SD increase in each immune cell trait. Beta coefficients were used as the effect measure because they provide a standardized, interpretable, and widely adopted metric for comparing causal effects across traits in MR studies. For transparency, 95% confidence intervals (CIs) for all beta coefficients are presented in forest plots.
The inverse variance weighted (IVW) method served as the primary analysis to assess the causal link between immune cell traits and AOSD, factoring in the precision of individual effect size estimates. Supplementary analyses included MR-Egger, weighted median, and weighted mode methods to ensure robustness [22, 23]. Statistical significance was set at P < 0.05.
Heterogeneity was assessed using Cochran’s Q test with IVW and MR-Egger methods, and funnel plots were inspected for signs of heterogeneity. Horizontal pleiotropy was evaluated through the MR-Egger intercept, with a P-intercept value less than 0.05 indicating its presence. Leave-one-out analysis was performed to ensure no single SNP had an undue influence on the overall effect.
All analyses were conducted using RStudio (v.4.4.3) (https://www.Rproject.org), with the MR analysis facilitated by the ‘TwoSampleMR’ package (version 0.5.11).
The selection of IVs for our genetic exposure prediction was stringent, adhering to the criteria of genome-wide significance with a P-value threshold of less than 5 × 10⁻⁶ and an F-statistic greater than 10, indicating robust instruments. The SNPs used in our forward MR analysis numbered from 4 to 18, while those for the reverse MR analysis ranged from 16 to 18. Detailed SNP data are available in Table S1 and Table S2.
Our two-sample MR analysis, utilizing the IVW method as our primary analytical approach, identified a total of 49 immune cell traits that showed nominally significant associations with AOSD (all adjusted P > 0.05 after FDR correction). Of these, 34 exhibited nominally protective trends, with odds ratios (OR) suggesting reduced risk for AOSD at the nominal level. For instance, the presence of FSC-A on CD4+ T cells showed an OR of 0.774 (95% CI: 0.629 to 0.954, nominal P = 0.016), and CD4 on HLA-DR+ CD4+ T cells had an OR of 0.824 (95% CI: 0.697 to 0.973, nominal P = 0.023). CD19 on memory B cells demonstrated an OR of 0.834 (95% CI: 0.728 to 0.957, nominal P = 0.009), and CD28 on CD28+ CD45RA– CD8+ T cells showed an OR of 0.852 (95% CI: 0.771 to 0.943, nominal P = 0.002). Other traits with nominally protective trends included CD11c+ HLA-DR++ monocytes (% of monocytes), CD39+ CD8+ T cells, and resting CD4 Treg, each with their respective ORs, CIs, and P values that suggest a protective role in AOSD (Figures 2 and 3).
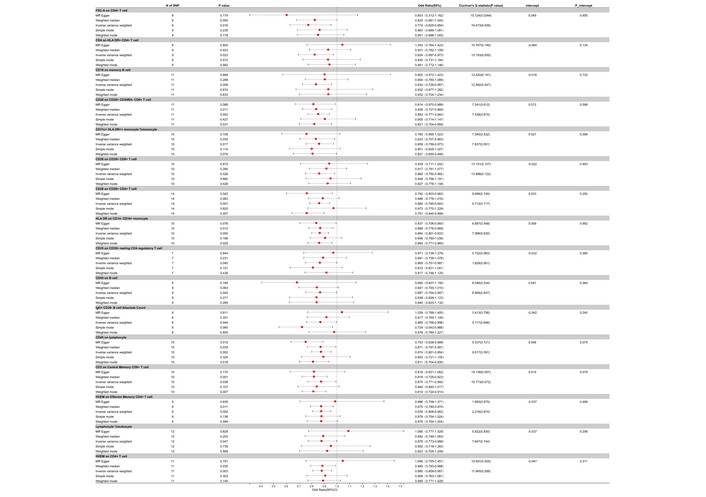
Forest plot for the protective effect of immune cells on the risk of AOSD derived from MR-Egger, weighted median, inverse variance weighted, simple mode, and weighted mode. Red dots represent OR values. Both sides of the line segment represent low/high CIs. CI: confidence interval; AOSD: adult-onset Still’s disease; MR: Mendelian randomization; OR: odds ratios.
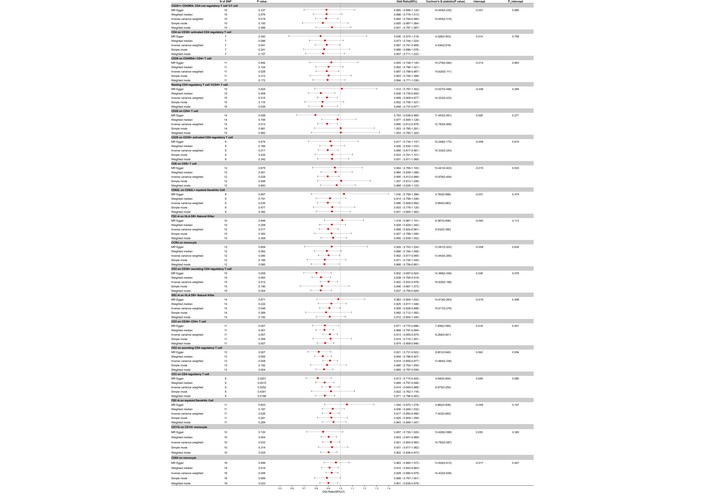
Forest plot for the protective effect of the remaining immune cells on the risk of AOSD derived from MR-Egger, weighted median, inverse variance weighted, simple mode, and weighted mode. Red dots represent OR values. Both sides of the line segment represent low/high CIs. CI: confidence interval; AOSD: adult-onset Still’s disease; MR: Mendelian randomization; OR: odds ratios.
Conversely, 15 traits showed nominally risk-associated trends, with ORs suggesting increased risk for AOSD at the nominal level (all adjusted P > 0.05 after FDR correction). For example, IgD on IgD+ CD38– unswitched memory B cells had an OR of 1.066 (95% CI: 1.001 to 1.134, nominal P = 0.046), and CX3CR1 on CD14+ CD16+ monocytes showed an OR of 1.140 (95% CI: 1.048 to 1.240, nominal P = 0.002). The activated & secreting CD4 Treg %CD4 Treg demonstrated an OR of 1.156 (95% CI: 1.047 to 1.277, nominal P = 0.004), and the central memory CD4+ T cell %T cell had an OR of 1.157 (95% CI: 1.014 to 1.321, nominal P = 0.031). Additional risk factors included IgD+ CD24+ B cells, CD16– CD56+ on HLA-DR+ natural killer (NK) cells, and CD25 on CD4 Treg, each with their ORs, CIs, and P values that point toward a risk-increasing association with AOSD (Figure 4).
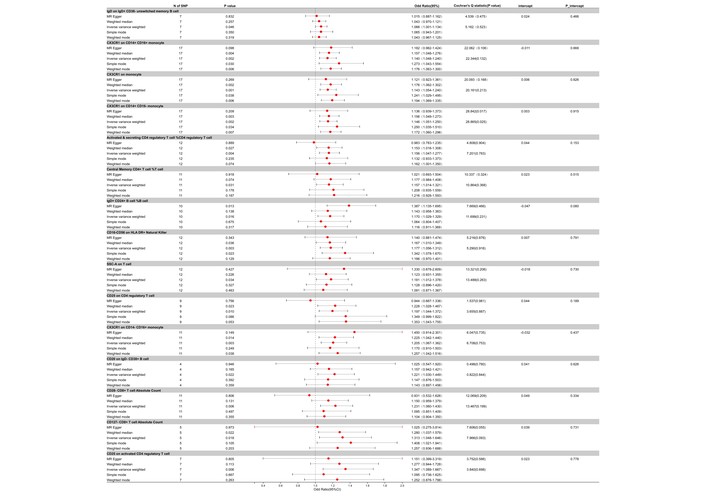
Forest plot for the hazard effect of immune cells on the risk of AOSD derived from MR-Egger, weighted median, inverse variance weighted, simple mode, and weighted mode. Red dots represent OR values. Both sides of the line segment represent low/high CIs. CI: confidence interval; AOSD: adult-onset Still’s disease; MR: Mendelian randomization; OR: odds ratios.
The consistency of these nominally significant associations was further supported by four additional MR methods: MR-Egger, weighted median, simple mode, and weighted mode analyses, which showed directional consistency with the IVW results, though none of the associations survived FDR correction.
In the reverse MR analysis exploring the causal relationship from AOSD to immune cell traits, we identified 40 immune cell phenotypes showing nominal associations with AOSD (unadjusted P < 0.05) (Table S3). Among these, 25 traits showed negative beta coefficients (suggestive of decreased levels associated with AOSD), and 15 traits showed positive beta coefficients (suggestive of increased levels). For example, AOSD had a positive effect on the CD45RA– CD28– CD8+ T cell %CD8+ T cell with a β of –0.740 (95% CI: –1.435 to –0.045, nominal P = 0.037), and CD45RA– CD28– CD8+ T cell %T cell with a β of –0.343 (95% CI: –0.646 to –0.041, nominal P = 0.026). Other phenotypes, such as HLA-DR+ CD8+ T cell %lymphocyte and CD20 on IgD+ CD38– naive B cells, showed similar negative β coefficients, pointing towards a reduction in their proportions in relation to AOSD (Figure 5). However, none of these associations remained significant after FDR correction (all adjusted P > 0.05). Therefore, these findings should be interpreted as hypothesis-generating rather than evidence of causal effects.
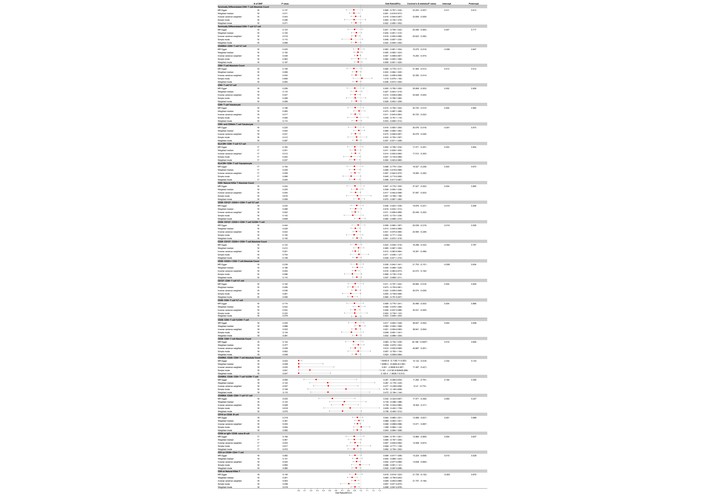
Forest plot for the protective effect of AOSD on the risk of immune cells derived from MR-Egger, weighted median, inverse variance weighted, simple mode, and weighted mode. Red dots represent OR values. Both sides of the line segment represent low/high CIs. CI: confidence interval; AOSD: adult-onset Still’s disease; MR: Mendelian randomization; OR: odds ratios.
Conversely, 15 immune cell phenotypes showed positive beta coefficients at the nominal level, suggestive of increased levels associated with AOSD. For instance, the presence of AOSD was associated with an increase in the percentage of CD8 on HLA-DR+ CD8+ T cells with a β of 0.070 (95% CI: 0.014 to 0.126, nominal P = 0.015), the percentage of CD38 on IgD+ B cells with a β of 0.072 (95% CI: 0.050 to 0.139, nominal P = 0.036), and the percentage of central memory CD8+ T cell %CD8+ T cell with a β of 0.074 (95% CI: 0.008 to 0.141, nominal P = 0.029). Other phenotypes, including HLA-DR+ CD4+ T cells %lymphocyte, and CD62L– dendritic cell (DC) absolute count, demonstrated positive β coefficients, indicating an elevation in their levels in the context of AOSD (Figure 6).
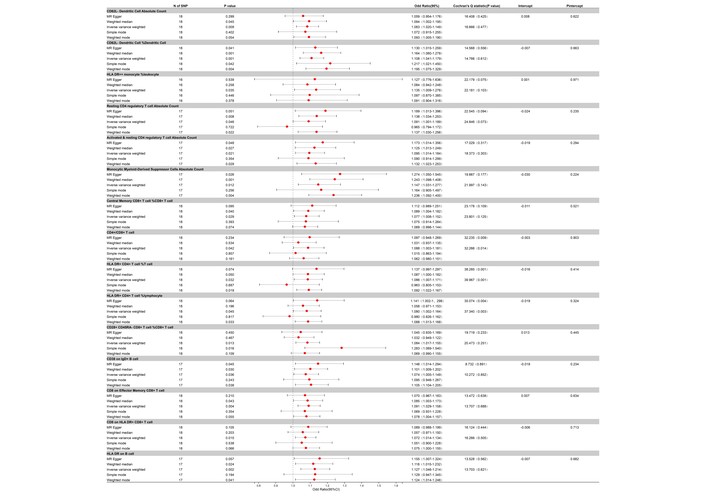
Forest plot for the hazardous effect of AOSD on the risk of immune cells derived from MR-Egger, weighted median, inverse variance weighted, simple mode, and weighted mode. Red dots represent OR values. Both sides of the line segment represent low/high CIs. CI: confidence interval; AOSD: adult-onset Still’s disease; MR: Mendelian randomization; OR: odds ratios.
The directional consistency of these nominal findings was supported by four additional MR methods (MR-Egger, weighted median, simple mode, and weighted mode). However, none of these associations remained significant after FDR correction (all adjusted P > 0.05). Therefore, these findings should be interpreted as hypothesis-generating and do not provide robust evidence for causal effects of AOSD on immune cell traits.
The detailed results of forward and reverse MR analyses, categorized by the direction of effect (protective and risk factors for forward MR; negative and positive beta coefficients for reverse MR), are presented in Table S4 to Table S7. Specifically, Table S4 lists forward MR results with protective effects, Table S5 lists forward MR results with risk effects, Table S6 lists reverse MR results with negative beta coefficients, and Table S7 lists reverse MR results with positive beta coefficients.
To ascertain the robustness of our MR analysis, a series of sensitivity analyses were conducted. Utilizing Cochran’s Q test, we identified significant heterogeneity (P < 0.05) in the forward MR analysis between certain immune cells and AOSD, notably in FSC-A on CD4+ T cells (ebi-a-GCST90001973) and CX3CR1 on CD14+ CD16– monocytes (ebi-a-GCST90001997) (Figures 2, 3, and 4). Similarly, in the reverse MR analysis, heterogeneity (P < 0.05) was observed for several immune cells, including the percentage of CD28– CD8+ T cells within total T cells (ebi-a-GCST90001685), the absolute count of CD28– CD8+ T cells (ebi-a-GCST90001687), and the percentage of CD8+ T cells within total leukocytes (ebi-a-GCST90001607), among others (Figures 5 and 6).
In both the forward and reverse MR analyses, the MR-Egger intercept test did not detect significant horizontal pleiotropy (P > 0.05), suggesting that horizontal pleiotropy is unlikely to have substantially biased the results. The reliability of the results was further corroborated through the examination of scatter plots (forward: Figure S1 and reverse: Figure S2), funnel plots (forward: Figure S3 and reverse: Figure S4), and leave-one-out analyses (forward: Figure S5 and reverse: Figure S6). The funnel plots indicated no presence of directional pleiotropy, and the leave-one-out approach confirmed that no single SNP exerted a disproportionately significant influence on our results, thus reinforcing the stability and credibility of the MR analysis outcomes.
This study comprehensively investigated the complex relationship between 731 immune cell traits and AOSD using an extensive public GWAS database. To our knowledge, this research represents the first attempt to explore the connection between specific immune cell traits and AOSD using a bidirectional MR approach. At the nominal significance level (unadjusted P < 0.05), we identified 49 immune cell traits showing suggestive associations with AOSD, categorized as follows: 27 in the T cell panel, 6 in the B cell panel, 9 in the monocyte panel, 2 in the DC panel, 3 in the NK cell panel, and 2 in the lymphocyte panel. Among these, 34 exhibited nominally protective trends, while 15 exhibited nominally risk-associated trends. Reverse MR nominally suggested that AOSD may be associated with decreased levels of 25 immune cell traits and increased levels of 15 immune cell traits. However, it is critical to emphasize that none of these associations remained significant after FDR correction for multiple testing (all adjusted P > 0.05). Therefore, all findings reported here are nominally significant only and should be interpreted as hypothesis-generating rather than evidence of causal effects. At the nominal level, our results suggest that the increased expression of CX3CR1 on monocytes promotes the onset of AOSD [24, 25]. Polyarthritis or diffuse arthralgias, one of the clinical features of AOSD, have been linked to CX3CR1-expressing monocytes or macrophages participating in the development and maintenance of arthritis [25, 26]. The sensory neuron CGRP is suggested to upregulate the level of injurious cell factors, leading to the release of sFKN and pushing the expression of the CX3CR1 receptor on monocytes, which may propel macrophages to differentiate into the M1 phenotype, subsequently releasing pro-inflammatory cytokines that amplify the inflammatory response [24, 25]. However, given the nominal nature of our findings, these mechanistic hypotheses require validation in future studies.
Our study nominally explored associations between Tregs and AOSD using MR. Forward MR showed nominal positive associations for CD25 on CD39+ resting CD4 Treg and the percentage of resting CD4 Treg within CD4+ T cells, whereas the percentage of activated & secreting CD4 Tregs within CD4+ T cells showed a nominal risk association. Reverse MR nominally suggested that AOSD episodes may be associated with elevated levels of resting and activated CD4 Treg absolute counts. However, none of these associations remained significant after FDR correction (all adjusted P > 0.05). Therefore, no causal conclusions can be drawn. Previous literature has reported that Treg proportions decrease in acute AOSD and increase during remission [27], and that circulating CD4+ CD25high Treg cells negatively correlate with disease activity [12]. It has also been suggested that impaired or over-activated Treg function may contribute to disease persistence [28]. While these findings suggest a potential bidirectional role of Tregs in AOSD, they are derived from observational studies and should not be directly integrated with our nominal MR results. Given the lack of statistical significance in our study, any discussion of biological mechanisms remains speculative and hypothesis-generating.
The forward MR results revealed that FSC-A on HLA-DR+ NK and SSC-A on HLA-DR+ NK exhibited nominal protective associations with AOSD. “SSC-A” is a parameter used to assess cell granularity, and “FSC-A” stands for “Forward Scatter Area”, which is one of the MP of flow cytometry [29]. Genetically predicted larger NK cell size (FSC-A) and greater granularity (SSC-A)—features associated with enhanced cytotoxic activity and activation status—may contribute to a protective effect against AOSD. NK cells eliminate target cells by releasing perforin and granzymes or through the Fas/FasL pathway [30]. In addition, NK cells secrete various cytokines, such as IFN-γ, which can promote the expression of MHC-I on antigen-presenting cells, better exert T cell immune function, and reduce the degree of infection [31]. A previous experiment found that the proportion of NK cells in acute AOSD was significantly lower than in healthy people, and the ability of NK cells to produce IFN-γ may be affected by disease activity [32]. However, these findings are derived from observational studies and should not be directly conflated with our nominal MR results.
At the nominal level, we observed suggestive associations between increased CD11b on CD14+ monocytes and CD11c+ HLA-DR++ monocyte percentage with a decreased risk of AOSD. A previous study explored the potential role of pattern recognition receptors in AOSD [9]. The study found that the expression level of CD11b in monocytes of AOSD patients was significantly higher than that of healthy controls, and no significant difference was found in the percentage of CD11C-positive cells between AOSD patients and healthy controls. The frequency of CD11b was positively correlated with systemic score, lactic dehydrogenase (LDH), aspartate transaminase (AST), IL-23, and IL-18 levels, suggesting that CD11b-positive cells may play a role in the pathogenesis of AOSD [9]. However, given the nominal significance of our MR findings, these mechanistic hypotheses require further validation.
MR analysis showed a nominal positive association between increased expression of CD20 on IgD– CD38+ B cells and AOSD. In one case report, a patient whose immunohistochemical results showed that proliferating immunoblasts were CD20-positive was diagnosed with AOSD, and lymphoid follicles were also found to express CD20, suggesting a potential role for CD20 in the pathogenesis of AOSD [33]. CD20 is a structurally unique protein that belongs to the transmembrane 4 domain family A (MS4A) protein family and is only expressed on B cells [34]. CD20 directly regulates the transmembrane Ca2+ conductivity of B lymphocytes and also plays a regulatory role in the proliferation and differentiation of B cells [35, 36]. The increased expression of CD20 on B cells may cause abnormal activation or dysfunction of B cells, thus aggravating the occurrence of AOSD. However, our nominal MR findings do not provide causal evidence for this hypothesis.
Furthermore, we analyzed the relationship between HLA expression and AOSD. At the nominal level, higher expression of HLA-DR+ CD4+ T cell percentage within lymphocytes, HLA-DR+ CD4+ T cell percentage within T cells, HLA-DR on B cells, and HLA-DR++ monocyte percentage within leukocytes showed suggestive risk-associated trends with AOSD. One experiment found the same result: patients with AOSD showed a higher proportion of lymphocytes expressing HLA-DR compared to healthy controls [11]. In addition, another study has found a genetic association between HLA and AOSD at the GWAS level, demonstrating that HLA-DRB1 plays a pivotal role in AOSD pathophysiology [37]. While these observations align with our nominal findings, the lack of statistical significance after FDR correction precludes definitive causal conclusions.
One of the strengths of our study is the application of MR, which utilizes genetic variation as a proxy for exposure, effectively circumventing issues of reverse causation and selection bias [38]. We employed multiple statistical methods, including IVW, MR-Egger, weighted median, weighted mode, and simple mode for a comprehensive MR analysis, coupled with sensitivity analysis to bolster the robustness of our findings. Additionally, our stringent selection criterion for IVs, where only SNPs with an F-statistic greater than 10 were considered, ensured that all IVs were strong, thereby increasing our results’ confidence.
However, several limitations require consideration. First, we classified IVs with a P-value threshold of less than 5 × 10⁻⁶ as genome-wide significant, which, while not meeting the conventional GWAS significance threshold, were deemed acceptable based on the broader context of previous research. Second, the modest sample size of the immune cell GWAS (n = 3,757) limits the statistical power of our analysis. According to established MR power calculations, the power to detect a causal effect depends heavily on the proportion of variance explained by the genetic instruments (R2) and the sample size. Therefore, our null findings after FDR correction may reflect lack of power rather than a true absence of causal effects. Future studies with larger immune cell GWAS samples are needed to confirm or refute these exploratory findings. Third, all GWAS data were derived from European populations, which limits the generalizability of our results to other ethnic groups. Fourth, we observed significant heterogeneity in some of the MR results. Although we used a random-effects IVW model that accounts for heterogeneity, this issue may still affect the interpretation of our findings. Fifth, a limitation of our reverse MR analysis is that many AOSD IVs are likely located within the MHC/HLA region (chr6: 25–35 Mb), where extensive LD may violate the assumption of instrument independence. Therefore, the reverse MR findings should be interpreted with caution, as they may be influenced by HLA-related pleiotropy. Future studies with larger AOSD GWAS and more rigorous handling of the MHC region are needed to validate these results. Sixth, we did not explicitly exclude SNPs associated with potential confounders (e.g., BMI, smoking, alcohol use) using external databases such as PhenoScanner V2, as the website was temporarily unavailable at the time of our analysis. Although our MR-Egger intercept tests did not detect significant horizontal pleiotropy, active exclusion of confounder-related SNPs represents a more rigorous approach and should be implemented in future studies.
Clinically, the anti-cytokines are used for the treatment of AOSD target IL-1, IL-6, and TNF-alpha, which are the pivotal cytokines involved in AOSD pathogenesis. Examples of IL-1 inhibitors include anakinra (ANK), canakinumab (CAM) and rilonacept (RIL) [26]. In this way, our research can help inspire the adoption of the development and selection of medicine. For example, CD8+ CD103+ T regulatory cells induced ex vivo with transforming growth factor β (TGF-β) (iTregs) inhibited immune cell responses to ameliorate excessive autoimmune inflammation, which contributes to systemic lupus erythematosus [39].
miRNAs and immune cell subsets play a role in forming scar pathogenesis [40]. Likewise, the development of hypertrophic scars might be related to specific gut microbiota and immune cells [41]. Thus, immune cells can serve as biomarkers for inflammatory diseases, indicating that immune traits could be used in the future for early diagnosis of AOSD, assessment of disease activity, prediction of treatment response or recurrence.
To further elucidate the underlying immunological mechanisms, it is plausible that key immune cell subpopulations such as CX3CR1+ monocytes, resting or activated Treg, and CD8+ naive T cells may mediate or modify the causal associations between identified immune cell traits and AOSD. Future studies employing formal two-step mediation MR designs are warranted to disentangle the complex causal network among interacting immune cell phenotypes in the development of AOSD.
Although the present study identified several immune cell traits causally associated with AOSD, the potential mediating effects among interconnected immune cell subpopulations were not formally quantified. Future mediation-based MR studies are needed to estimate the proportion of the total effect mediated by key immune subsets, which will further clarify the hierarchical and interactive immune mechanisms in the pathogenesis of AOSD.
As for the reason for immune cell traits with significant heterogeneity (e.g., FSC-A on CD4+ T cells, CX3CR1 on CD14+ CD16– monocytes), first, from a genetic perspective, heterogeneity may arise from differences in the genetic architecture underlying individual immune cell traits. Different instrumental SNPs may tag distinct biological pathways—for instance, some SNPs influencing gene expression levels, others affecting cellular proliferation or differentiation—leading to variable effect sizes and directions. Furthermore, variation in LD structures across the genome can introduce differential confounding, as certain SNPs may tag causal variants within complex LD regions, thereby contributing to heterogeneity. Second, biological heterogeneity stems from the dynamic activation states and tissue-specific functions of immune cells. Immune cell subsets, such as CD4+ T cells or monocytes, comprise functionally diverse subpopulations (e.g., naive, memory, effector, or regulatory states) with distinct roles in AOSD pathogenesis. Genetic instruments may capture effects across these different activation states or reflect systemic effects measured in peripheral blood, which may not fully recapitulate local inflammatory processes in affected tissues (e.g., joint microenvironments). Finally, reciprocal cellular interactions within the immune system complicate MR estimates. The causal relationships between immune cell traits are often bidirectional and context-dependent. For example, inflammatory signals from monocytes can reciprocally regulate T cell subsets, creating a complex network that may introduce heterogeneity into SNP-based causal estimates. To robustly account for these multifaceted sources of heterogeneity, we employed the random-effects IVW model in our primary analysis. This model is specifically designed to accommodate and provide valid inference under conditions of between-SNP heterogeneity, offering a more conservative and reliable estimate of the causal effect compared to fixed-effects models.
Our study still has some untested limitations, including the gene-environment interaction and our solely MR results, which are not validated in other independent populations. Environmental factors can regulate gene expression and have an impact on the extent to which the gene is expressed and functions [13, 42]. We don’t discuss the potential relationship of gene-environment interaction, which we will design a MR to address this problem in our later research combined environmental factors. The method we use is going to be learned from some experience from an established study. The study probed the gene-environment interaction and used MR to assess causalities of modifiable risk factors for Parkinson’s disease [43].
What’s more, our result hasn’t been verified in other independent populations, leading to a limitation of the results. Validation of MR findings in AOSD presents substantial challenges due to the unique clinical and epidemiological characteristics of this rare autoinflammatory disorder. First, AOSD has a low population incidence and lacks large-scale, independent GWAS cohorts with consistent phenotyping, severely limiting statistical power for replication. Second, the disease lacks specific diagnostic biomarkers and exhibits marked clinical heterogeneity, with variable presentations of fever, rash, arthritis, and hyperferritinemia, leading to inconsistent case definitions and phenotypic stratification across studies. Third, immune cell traits such as FSC-A and subset-specific surface markers are prone to technical variability in flow cytometric measurement, including differences in gating strategies, sample processing, and laboratory protocols, which further impede reproducibility. Moreover, AOSD is characterized by a weak polygenic architecture with few robust genetic susceptibility loci, restricting the availability of strong IVs for reliable causal inference. Finally, the intense systemic inflammation inherent to AOSD may induce reverse causation, whereby disease activity reshapes immune cell profiles, complicating the distinction between causal contributions and secondary phenotypic changes. Together, these factors render independent validation of MR-derived associations particularly difficult in AOSD, highlighting the need for cautious interpretation and future multicenter collaborative studies. In the future, it is possible that we use independent cohorts (e.g., international AOSD registries) for future validation.
These exploratory findings, though not significant after FDR correction, generate hypotheses regarding potential biomarkers and therapeutic targets, such as CX3CR1 on monocytes and Tregs, that warrant further investigation. Given the nominal nature of the associations, we acknowledge the need for expanded sample sizes, broader population diversity, and independent validation to assess the generalizability of the results. These hypothesis-generating insights may inform the design of future studies exploring more targeted treatment approaches for individuals with AOSD, but no definitive conclusions can be drawn from the current data.
AC: absolute cell counts
AOSD: adult-onset Still’s disease
CIs: confidence intervals
DC: dendritic cell
GWAS: genome-wide association studies
IVs: instrumental variables
IVW: inverse variance weighted
LD: linkage disequilibrium
MFI: median fluorescence intensity
MP: morphological parameters
MR: Mendelian randomization
NK: natural killer
OR: odds ratios
RC: relative cell counts
SD: standard deviation
SNPs: single nucleotide polymorphisms
Tregs: regulatory T cells
The supplementary tables for this article are available at: https://www.explorationpub.com/uploads/Article/file/1001406_sup_1.xlsx (Tables S1–S3) and https://www.explorationpub.com/uploads/Article/file/1001406_sup_2.pdf (Tables S4–S7). The supplementary figures for this article are available at: https://www.explorationpub.com/uploads/Article/file/1001406_sup_3.pdf (Figure S1), https://www.explorationpub.com/uploads/Article/file/1001406_sup_4.pdf (Figure S2), https://www.explorationpub.com/uploads/Article/file/1001406_sup_5.pdf (Figure S3), https://www.explorationpub.com/uploads/Article/file/1001406_sup_6.pdf (Figure S4), https://www.explorationpub.com/uploads/Article/file/1001406_sup_7.pdf (Figure S5), and https://www.explorationpub.com/uploads/Article/file/1001406_sup_8.pdf (Figure S6).
We thank the IEU open GWAS project for providing summary statistics data of AOSD and 731 immune cell traits for our analyses.
JLX, FL, and SXZ: Conceptualization, Investigation, Formal analysis, Writing—original draft, Writing—review & editing. XJJ and MXL: Data Curation, Writing—original draft, Writing—review & editing. JFZ and RZ: Visualization, Writing—original draft, Writing—review & editing. CQW and HYZ: Writing—original draft, Writing—review & editing. All authors read and approved the submitted version.
The authors declare that they have no conflicts of interest.
Not applicable.
Not applicable.
Not applicable.
The datasets generated during and/or analyzed during the current study are available in the IEU open GWAS project (https://gwas.mrcieu.ac.uk/) and the FinnGen database (https://www.finngen.fi/). The datasets supporting the conclusions of this article are included within the additional files and the main text of the article.
This study was supported by grants from the Natural Science Foundation of Shanxi Province (No. 202203021221269), the National Natural Science Foundation of China (No. 82001740), and the College Students Innovation and Entrepreneurship Training Program Foundation of Shanxi Medical University (No.20250523). The funders had no role in study design, data collection, analysis, decision to publish, or preparation of the manuscript.
© The Author(s) 2026.
Open Exploration maintains a neutral stance on jurisdictional claims in published institutional affiliations and maps. All opinions expressed in this article are the personal views of the author(s) and do not represent the stance of the editorial team or the publisher.
Copyright: © The Author(s) 2026. This is an Open Access article licensed under a Creative Commons Attribution 4.0 International License (https://creativecommons.org/licenses/by/4.0/), which permits unrestricted use, sharing, adaptation, distribution and reproduction in any medium or format, for any purpose, even commercially, as long as you give appropriate credit to the original author(s) and the source, provide a link to the Creative Commons license, and indicate if changes were made.



View: 1436
Download: 12
Times Cited: 0


