Original Article


Affiliation:
1Department of Microbiology, College of Medicine, University of Anbar, Ramadi 31001, Iraq
Email: zee24m0008@uoanbar.edu.iq
ORCID: https://orcid.org/0009-0000-9182-554X


 ,
,
Affiliation:
1Department of Microbiology, College of Medicine, University of Anbar, Ramadi 31001, Iraq
ORCID: https://orcid.org/0000-0002-4845-4453
,
Affiliation:
2Department of Internal Medicine, College of Medicine, University of Anbar, Ramadi 31001, Iraq
ORCID: https://orcid.org/0000-0002-8420-3715
Explor Immunol. 2026;6:1003270 DOI: https://doi.org/10.37349/ei.2026.1003270
Received: April 12, 2026 Accepted: August 13, 2026 Published: October 08, 2026
Academic Editor: Narinder K. Mehra, Indian Council of Medical Research (ICMR), India
Aim: The natural history of chronic hepatitis B (CHB) is governed by hepatitis B e-antigen (HBeAg) status, viral replication, and host immunity. Reliable non-invasive markers of hepatic fibrosis and necroinflammation remain limited. The present study aimed to quantify serum interleukin-6 (IL-6), IL-8, IL-10, interferon-gamma (IFN-γ), tumor necrosis factor-alpha (TNF-α), transforming growth factor-beta (TGF-β), and microRNA-122 (miR-122) across stages of fibro-inflammatory progression in CHB, evaluate their association with HBeAg status and hepatic injury, and compare their diagnostic accuracy with conventional non-invasive indices.
Methods: In a cross-sectional case-control study, 90 CHB patients and 100 healthy controls were enrolled at three Iraqi tertiary centers (November 2024–June 2025). Biomarkers were quantified and correlated with HBeAg status and liver stiffness measured by transient elastography (FibroScan), and compared with aspartate aminotransferase/platelet ratio index (APRI) and fibrosis-4 index (FIB-4).
Results: Hepatitis B virus (HBV) DNA (6.5 ± 1.8 vs. 2.8 ± 1.2 log10 IU/mL; P < 0.001), the proportion with advanced fibrosis (F3–F4: 46% vs. 18%; P = 0.004), and liver stiffness (9.8 ± 5.2 vs. 7.5 ± 4.8 kPa; P = 0.04) were greater in HBeAg-positive than in HBeAg-negative patients (
Conclusions: Persistent HBeAg expression, elevated pro-inflammatory cytokines, and suppressed miR-122 constitute an integrated molecular signature of fibro-inflammatory severity in CHB. This multi-marker panel offers an accurate, accessible, non-invasive tool for fibrosis risk stratification, particularly in resource-limited settings.
Chronic hepatitis B virus (HBV) infection constitutes a major global health burden, affecting an estimated 254 million individuals worldwide in 2022 and accounting for an estimated 1.1 million deaths annually attributable to cirrhosis and hepatocellular carcinoma (HCC) [1]. Although hepatitis B e-antigen (HBeAg) seropositivity serves as a marker of immune tolerance and high-level viral replication, the quantitative relationship between HBeAg status and intrahepatic necroinflammation and fibrogenesis remains incompletely characterized [2].
Conventional serum aminotransferases, including alanine aminotransferase (ALT) and aspartate aminotransferase (AST), demonstrate limited correlation with the degree of histological hepatic injury; transient elastography is further limited by the high cost of the equipment, reduced measurement reliability in patients with obesity or ascites, and an inability to discriminate necroinflammation from fibrosis, particularly when ALT levels are elevated, whereas percutaneous liver biopsy is principally constrained by sampling error, the risk of procedural complications, and low patient acceptance [3, 4]. Consequently, increasing attention has been directed toward circulating cytokines that reflect the activation status of Kupffer cells, hepatic stellate cells, and intrahepatic lymphocyte populations [5].
Interleukin-6 (IL-6) activates the STAT3-dependent signaling cascade, thereby promoting hepatic fibrogenesis, while IL-8 mediates neutrophil recruitment and amplifies the hepatic injury response [6]. Tumor necrosis factor-alpha (TNF-α) and transforming growth factor-beta (TGF-β) drive collagen cross-linking and extracellular matrix deposition, whereas the role of interferon-gamma (IFN-γ) is pleiotropic, exerting both antiviral and immunopathological effects [7]. IL-10, although primarily recognized as an anti-inflammatory cytokine, paradoxically facilitates viral persistence in the context of HBV infection [8].
MicroRNA-122 (miR-122), the most abundantly expressed hepatic miR, regulates lipid metabolism and innate immune signaling [9]. Although circulating miR-122 concentrations serve as a sensitive indicator of hepatocyte injury, paradoxical suppression of this miR has been observed with advancing fibrosis stages, reflecting progressive hepatocyte depletion and stellate cell activation [10, 11].
Given the incomplete understanding of how these factors collectively contribute to fibro-inflammatory progression, the present study aimed to quantify serum concentrations of IL-6, IL-8, IL-10, IFN-γ, TNF-α, TGF-β, and miR-122 across varying degrees of hepatic fibrosis and necroinflammation as assessed by transient elastography. Additionally, the influence of HBeAg status on these biomarker profiles was investigated, and the diagnostic accuracy of these biomarkers was compared with that of the AST/platelet ratio index (APRI) and fibrosis-4 index (FIB-4) using transient elastography as the reference standard. Finally, the utility of circulating miR-122 levels was evaluated in the context of chronic hepatitis B (CHB)-associated fibrosis progression.
A cross-sectional case-control study was conducted in the gastroenterology departments of Al-Ramadi, Baghdad, and Al-Yarmouk Teaching Hospitals in Iraq, between November 2024 and June 2025.
The study protocol was approved by the Scientific and Ethical Committee of the Iraqi Board for Medical Specializations (Ref. 2023-HEP-11). Written informed consent was obtained from all participants in accordance with the principles of the Declaration of Helsinki.
Treatment-naive adults with documented HBsAg seropositivity for a minimum of 6 months constituted the study group. Exclusion criteria encompassed co-infection with hepatitis C, D, and/or HIV, autoimmune hepatitis, metabolic dysfunction-associated steatotic liver disease with controlled attenuation parameter (CAP) > 290 dB/m, HCC, prior antiviral therapy, pregnancy, and immunosuppressive conditions. Healthy controls comprised HBsAg-negative volunteers with normal hepatic biochemistry. HBeAg-negative, anti-HBe-positive participants were further classified, in accordance with EASL and WHO criteria [12, 13], into three phases: inactive carriers (HBV DNA < 2,000 IU/mL with persistently normal ALT), the indeterminate “grey-zone” (HBV DNA 2,000–20,000 IU/mL and/or intermittently elevated ALT), and HBeAg-negative chronic active hepatitis (HBV DNA > 20,000 IU/mL with elevated ALT) [14]. This classification was subsequently related to viral load and liver stiffness.
Using OpenEpi software, a minimum sample of 84 CHB patients was calculated to achieve 80% statistical power at a significance level of 0.05 and an effect size of 0.5. Accordingly, 90 patients and 100 controls were enrolled to permit adequately powered subgroup analyses.
Demographic and clinical data were systematically collected, and blood pressure and anthropometric parameters were recorded. Fasting venous blood samples were obtained for determination of complete blood counts, hepatic enzymes, total bilirubin, serum albumin, creatinine, prothrombin time, fasting glucose, and lipid profile. HBV serological markers were assayed by electrochemiluminescence immunoassay using the Cobas e601 analyzer, and HBV DNA was quantified by real-time polymerase chain reaction using the Sansure Biotech platform with a lower limit of detection of 10 IU/mL. Serum complement components C3 and C4 were measured by nephelometry.
Serum concentrations of IL-6, IL-8, IL-10, IFN-γ, TNF-α, and TGF-β were quantified in duplicate using high-sensitivity enzyme-linked immunosorbent assay (ELISA) kits (R&D Systems, Minneapolis, MN, USA), with an intra-assay coefficient of variation of < 5%.
Total RNA was isolated from 200 μL serum aliquots using the miRNeasy Serum/Plasma Kit (Qiagen, Hilden, Germany), with exogenous synthetic cel-miR-39 (1.6 × 10⁸ copies) added as a spike-in normalization control. Expression levels of miR-122 and U6 were quantified using miScript RT and SYBR Green PCR Kits on a Rotor-Gene Q thermocycler. Relative expression was calculated using the 2^(−ΔΔCt) method.
Transient elastography was performed using the FibroScan 530 Compact System by certified operators blinded to clinical and laboratory data. A minimum of ten valid measurements were acquired per subject, with an interquartile range (IQR)-to-median ratio of < 30% required for result validity. Liver stiffness measurements (LSMs) were stratified into fibrosis stages as follows: F0 (< 5.3 kPa), F1 (5.3–6.9 kPa), F2 (7.0–9.4 kPa), F3 (9.5–12.4 kPa), and F4 (≥ 12.5 kPa), adapted from previously validated transient elastography thresholds [15, 16]. CAP values were simultaneously recorded.
APRI = [(AST/ULN)/platelets (109/L)] × 100; FIB-4 = [age × AST]/[platelets ×
Statistical analyses were conducted using MedCalc version 20 and SPSS version 28.0. Distributional normality was assessed using the Shapiro-Wilk test. Continuous variables were expressed as median (IQR) or mean ± standard deviation, as appropriate. Intergroup comparisons were performed using the independent samples t-test or Mann-Whitney U test for continuous variables and the chi-square test for categorical data. Multi-group comparisons were conducted using one-way analysis of variance (ANOVA) or the Kruskal-Wallis test according to data distribution. Correlation analyses were performed using Spearman rank correlation coefficients. Multivariable logistic regression was employed to identify independent predictors of significant fibrosis (F ≥ 2) and advanced fibrosis (F3–F4). The composite biomarker score was derived as the β-weighted linear predictor of a multivariable binary logistic regression model in which significant fibrosis (F ≥ 2) served as the dependent variable and log-transformed IL-6, TNF-α, and miR-122 were entered as covariates; the resulting continuous score was then evaluated by receiver operating characteristic (ROC) analysis, and an optimal cut-off was selected by the Youden index. Pairwise comparisons of area under the ROC curve (AUC) were performed using the DeLong test. A two-sided P-value < 0.05 was considered statistically significant.
A total of 90 CHB patients (54% male; median age, 35 years) and 100 age- and sex-matched healthy controls (52% male; median age, 34 years) were enrolled. Among CHB patients, 50 (56%) were HBeAg-positive. Compared with controls, CHB patients exhibited significantly elevated ALT (46 vs. 22 IU/L), AST (42 vs. 21 IU/L), and LSM (7.4 vs. 4.3 kPa; all P < 0.001), along with lower platelet counts (230 vs. 275 × 109/L, P < 0.001). Median HBV DNA was 6.1 log10 IU/mL. No statistically significant differences were observed between groups with respect to age, sex, body mass index, or CAP (Table 1).
Baseline characteristics of CHB patients and healthy controls.
| Characteristic | CHB (n = 90) | Controls (n = 100) | P-value |
|---|---|---|---|
| Age, years | 35 (27–45) | 34 (26–44) | 0.41 |
| Male sex, n (%) | 49 (54) | 52 (52) | 0.78 |
| BMI, kg/m2 | 25.3 ± 3.1 | 24.9 ± 2.8 | 0.33 |
| ALT, IU/L | 46 (25–89) | 22 (18–27) | < 0.001 |
| AST, IU/L | 42 (23–81) | 21 (17–25) | < 0.001 |
| Platelets, × 109/L | 230 (159–310) | 275 (242–320) | < 0.001 |
| HBV DNA, log10 IU/mL | 6.1 (3.2–7.8) | — | — |
| HBeAg-positive, n (%) | 50 (56) | — | — |
| LSM, kPa | 7.4 (4.8–12.1) | 4.3 (3.9–4.9) | < 0.001 |
| CAP, dB/m | 245 (210–278) | 238 (220–255) | 0.09 |
Data presented as median [interquartile range (IQR)] or mean ± SD. ALT: alanine aminotransferase; AST: aspartate aminotransferase; BMI: body mass index; CAP: controlled attenuation parameter; HBeAg: hepatitis B e-antigen; HBV: hepatitis B virus; LSM: liver stiffness measurement.
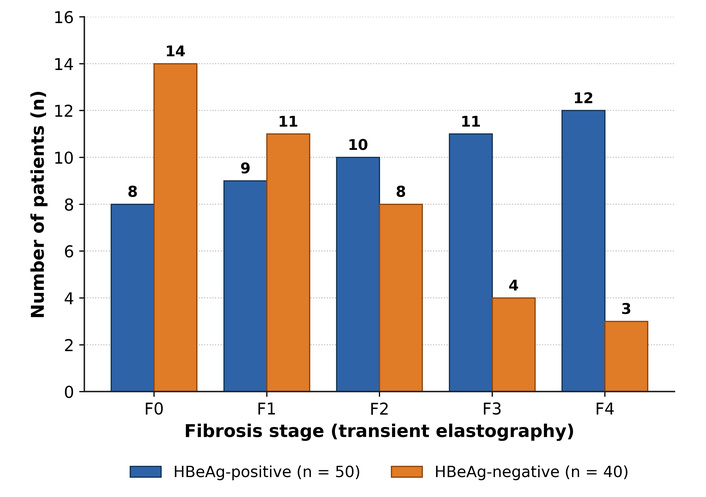
The distribution of fibrosis stages was as follows: F0, 22 patients (24%); F1, 20 (22%); F2, 18 (20%); F3, 15 (17%); and F4, 15 (17%). Among HBeAg-positive patients (n = 50), fibrosis stages F0 through F4 were observed in 8, 9, 10, 11, and 12 patients, respectively. In contrast, HBeAg-negative patients (n = 40) demonstrated the following distribution: F0, 14; F1, 11; F2, 8; F3, 4; and F4, 3 patients. Necroinflammatory activity grades S0, S1, S2, and S3 were documented in 24 (27%), 28 (31%), 22 (24%), and 16 (18%) patients, respectively. HBeAg-positive patients demonstrated significantly higher LSM than HBeAg-negative patients (9.8 ± 5.2 vs. 7.5 ± 4.8 kPa; P = 0.04), with a correspondingly greater proportion of advanced fibrosis [F3–F4: 23/50 (46%) vs. 7/40 (18%); P = 0.004] (Figure 1; Table S1). Among the 40 HBeAg-negative, anti-HBe-positive patients, 20 (50%) were categorized as inactive carriers, 11 (28%) as indeterminate “grey-zone,” and 9 (22%) as HBeAg-negative chronic active hepatitis. Median HBV DNA and liver stiffness rose progressively across these phases (inactive, 5.0 kPa; grey-zone, 7.1 kPa; active hepatitis, 9.8 kPa), and significant fibrosis (F ≥ 2) was confined predominantly to the grey-zone and active-hepatitis groups, whereas inactive carriers exhibited predominantly F0–F1 disease.
Serum concentrations of IL-6, IL-8, TNF-α, and TGF-β demonstrated a progressive escalation across fibrosis stages F0 through F4 (P for trend < 0.001 for all biomarkers, Table 2). Serum IL-6 at stage F4 was 5.8-fold higher than at F0 (798 vs. 138 pg/mL). Correspondingly, serum IL-8, TNF-α, and TGF-β concentrations increased from 45 pg/mL, 310 pg/mL, and 1.8 ng/mL at F0 to 135 pg/mL, 620 pg/mL, and 6.4 ng/mL at F4, respectively. Conversely, serum IL-10 and IFN-γ exhibited peak concentrations at the moderate inflammation stage (S2) followed by a decline at S3, consistent with a state of immunoregulatory exhaustion (Figure 2). Cytokine concentrations stratified by HBeAg status are presented in Table S1.
Serum cytokine levels by fibrosis stage.
| Cytokine (unit) | F0 (n = 22) | F1 (n = 20) | F2 (n = 18) | F3 (n = 15) | F4 (n = 15) | P-trend |
|---|---|---|---|---|---|---|
| IL-6 (pg/mL) | 138 (92–205) | 267 (189–344) | 422 (310–556) | 655 (498–810) | 798 (645–1020) | < 0.001 |
| IL-8 (pg/mL) | 45 (33–58) | 67 (52–81) | 89 (71–108) | 112 (95–130) | 135 (118–155) | < 0.001 |
| TNF-α (pg/mL) | 310 (245–378) | 385 (320–450) | 470 (402–538) | 542 (475–610) | 620 (550–695) | < 0.001 |
| TGF-β (ng/mL) | 1.8 (1.3–2.4) | 2.6 (2.1–3.2) | 3.8 (3.2–4.5) | 5.1 (4.4–5.9) | 6.4 (5.7–7.1) | < 0.001 |
Data presented as median [interquartile range (IQR)]. IL-6: interleukin-6; TGF-β: transforming growth factor-beta; TNF-α: tumor necrosis factor-alpha.
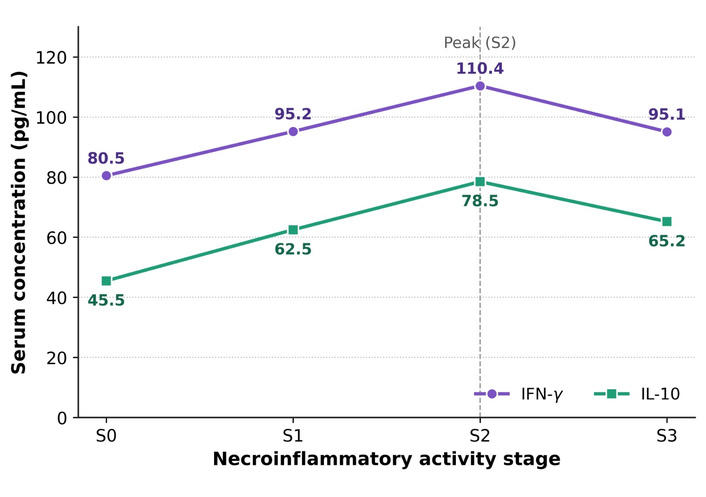
Biphasic trajectory of interleukin-10 (IL-10) and interferon-gamma (IFN-γ) across necroinflammatory stages (S0 to S3) in 90 patients with chronic hepatitis B (CHB). Both cytokines demonstrated peak expression at the moderate inflammation stage (S2), with IL-10 reaching 78.5 pg/mL (73% increase relative to S0 baseline of 45.5 pg/mL) and IFN-γ reaching 110.4 pg/mL (37% increase relative to S0 baseline of 80.5 pg/mL). Subsequently, cytokine concentrations declined during severe inflammation (S3), with IL-10 decreasing to 65.2 pg/mL (17% reduction from S2) and IFN-γ declining to 95.1 pg/mL (14% reduction from S2). This non-linear biphasic pattern contrasts with the monotonic escalation observed for pro-inflammatory cytokines [IL-6, tumor necrosis factor-alpha (TNF-α), transforming growth factor-beta (TGF-β)].
Circulating miR-122 expression was significantly downregulated in CHB patients relative to healthy controls, with relative fold-change values of 1.0000 and 0.0440 in controls and F0, respectively. A progressive decline in miR-122 expression was observed with advancing fibrosis stages, with fold-change values of 0.0070 (F1), 0.0010 (F2), 0.0003 (F3), and 0.0002 (F4) relative to controls (Figure 3). miR-122 expression demonstrated significant inverse correlations with IL-6 (ρ = −0.62), TNF-α (ρ = −0.60), and TGF-β (ρ = −0.45), the full biomarker correlation matrix is provided in Table S2. Suppression of miR-122 below a threshold of ≤ 0.001 was associated with 6.4-fold higher odds of advanced fibrosis [odds ratio (OR) 6.4; 95% confidence interval (CI): 2.8–14.5; P < 0.001]. miR-122 demonstrated superior diagnostic performance for CHB compared with conventional aminotransferases, achieving an AUC of 0.89 versus 0.69 for ALT and 0.71 for AST. A miR-122 threshold of ≤ 0.001 yielded optimal sensitivity and specificity.
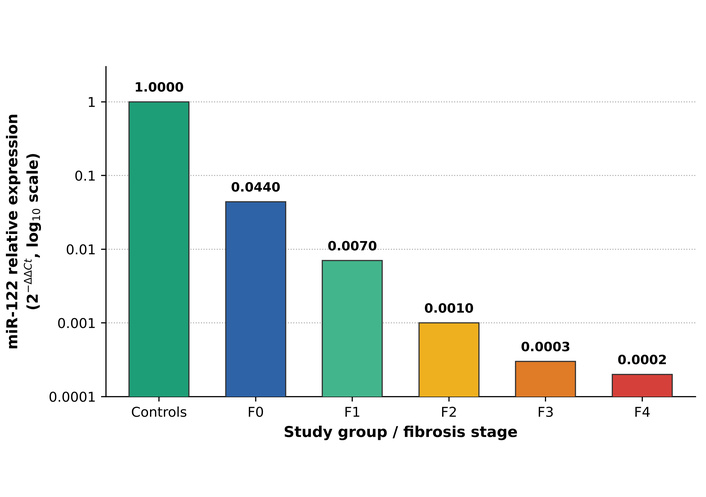
Stepwise suppression of microRNA-122 (miR-122) across fibrosis stages (bar chart of median relative miR-122 expression (2^−ΔΔCt, log10 scale) in controls and across stages F0–F4).
For the detection of significant fibrosis (F ≥ 2), IL-6 at a threshold of ≥ 420 pg/mL yielded an AUC of 0.87 (95% CI: 0.79–0.93), with a sensitivity of 84% and specificity of 81%, significantly outperforming APRI (P = 0.02). TNF-α at a threshold of ≥ 480 pg/mL achieved an AUC of 0.83 (95% CI: 0.74–0.90), with 78% sensitivity and 79% specificity, also significantly superior to APRI (P = 0.04). Among individual biomarkers, miR-122 at a threshold of ≤ 0.001 demonstrated the highest discriminative accuracy, with an AUC of 0.89 (95% CI: 0.81–0.94), 86% sensitivity, and 85% specificity, significantly exceeding the performance of APRI (AUC 0.78; sensitivity 72%; specificity 74%) for detecting significant fibrosis (Table 3).
Diagnostic accuracy of biomarkers for significant fibrosis (F ≥ 2).
| Biomarker | Cut-off | AUC (95% CI) | Sensitivity, % | Specificity, % | P vs. APRI |
|---|---|---|---|---|---|
| IL-6 | ≥ 420 pg/mL | 0.87 (0.79–0.93) | 84 | 81 | 0.02 |
| TNF-α | ≥ 480 pg/mL | 0.83 (0.74–0.90) | 78 | 79 | 0.04 |
| miR-122 | ≤ 0.001 | 0.89 (0.81–0.94) | 86 | 85 | 0.01 |
| APRI | ≥ 0.75 | 0.78 (0.68–0.86) | 72 | 74 | Reference |
APRI: aspartate aminotransferase/platelet ratio index; AUC: area under the receiver operating characteristic curve; CI: confidence interval; IL-6: interleukin-6; TNF-α: tumor necrosis factor-alpha.
A composite score integrating these three biomarkers demonstrated superior predictive accuracy for significant fibrosis, with an AUC of 0.93 (95% CI: 0.87–0.97), significantly outperforming both APRI (AUC 0.78; sensitivity 72%; specificity 74%) and FIB-4 (AUC 0.74; 95% CI: 0.64–0.83; sensitivity 75%; specificity 72%; P = 0.002 for pairwise comparisons). At an optimal composite score threshold of ≥ 1.7, the model achieved 91% sensitivity, 88% specificity, and 89% overall accuracy, representing an AUC gain of 0.15–0.19 over conventional indices (Figure 4).
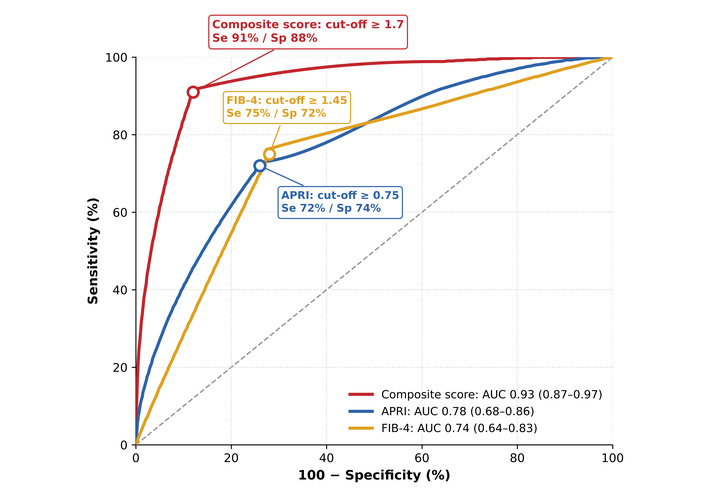
ROC curves comparing the composite score with APRI and FIB-4 for significant fibrosis (F ≥ 2). ANOVA: analysis of variance; APRI: aspartate aminotransferase/platelet ratio index; AUC: area under the receiver operating characteristic curve; FIB-4: fibrosis-4 index; ROC: receiver operating characteristic; Se: sensitivity; Sp: specificity.
Multivariable logistic regression analysis was performed to identify independent predictors of advanced fibrosis, adjusting for age, sex, viral load, ALT, and platelet count. Independent predictors of advanced fibrosis (F3–F4) included HBeAg positivity (OR 4.2; 95% CI: 2.0–8.9; P < 0.001), miR-122 suppression ≤ 0.001 (OR 6.4; 95% CI: 2.8–14.5; P < 0.001), IL-6 elevation ≥ 420 pg/mL (OR 3.9; 95% CI: 1.7–8.8; P = 0.001), age per 10-year increment (OR 1.6; 95% CI: 1.2–2.2; P = 0.003), and platelet count per 50 × 109/L increment (OR 0.7; 95% CI: 0.5–0.9; P = 0.01) (Table 4).
Multivariable predictors of advanced fibrosis (F3–F4).
| Variable | Odds ratio (95% CI) | P-value |
|---|---|---|
| HBeAg-positive | 4.2 (2.0–8.9) | < 0.001 |
| Age, per 10 years | 1.6 (1.2–2.2) | 0.003 |
| Platelets, per 50 × 109/L | 0.7 (0.5–0.9) | 0.01 |
| miR-122 ≤ 0.001 | 6.4 (2.8–14.5) | < 0.001 |
| IL-6 ≥ 420 pg/mL | 3.9 (1.7–8.8) | 0.001 |
CI: confidence interval; HBeAg: hepatitis B e-antigen; IL-6: interleukin-6; miR-122: microRNA-122.
APRI demonstrated moderate correlations with IL-6 (ρ = 0.56, P < 0.001), TNF-α (ρ = 0.48, P < 0.001), and miR-122 (ρ = −0.52, P < 0.001). FIB-4 exhibited comparatively weaker correlations with these biomarkers. Notably, neither APRI nor FIB-4 demonstrated the capacity to capture the biphasic immunological trajectories of IL-10 and IFN-γ observed across necroinflammatory stages.
The present cross-sectional study integrated HBeAg serology, a comprehensive six-cytokine panel, and circulating miR-122 levels to systematically characterize the fibro-inflammatory milieu in CHB. HBeAg positivity was independently associated with augmented hepatic fibrosis, while the composite panel comprising IL-6, TNF-α, and miR-122 provided superior discriminative performance for significant fibrosis compared with previously validated non-invasive algorithms. The composite biomarker score achieved an AUC of 0.93 (overall accuracy, 89%) for the prediction of significant fibrosis, thereby offering improved risk stratification capacity, particularly in resource-limited clinical settings.
The present study demonstrated a 4.2-fold higher odds of advanced fibrosis associated with HBeAg positivity. This finding is concordant with previous investigations in Asian cohorts reporting comparable magnitudes of risk associated with HBeAg seropositivity [2]. Importantly, the majority of prior studies relied on histological assessment of fibrosis in fewer than 30% of their study populations, introducing potential selection and misclassification bias. In contrast, the current study employed transient elastography (FibroScan) for universal fibrosis staging across the entire cohort, thereby mitigating the inherent sampling variability associated with percutaneous liver biopsy [15, 16].
The monotonic escalation of IL-6 and TNF-α concentrations observed across fibrosis stages in the present study is consistent with the established fibrogenic role of these mediators and with cytokine associations reported across the clinical stages of HBV infection [6, 17]. Notably, the present study extends these observations by demonstrating the incremental diagnostic utility of integrating these cytokine measurements with circulating miR-122 levels.
The stepwise suppression of circulating miR-122 corresponding to advancing fibrosis stages parallels miR profiling data previously reported in European cohorts with chronic viral hepatitis [10, 11], concordant with observations in hepatitis C virus infection, in which circulating miR profiles similarly tracked fibrosis severity [18]. Furthermore, the biphasic trajectory of IL-10 and IFN-γ across necroinflammatory stages points to dynamic, non-linear immunoregulation in CHB that conventional indices such as APRI and FIB-4 do not capture.
The composite IL-6, TNF-α, and miR-122 score surpassed prespecified performance thresholds for surrogate endpoint validation. Its implementation as a reflex screening test could enhance the efficiency of referral pathways for elastography and liver biopsy, particularly in geographic regions with limited access to transient elastography technology [3, 4, 19]. The identification of miR-122 suppression below the 0.001-fold threshold as being strongly associated with the greatest fibro-inflammatory severity provides a quantitative molecular correlate that may warrant evaluation as a candidate endpoint in future antifibrotic clinical trials; owing to the cross-sectional design, no causal inference is implied.
The integration of viral, immunological, and molecular parameters may augment non-invasive fibrosis assessment beyond the capacity of conventional approaches, providing a more comprehensive characterization of the pathophysiological mechanisms underlying CHB progression and enabling individualized risk stratification [5, 19].
Incorporating HBeAg status alongside the proposed molecular biomarker panel may refine therapeutic decision-making in CHB management. Contemporary treatment guidelines recommend initiation of antiviral therapy based on ALT levels, viral load, and fibrosis stage [12, 13, 20–22]. Based on the present findings, HBeAg-positive CHB patients demonstrating elevated pro-inflammatory cytokine concentrations and suppressed miR-122 expression should be considered for prioritized antiviral intervention, even in the presence of normal ALT values.
The inverse correlation observed between miR-122 and pro-inflammatory cytokine concentrations suggests a mechanistic interrelationship. miR-122 modulates hepatic lipid metabolism and toll-like receptor signaling cascades [9]. The progressive depletion of miR-122 may be attributable to hepatocyte apoptosis and concomitant stellate cell activation, potentially establishing a self-perpetuating positive feedback loop of fibrogenesis. Among the cytokines, IL-6 showed the strongest correlation with liver stiffness (ρ = 0.72), and TGF-β was also positively correlated (ρ = 0.65; Table S2), consistent with its well-characterized role as a principal mediator of extracellular matrix deposition [7].
The biphasic expression patterns of IL-10 and IFN-γ, characterized by peak expression at moderate necroinflammatory activity followed by subsequent decline at severe inflammation, are suggestive of immunoregulatory exhaustion, a recognized hallmark of chronic viral infections [17, 23]. Mechanistically, this pattern may reflect an early expansion of regulatory T cells and monocyte-derived IL-10 that restrains necroinflammation during moderate injury, followed at severe stages by progressive exhaustion of effector CD8⁺ T cells (characterized by up-regulation of PD-1, CTLA-4, and TIM-3 and by declining IFN-γ output), together with contraction of the regulatory compartment. The resulting collapse of both effector and regulatory arms would leave fibrogenic signaling (TGF-β, IL-6) unopposed, providing a plausible immunopathological explanation for accelerated fibrosis at stage S3. Clinically, this biphasic signature is not captured by APRI or FIB-4 and may identify a window in which patients with waning IL-10/IFN-γ have already transitioned toward high-risk disease and merit prioritized antiviral therapy; it also nominates immune-checkpoint modulation as a candidate strategy for restoring immunoregulatory competence, a hypothesis requiring dedicated mechanistic study.
The present study possesses several methodological strengths, including prospective enrollment with standardized protocols, comprehensive multi-analyte biomarker profiling, and universal application of transient elastography for fibrosis staging. However, several limitations warrant acknowledgment. The cross-sectional design precludes establishment of causal relationships; longitudinal validation is currently underway. The healthy control group, although demographically matched, may not be fully representative of the general population. Fibrosis staging by transient elastography was not corroborated by histological assessment. Moreover, the composite score was developed and evaluated within a single cohort without an independent internal or external validation set, so its apparent performance may be optimistic and requires confirmation in a separate population. Because transient elastography, rather than liver biopsy, was used as the fibrosis reference standard, it does not constitute a true histological gold standard and may itself misclassify fibrosis in the presence of active necroinflammation. The geographic restriction of the study population to Iraqi centers limits the generalizability of these findings to other HBV genotypes and ethnic populations. The study did not assess therapeutic outcomes, and future investigations are warranted to determine whether biomarker-guided treatment strategies confer clinical benefit.
Future investigations should encompass prospective multicenter studies to validate the composite score across diverse populations and HBV genotypes. Longitudinal studies conducted during antiviral therapy may facilitate early identification of treatment responders. Incorporation of emerging biomarkers, such as hepatitis B core-related antigen and serum HBV RNA [24], into the predictive model may further enhance its prognostic accuracy. Elucidation of the regulatory mechanisms governing miR-122 expression may reveal novel therapeutic targets for antifibrotic intervention.
HBeAg positivity, elevated pro-inflammatory cytokine concentrations, and suppressed miR-122 expression constitute an integrated molecular triad that correlates with fibro-inflammatory severity in CHB. This three-biomarker panel may complement elastography for fibrosis assessment, particularly where elastography is unavailable, and may inform therapeutic decision-making regarding antiviral intervention. Prospective validation of this triad is warranted to determine whether biomarker-guided therapeutic modulation confers clinical benefit in CHB patients.
ALT: alanine aminotransferase
APRI: aspartate aminotransferase/platelet ratio index
AST: aspartate aminotransferase
AUC: area under the receiver operating characteristic curve
CAP: controlled attenuation parameter
CHB: chronic hepatitis B
CI: confidence interval
FIB-4: fibrosis-4 index
HBeAg: hepatitis B e-antigen
HBV: hepatitis B virus
HCC: hepatocellular carcinoma
IFN-γ: interferon-gamma
IL-6: interleukin-6
IQR: interquartile range
LSMs: liver stiffness measurements
miR-122: microRNA-122
OR: odds ratio
ROC: receiver operating characteristic
TGF-β: transforming growth factor-beta
TNF-α: tumor necrosis factor-alpha
The supplementary tables for this article are available at: https://www.explorationpub.com/uploads/Article/file/1003270_sup_1.pdf.
The authors gratefully acknowledge the contributions of the nursing and laboratory personnel at the participating hospitals for their invaluable assistance in patient recruitment and specimen processing.
ZNA: Conceptualization, Methodology, Investigation, Formal analysis, Writing—original draft. MAK: Conceptualization, Supervision, Validation, Writing—review & editing. YHM: Resources, Data curation, Writing—review & editing. All authors read and approved the submitted version.
The authors declare that there are no conflicts of interest.
The study protocol was approved by the Scientific and Ethical Committee of the Iraqi Board for Medical Specializations (Ref. 2023-HEP-11), an institution distinct from the funding body; the shared “HEP-11” suffix reflects independent departmental coding and is coincidental. Supporting documentation is available on request. This study complies with the Declaration of Helsinki.
Informed consent to participation in the study was obtained from all participants.
Not applicable.
The datasets supporting the findings of this study are available from the corresponding author upon reasonable request.
This work was supported by grant No. 2024-HEP-11 from the Ministry of Higher Education and Scientific Research, Republic of Iraq. The funders had no role in study design, data collection and analysis, decision to publish, or preparation of the manuscript.
© The Author(s) 2026.
Open Exploration maintains a neutral stance on jurisdictional claims in published institutional affiliations and maps. All opinions expressed in this article are the personal views of the author(s) and do not represent the stance of the editorial team or the publisher.
Copyright: © The Author(s) 2026. This is an Open Access article licensed under a Creative Commons Attribution 4.0 International License (https://creativecommons.org/licenses/by/4.0/), which permits unrestricted use, sharing, adaptation, distribution and reproduction in any medium or format, for any purpose, even commercially, as long as you give appropriate credit to the original author(s) and the source, provide a link to the Creative Commons license, and indicate if changes were made.



View: 72
Download: 6
Times Cited: 0