Original Article

Affiliation:
1Department of Food Process Engineering, National Institute of Technology, Odisha 769008, India
ORCID: https://orcid.org/0000-0003-4312-7442
Affiliation:
1Department of Food Process Engineering, National Institute of Technology, Odisha 769008, India
ORCID: http://orcid.org/0000-0002-5652-7114
Affiliation:
2Vetio Animal Health, Jupiter, FL 33478, USA
ORCID: http://orcid.org/0000-0002-8942-0778
Affiliation:
1Department of Food Process Engineering, National Institute of Technology, Odisha 769008, India
Email: sksingh32325@gmail.com; singhsk@nitrkl.ac.in
ORCID: http://orcid.org/0000-0001-9826-2508
Explor Foods Foodomics. 2023;1:272–287 DOI: https://doi.org/10.37349/eff.2023.00021
Received: July 21, 2023 Accepted: November 23, 2023 Published: December 29, 2023
Academic Editor: Di Wu, Queen’s University of Belfast, UK
Aim: This study aims to evaluate the sensory profile of corn-based extrudates fortified with phytosterol and pea protein isolates (PPI) using the fuzzy logic technique to assess similarity values and rank the quality attributes.
Methods: Using a mix of yellow PPI (ranging from 0 to 20%) and corn flour (ranging from 80% to 100%), extrudates were developed, ensuring a consistent addition of phytosterol-containing oil at 5%. For this experiment, the Box-Behnken (BB) design was used, comprising 17 runs, factoring in parameters like the percentage of PPI (0–20%), screw speed (300–500 rpm), and temperature (130°–150°C). The optimal conditions were found to be 2.78% PPI, a screw speed of 451 rpm, and a temperature of 150°C, resulting in a desirability value of 0.725. For sensory evaluation, the fuzzy logic technique was used to compare the functional extrudates (S1) with commercial variants (S2, S3, and S4). This helped to gauge acceptance/rejection, similarity values, rankings, and overall consumer acceptability of the extrudates.
Results: Commercial sample S4 achieved the highest ranking on the sensory scale as “very good”. When considering the quality attributes of extrudates, taste and mouthfeel were the most favored, followed by color and flavor. This study underscored the value of using fuzzy logic for sensory evaluation in determining the acceptance of new food products. It also proved effective in assessing food products’ quality attributes, especially after evaluating the phytosterol content post-extrusion.
Conclusions: The fuzzy logic technique in sensory evaluation has effectively identified the optimal extrudates and their quality attributes during the development of new functional food.
In recent years, the demand for ready-to-eat snacks has risen, reflecting shifts in human dietary habits and lifestyles. As consumers grow more health-conscious, the methods used to create snack products have evolved. Among these methods, extrusion cooking technology stands out for its cost-effectiveness, ability to produce snacks in diverse shapes and sizes, reduced energy consumption, and convenience [1–3]. It further contributes to starch gelatinization and protein denaturation [4, 5]. Many snacks in the market are from starch-based sources such as corn, wheat, rice, potato, cassava, and sweet potato [6–9]. However, these starch-based sources are nutritionally poor in terms of protein, minerals, fibers, and bioactive compounds. Additionally, overconsumption of fried starch-based snacks can lead to health issues such as obesity, high blood pressure, cancer, and elevated glycemic levels [10]. Hence, both food scientists and industry are exploring alternatives. This includes combining existing starch-based snacks with plant-based proteins [11, 12], fortification with bioactive compounds, and by-products [13, 14] to enhance nutritional value and mitigate health issues.
Bioactive compounds mainly find application in the development of newer food products, medicine, agriculture, and industry [15]. Phytosterols are plant-based sterol fractions gaining importance in various food applications due to their cholesterol-lowering properties, which aids in lowering hyper-cholesterolemia in human blood serum [16, 17]. They are naturally extracted from oil seeds, fruits, vegetables, cereals, nuts, and microalgae, but they are available in much less quantities, i.e., 180–400 mg. Several studies have reported that consumption of 3 g of phytosterol per day could help to lower the cholesterol level by 12% [18]. Therefore, they must be supplied through dietary supplements, pills, and fortified foods to provide numerous health benefits [19]. However, the application of phytosterols in various food products is still challenging due to their lower solubility (in water and oil), crystalline behavior, and lower bioavailability. Till now, various dairy products, fruit juices, etc., have been fortified with phytosterols. However, studies on fortification of extrudates with phytosterols are scarce [20].
This study will investigate the impact of adding bioactive compounds (phytosterols) and plant-based proteins [pea protein isolates (PPI)] to corn-based extrudates. Along with phytosterol, PPI is incorporated due to its better nutritional properties, greater sustainability, lower cost, non-allergic, and gluten-free nature [21, 22]. It contains around 20–30% protein based on the extraction procedure, genotype, and variety. The use of PPI in various food applications has been gaining importance. For example, Beck et al. [23], Philipp et al. [24], and Philipp et al. [25] studied the fortification of rice-based extrudates with PPI.
During the extrusion process, the raw materials containing carbohydrate, protein, and fat undergo a combination of thermo-mechanical stresses resulting in changes in physicochemical, textural, structural properties, and sensory characteristics of the developed extrudates [6, 7, 26–30]. Most of the properties except sensory evaluation can be measured using standard procedure using different instruments or standard methods. Sensory appeal, particularly taste is an ultimate criterion for consumers for acceptance or rejection of novel food products. Traditional techniques have been used for sensory analysis that can only be perceived by sight, smell, in terms of qualitatively but are unable to provide the analysis in the precise way. Experimental procedures are often too expensive, time-consuming, and may lack a generalized theoretical description of the process [31, 32]. Fuzzy logic technique could be an option, in which arbitrary and subjective data can be analyzed to derive important conclusions regarding acceptance/rejection, strong/weak attributes, and ranking of food products by using single or multiple panelists [33]. Till now, numerous studies have been conducted on the sensory evaluation of food products using fuzzy logic techniques. These include chana poda [34], soup mix [35], millet-based bread enriched with dietary fiber [36], beverages [37], mango beverages [38], litchi drinks [39], milk containing barberry juice [40] and many other food products. In this study, sensory assessment of functional extrudates using the fuzzy logic approach has been reported.
The corn seeds, soybean oil, commercial extruded snacks, and seasonings were procured from the local market in Rourkela, Odisha, India. Yellow PPI was purchased from MyFitFuel Pvt. Ltd., India, and phytosterol (predominantly containing 75% beta-sitosterol and 10% campesterol) was purchased from Thermo Scientific Pvt. Ltd., India.
In this study, soybean oil was selected for phytosterol dispersion based on the previous study conducted by Pavani et al. [41]. Initially, oil was heated at 90°C, and phytosterol in the solid form (1%, w/v) was added into the oil and continuously stirred for 15 mins until phytosterols were completely dissolved in the oil. The resulting oil was considered a functional oil throughout the study.
Prior to extrusion, the composite blends (I, II, and III) were prepared as shown in Table 1. The blends were mixed and maintained at a moisture content of 18%, wet basis. The hydrated blends were kept overnight at room temperature (~25°C) in air-tight containers before the extrusion experiments. A laboratory-scale twin screw extruder (Jinan Saibainuo Machinery Co., Ltd.) with a circular orifice die, and an aperture diameter of 3 mm was used for the extrusion process. The operating power was 14.5 kW, and the barrel length (L) to diameter (D) ratio of the extruder was 24.5. The extruder barrel consists of four zones as shown in Figure 1. The first three zones’ temperatures (T1, T2, T3 from left to right side as shown in Figure 1) were maintained at temperatures of 30°C, 50°C, and 70°C, respectively, whereas the fourth zone temperature T4 was varied from 130°C to 150°C. BB design was used with PPI, screw speed, and temperature of zone four (T) as process parameters (Table 2). A total of 17 experimental runs were carried out with five center points. The extrudates collected after each experiment were dried using a hot air oven at 40°C for 3 h or until constant weight was reached. The extrudates collected at optimum conditions (PPI of 2.78%, screw speed of 451 rpm, and T of 150°C) with a desirability value of 0.725 were selected for conducting sensory studies and are referred to as the functional extrudate (S1) [42].
Ingredient composition of feed blends
| Feed composition | Mass of the ingredients (g kg–1) | ||
|---|---|---|---|
| Blend I | Blend II | Blend III | |
| PPI | 0 | 100 | 200 |
| Corn flour | 950 | 850 | 750 |
| Functional oil | 50 | 50 | 50 |
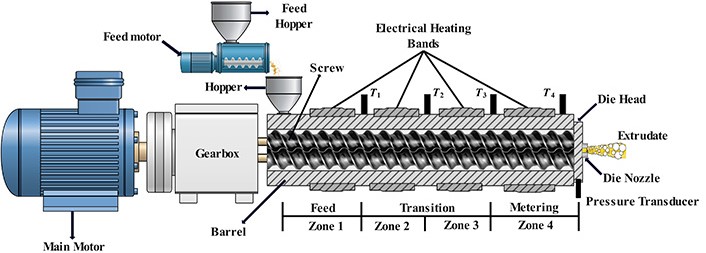
Schematic diagram of the twin screw extruder [42]
Note. Adapted with permission from “Impact of extrusion processing on bioactive compound enriched plant-based extrudates: a comprehensive study and optimization using RSM and ANN-GA,” by Pavani M, Singha P, Rajamanickam DT, Singh SK. Future Foods. 2023;100286 (https://doi.org/10.1016/j.fufo.2023.100286). © 2023 The Author(s).
Independent variables and their levels
| Independent variables | Coded values | ||
|---|---|---|---|
| –1 | 0 | +1 | |
| PPI (%) | 0 | 10 | 20 |
| Screw speed (rpm) | 300 | 400 | 500 |
| Temperature (°C) | 130 | 140 | 150 |
The phytosterol retention (PR) of the functional extrudates was calculated using the procedure of Araújo et al. [43]. Before analysis, the hydroethanolic extract was prepared by maceration of extruded powder with a solvent ratio of 2:10 (%; w/v) for 7 days. Liebermann-Burchard reagent was prepared by mixing 5 mL of sulfuric acid into acetic anhydride (50 mL). 100 mL of hydroethanolic extract which was initially dried at 40°C. Then, the residue was resuspended into 20 mL of chloroform, and the volume was adjusted to 50 mL using the same solvent. From the above solution, 10 mL was added with 2 mL of LB reagent, and absorbance was measured at 625 nm after adding the reagent. The phytosterol content was measured using equation 1:
Cs is the standard concentration, Aa is the absorbance of the sample, and As is the absorbance of the standard.
Before sensory evaluation, all panel members were requested to complete training that was provided on various sensory evaluation terminologies, sampling techniques, sensory scale scoring, selection of quality attributes, sensory scale, different scoring methods, and data interpretation to turn each response into a score.
Sensory evaluation of functional extrudates (S1) and commercial samples (S2, S3, and S4) were conducted to understand the acceptance or rejection of extrudates, similarity values, ranking, and consumer acceptability of the extrudates. Henceforth, functional extrudates (S1) and commercial samples (S2, S3, and S4) will be referred to as “samples” wherever they are mentioned together. The evaluation was conducted with fifteen panelists (nine men and six women between the ages of 25 and 35) from NIT Rourkela, Odisha, India. They were selected based on their interest in sensory evaluation, familiarity with snack products, and willingness to participate in the sensory evaluation. Panelists reported having no illness during the sensory evaluation. Before the experiment, extrudates were placed on paper plates and named randomly. Each panelist was asked to taste the extrudates and provide their preference by a tick mark (√) on the linguistic score sheet. Panelists rinsed their mouth with water between assessments of various extrudates to prevent fatigue and lingering taste.
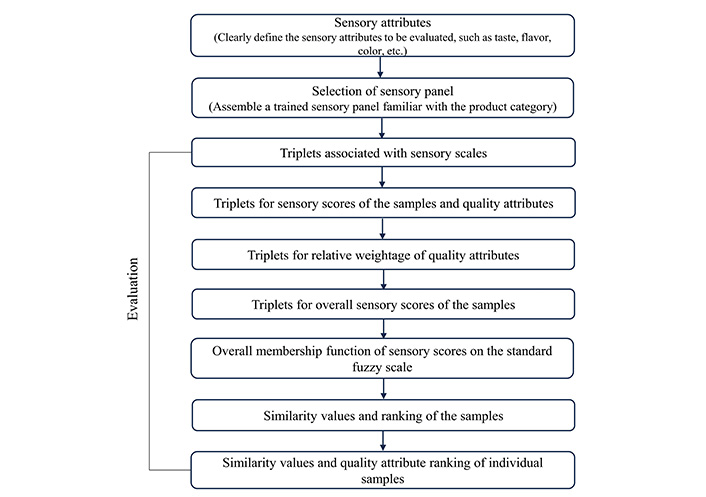
The relationship between independent attributes, i.e., quality characteristics (color, flavor, taste, and mouthfeel), and output variables, i.e., panelist’s preference (acceptance or rejection, similarity values, and ranking), is numerically measured using the fuzzy logic technique. In this process, the score obtained from each panelist was mathematically converted and interpreted into a triangular membership function (MF). Then, each sample and its corresponding quality features were ranked in general and separately. The flow chart (Figure 2) shows the various steps involved in the sensory evaluation of extrudates using the fuzzy logic technique. Triplets of each sample and their corresponding quality attributes were calculated using a sensory scale followed by the overall sensory scores (SS) of samples and quality attributes in general. Next, overall MF values were calculated using a standard fuzzy scale (F). Finally, the similarity values, the ranking of the samples, and their quality parameters were measured.
Triangular MF distribution pattern of sensory scales is represented by a set of three numbers, called “triplet” [44]. Values of triplets associated with triangular membership distribution function for five-point sensory scale are shown in Figure 3. ∆ abc represents membership distribution function for the not satisfactory/not at all important (NI) category, ∆ ac1d represents distribution function for fair/somewhat important (SI) category, etc. The first number of the triplet denotes the coordinate of abscissa at which the value of MF is 1. The second and third numbers of the triplet designate the distance to left and right respectively of the first number where the MF is zero.
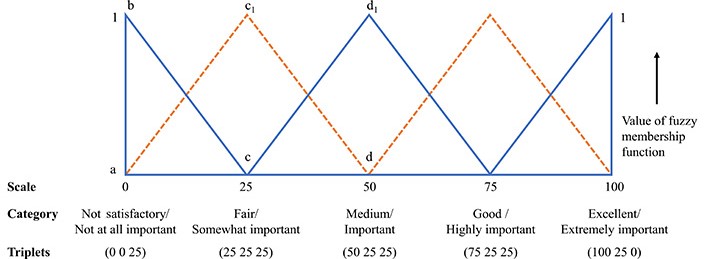
Values of triplets associated with triangular membership distribution function for 5-point sensory scale [44]
Note. Adapted with permission from “Sensory evaluation using fuzzy logic,” by Das H. In: Food processing operations analysis. New Delhi: Asian Books Pvt. Ltd.; 2005. pp. 383–402. © 2005 Publisher.
The triplets for SS of the individual sample were assessed in terms of: (i) the sum of SS; (ii) triplets associated with the sensory scale; and (iii) number of panelists as shown in equation 2:
Where S indicates the triplets for the SS for particular samples (r) for a particular quality attribute (α); r denotes the samples (S1, S2, S3, S4); α denotes sample’s quality attributes, i.e., color (C), flavor (A), taste (T), and mouthfeel (M); n1, n2, n3, n4, and n5 are the number of judges who rated particular sample (r) as unsatisfactory, fair, medium, good, and excellent, respectively on a five-point sensory scale.
Similarly, for a particular quality attribute (color, flavor, taste, and mouthfeel) of the samples in general, the values of triplets QC, QA, QT, and QM were calculated using equation 3:
Where β denotes quality attribute, i.e., color (C), flavor (A), taste (T), and mouthfeel (M); n1, n2, n3, n4, and n5 represents the number of judges opting for specific linguistic scores for the quality attributes in general.
The triplets for the relative weights of the quality attributes were determined to find out the triplets for the overall SS of the samples. Equation 4 was used to calculate triplets for the relative weights for color:
Where Qsum is the sum of the first digits of triplets of all the quality attributes, i.e., QC, QA, QT, and QM, whereas QCrel is triplet for the relative weights for the color. Similarly, triplets for the relative weights for the flavor (QArel), taste (QTrel), and mouthfeel (QMrel) were calculated.
Overall SS of S1 were calculated using equation 5:
Where SO1 specifies the overall SS of S1; S1C, S1A, S1T, and S1M are triplets of the SS of S1 related to color, flavor, taste, and mouthfeel, respectively; QCrel, QArel, QTrel, and QMrel indicates the triplet for the relative weight of the quality attributes of the samples in general. Each term on the right-hand side of equation 5 is a triplet, and the multiplication of the two triplets for e.g., triplet (p q r) and triplet (s t u) is done by following equation 6:
Where triplet is a combination of three integers which is used to represent the distribution patterns of triangular MF. Using the similar procedure, overall SS for other samples, i.e., SO2, SO2, and SO4 were determined.
The triangular distribution pattern of 6-point sensory scale, which will be referred here as “standard fuzzy scale” is shown in Figure 4. The standard fuzzy scale represents six sensory scales namely F1, F2, F3, F4, F5, and F6 where the linguistic terminology for the scale factors has been modified to fit the case of sensory analyses. MF of each of the sensory scales follows triangular distribution pattern where maximum value of membership is 1. Values of MF of Fl through F6 are defined by a set of 10 numbers, which are defined in equation 7:
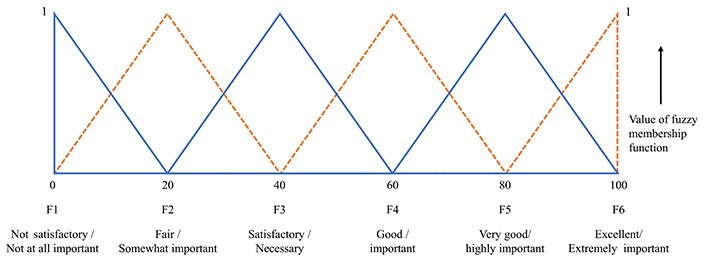
Triangular membership distribution for 6-point sensory scale “standard fuzzy scale” [44]. Values of F1 to F6 are defined by a set of 10 numbers, which are the maximum numbers between each two consecutive points from 0 to 100, which could be defined as “(maximum value of MF observed between 0 and 10), (maximum value of MF observed between 10 and 20), (maximum value of MF observed between 20 and 30), (maximum value of MF observed between 30 and 40), (maximum value of MF observed between 40 and 50), (maximum value of MF observed between 50 and 60), (maximum value of MF observed between 60 and 70), (maximum value of MF observed between 70 and 80), (maximum value of MF observed between 80 and 90), and (maximum value of MF observed between 90 and 100)”
Note. Adapted with permission from “Sensory evaluation using fuzzy logic,” by Das H. In: Food processing operations analysis. New Delhi: Asian Books Pvt. Ltd.; 2005. pp. 383–402. © 2005 Publisher.
Now the values of the MF of the overall SS of samples were determined on the standard fuzzy scale using the triplets of the SS calculated from equation 5. The triplet is a combination of three integers (a b c), which is used to represent the distribution patterns of triangular MF across sensory scale as shown in Figure 5. The value of MF is 1 when the abscissa x is “a” and zero when x is less than (a – b) or greater than (a + c).
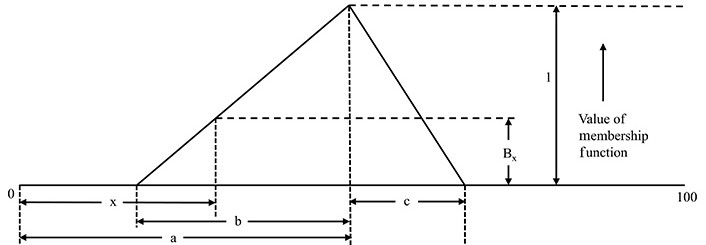
Graphical representation of the triplets (a b c) and its MF [44]
Note. Adapted with permission from “Sensory evaluation using fuzzy logic,” by Das H. In: Food processing operations analysis. New Delhi: Asian Books Pvt. Ltd.; 2005. pp. 383–402. © 2005 Publisher.
For a given value of x on abscissa, value of MF, Bx was calculated using equation 8:
For each of the samples and its triplet associated with overall SS, the value of MF Bx at x = 0, 10, 20, 30, 40, 50, 60, 70, 80, 90, and 100 was calculated using equation 8. The value of the MF of the overall SS of each sample on the standard fuzzy scale is also determined by a set of 10 numbers, which are the maximum values of Bx in the 10 intervals from 0 to 100 in the mentioned range of x between (a − b) and (a + c). Hence, ten intervals, where membership values of Bx are calculated, comprise “0 < x < 10, 10 < x < 20, 20 < x < 30, 30 < x < 40, 40 < x < 50, 50 < x < 60, 60 < x < 70, 70 < x < 80, 80 < x < 90, 90 < x < 100”.
The values of the MF of each sample, i.e., B1, B2, B3, and B4 were compared with the values of the MF of the standard scale, i.e., F1, F2, F3, F4, F5, and F6 given in equation 7. Each of the terms B1, B2, B3, B4, F1, F2, F3, F4, F5, and F6 represent a row matrix having 10 elements.
The similarity values of the samples B were calculated using equation 9 [44]. Afterward, the similarity values of four samples were compared, and then the sample with the higher similarity value was considered extremely important (EI):
Where Sm represents the similarity value of the sample Bx; Fj represents F1, F2, F3, F4, F5; Bx is the MF value for sample x on the standard fuzzy scale;
A similar procedure was followed to find out the ranks of four quality attributes for each of the samples S1, S2, S3, and S4. The only difference is that Qsum is obtained by calculating the average of the first digit of the triplets of QC, QA, QT, and QM.
Phytosterols are sterols derived from plants, similar to cholesterol in terms of structure. Their degradation mainly depends on factors including temperature, mositure, light, processing conditions, and storage. Various studies have shown that high-temperature processing techniques like heating, baking, and frying result in phytosterols’ degradation and form various free radicals. In this study, the PR of the extrudates ranged from 0.4832 g/100 g to 0.9532 g/100 g. The highest PR was observed at an extrusion temperature of 130°C, whereas the lowest was observed at a temperature of 150°C. This might be because phytosterols were unstable/degraded and oxidized at elevated temperature, generating free radicals [45]. In another study, vitamin B12 in extrudates degraded at higher temperatures and lost completely at 190°C during the extrusion process [46]. Various food products fortified with phytosterol including cheese spread from goat milk, functional fermented maize yogurt, and fermented cereal products showed degradation of phytosterols at elevated extrusion temperature [16, 47, 48].
The sum of the SS given by panelists/judges and the triplets associated to the quality attributes of different samples are given in Table 3 and sum of the SS for the quality attributes for the samples in general is given in Table 4. The relative attributes of the samples were measured using five-point sensory scale factors. Sensory scale factors were used to calculate general quality attributes like NI, SI, important (I), highly important (HI), and EI. Next, the quality attributes and relative weights were determined using equation 3. Finally, the overall scores of the samples were estimated by multiplying the triplets of quality attributes of the samples and relative weights of quality attributes of the samples using the multiplication rule as given in equation 6. The overall SS of individual samples calculated in the form of triplets are given below:
Sum of SS for the quality attributes of the samples and its associated triplets
| Sensory attributes | Samples | Not satisfactory | Fair | Medium | Good | Excellent | Triplets associated with the sensory scale |
|---|---|---|---|---|---|---|---|
| Color | S1 | 2 | 3 | 9 | 1 | 0 | (40.00 21.67 25.00) |
| S2 | 0 | 0 | 1 | 11 | 3 | (78.33 25.00 20.00) | |
| S3 | 0 | 0 | 3 | 3 | 9 | (85.00 25.00 10.00) | |
| S4 | 0 | 1 | 1 | 3 | 10 | (86.67 25.00 8.33) | |
| Flavor | S1 | 1 | 4 | 2 | 5 | 3 | (58.33 23.33 20.00) |
| S2 | 0 | 1 | 4 | 7 | 3 | (70.00 25.00 20.00) | |
| S3 | 1 | 2 | 1 | 8 | 3 | (66.67 23.33 20.00) | |
| S4 | 0 | 0 | 4 | 7 | 4 | (75.00 25.00 18.33) | |
| Taste | S1 | 0 | 4 | 7 | 3 | 1 | (51.67 25.00 23.33) |
| S2 | 0 | 0 | 3 | 11 | 1 | (71.67 25.00 23.33) | |
| S3 | 0 | 3 | 3 | 5 | 4 | (66.67 25.00 18.33) | |
| S4 | 0 | 2 | 5 | 4 | 4 | (66.67 25.00 18.33) | |
| Mouthfeel | S1 | 0 | 4 | 6 | 3 | 2 | (55.00 25.00 21.67) |
| S2 | 0 | 0 | 2 | 11 | 2 | (75.00 25.00 21.67) | |
| S3 | 0 | 1 | 3 | 7 | 4 | (73.33 25.00 18.33) | |
| S4 | 0 | 1 | 4 | 6 | 4 | (71.67 25.00 18.33) |
Sum of SS for the quality attributes of the samples in general and triplets associated with the SS and relative weights of the quality attributes of the samples in general
| Quality attribute | NI | SI | I | HI | EI | Triplets | |
|---|---|---|---|---|---|---|---|
| SS | RW | ||||||
| Color | 0 | 0 | 6 | 5 | 4 | (71.67 25.00 18.33) | (0.24 0.08 0.06) |
| Flavor | 0 | 3 | 5 | 5 | 2 | (60.00 25.00 21.67) | (0.20 0.08 0.07) |
| Taste | 0 | 0 | 1 | 9 | 5 | (81.67 25.00 16.68) | (0.27 0.08 0.06) |
| Mouthfeel | 0 | 0 | 1 | 6 | 8 | (86.67 25.00 11.68) | (0.29 0.08 0.039) |
RW: relative weightage
SO1 = (51.1759 40.9537 34.2500)
SO2 = (73.8889 49.5833 38.1296)
SO3 = (72.9722 48.9722 33.2407)
SO4 = (74.5556 50.0000 33.1481)
Where SO1, SO2, SO3, and SO4 are the overall SS of the samples S1, S2, S3, and S4, respectively.
The values and symbols of the six-point scale MF are shown in equation 7.
The value of the MF of the overall SS of each sample on the standard fuzzy scale at x = 0 to 100 were calculated using equation 8, and the values are as shown below:
B1 = (0, 0.2388, 0.4829, 0.7271, 0.9713, 1, 0.7424, 0.4504, 0.1584, 0)
B2 = (0, 0, 0.1148, 0.3165, 0.5182, 0.7199, 0.9216, 1, 0.8397, 0.5775)
B3 = (0, 0, 0.1225, 0.3267, 0.5309, 0.7351, 0.9393, 1, 0.7886, 0.4877)
B4 = (0, 0, 0.1089, 0.3089, 0.5089, 0.7089, 0.9089, 1, 0.8358, 0.5341)
The similarity values (Sm) and the ranking of the food products indicate the comparative importance of all the quality characteristics that aid in acceptance/rejection. Similarity values of the samples were calculated by combining the MF values of the standard fuzzy logic scale (F’s) and the overall MF values of the SS (B’s) using equation 9 and the calculated values are shown in Table 5. For example, the similarity values of S1 were calculated as 0, 0.0337, 0.3064, 0.6890, 0.6927, 0.2767, and 0.0224, which were not satisfactory, fair, satisfactory, good, very good, and excellent respectively. Thus, the overall SS of S1 was good due to its high Sm value. Similarly, S2, S3, and S4 were very good with Sm values of 0.6835, 0.6788, and 0.6952, respectively as shown in Table 5.
Similarity values of the samples under various scale factors
| Scale factor | Similarity values (Sm) | |||
|---|---|---|---|---|
| S1 | S2 | S3 | S4 | |
| Not satisfactory, F1 | 0.0337 | 0 | 0 | 0 |
| Fair, F2 | 0.3064 | 0.0721 | 0.0776 | 0.0716 |
| Satisfactory, F3 | 0.6890 | 0.3305 | 0.3490 | 0.3335 |
| Good, F4 | 0.6927 | 0.6337 | 0.6619 | 0.6449 |
| Very good, F5 | 0.2767 | 0.6835 | 0.6788 | 0.6952 |
| Excellent, F6 | 0.0224 | 0.2633 | 0.2393 | 0.2588 |
Similar procedure was used for ranking of quality attributes (color, flavor, taste, and mouthfeel) for the evaluation of the samples in general. Triplets of overall SS for quality attributes were calculated in equation 3. Using the method of computation mentioned earlier and denoting BC, BA, BT, and BM as overall SS on the standard fuzzy scale, for color, flavor, taste, and mouthfeel, respectively we get:
BC = (0, 0, 0, 0, 0.1333, 0.5333, 0.9333, 1, 0.5455, 0)
BA = (0, 0, 0, 0.2, 0.6, 1, 1, 0.5385, 0.0769, 0)
BT = (0, 0, 0, 0, 0, 0.1333, 0.5333, 0.9333, 1, 0.5)
BM = (0, 0, 0, 0, 0, 0, 0.3333, 0.7333, 1, 0.7143)
Similarity values, Sm of all the four quality attributes (color, flavor, taste, and mouthfeel) were calculated and are presented in Table 6.
Similarity values of quality attributes of samples in general
| Scale factor | Color | Flavor | Taste | Mouthfeel |
|---|---|---|---|---|
| Not at all necessary, F1 | 0 | 0 | 0 | 0 |
| Somewhat necessary, F2 | 0 | 0.0371 | 0 | 0 |
| Necessary, F3 | 0.1600 | 0.4822 | 0.0267 | 0 |
| I, F4 | 0.8133 | 0.9530 | 0.4533 | 0.2800 |
| HI, F5 | 0.8048 | 0.4137 | 0.9800 | 0.9029 |
| EI, F6 | 0.1104 | 0.0143 | 0.4127 | 0.5624 |
Similarity values of the four quality attributes of each sample against six-point sensory scales, i.e., not satisfactory, fair, satisfactory, good, very good, and excellent were calculated using equations 7, 8, and 9. Using the method of computation mentioned earlier and denoting BC1, BA1, BT1, and BM1 as overall SS on standard fuzzy scale, for color, flavor, taste, and mouthfeel, respectively, for S1 we get:
BC1 = (0.1708, 0.4646, 0.7584, 1, 0.9472, 0.6502, 0.3531, 0.0561, 0, 0)
BA1 = (0.0379, 0.3003, 0.5627, 0.8251, 1, 0.8985, 0.5941, 0.2897, 0, 0)
BT1 = (0, 0.1842, 0.4092, 0.6342, 0.8592, 1, 0.8986, 0.6275, 0.3564, 0.0853)
BM1 = (0, 0.0776, 0.2894, 0.5012, 0.7129, 0.9247, 1, 0.8082, 0.5105, 0.2128)
Similarly, overall SS for all the quality attributes of S2, S3, and S4 were calculated and are given below.
For S2:
BC2 = (0, 0, 0.1030, 0.3030, 0.5030, 0.7030, 0.9030, 1, 0.8654, 0.6041)
BA2 = (0, 0.1692, 0.4000, 0.6308, 0.8615, 1, 0.8896, 0.6135, 0.3374, 0.0613)
BT2 = (0, 0, 0.0601, 0.2558, 0.4514, 0.6471, 0.8428, 1, 0.9525, 0.7106)
BM2 = (0, 0, 0, 0.1340, 0.3196, 0.5052, 0.6907, 0.8763, 1, 0.9092)
For S3:
BC3 = (0, 0, 0.0191, 0.2106, 0.4021, 0.5936, 0.7851, 0.9766, 1, 0.7106)
BA3 = (0, 0.1848, 0.4293, 0.6739, 0.9185, 1, 0.8109, 0.5273, 0.2437, 0)
BT3 = (0, 0, 0.1386, 0.3408, 0.5431, 0.7453, 0.9476, 1, 0.7870, 0.4995)
BM3 = (0, 0, 0, 0.1611, 0.3486, 0.5361, 0.7236, 0.9111, 1, 0.8386)
For S4:
BC4 = (0, 0, 0, 0.1888, 0.3782, 0.5677, 0.7572, 0.9467, 1, 0.7535)
BA4 = (0, 0.1111, 0.3333, 0.5556, 0.7778, 1.0000, 1, 0.7248, 0.4495, 0.1743)
BT4 = (0, 0, 0.1386, 0.3408, 0.5431, 0.7453, 0.9476, 1, 0.7870, 0.4995)
BM4 = (0, 0, 0, 0.1888, 0.3782, 0.5677, 0.7572, 0.9467, 1, 0.7778)
The similarity values of each quality attribute of the samples S1, S2, S3, and S4 are shown in Table 7.
Similarity values for the quality attributes of all the samples S1, S2, S3, and S4
| Sensory scale | Color | Flavor | Taste | Mouthfeel |
|---|---|---|---|---|
| Functional extrudate (S1) | ||||
| Not satisfactory, F1 | 0.1234 | 0.0564 | 0.0250 | 0.0106 |
| Fair, F2 | 0.5534 | 0.3883 | 0.2476 | 0.1686 |
| Satisfactory, F3 | 0.8113 | 0.7667 | 0.5977 | 0.4971 |
| Good, F4 | 0.4605 | 0.6413 | 0.7185 | 0.7330 |
| Very good, F5 | 0.0712 | 0.1760 | 0.4014 | 0.5255 |
| Excellent, F6 | 0 | 0 | 0.0717 | 0.1278 |
| Commercial sample (S2) | ||||
| Not satisfactory, F1 | 0 | 0.0234 | 0 | 0 |
| Fair, F2 | 0.0673 | 0.2448 | 0.0493 | 0.0194 |
| Satisfactory, F3 | 0.3199 | 0.6066 | 0.2782 | 0.2049 |
| Good, F4 | 0.6239 | 0.7269 | 0.5809 | 0.5204 |
| Very good, F5 | 0.6931 | 0.3947 | 0.7156 | 0.7764 |
| Excellent, F6 | 0.2744 | 0.0637 | 0.3112 | 0.4088 |
| Commercial sample (S3) | ||||
| Not satisfactory, F1 | 0 | 0.0263 | 0 | 0 |
| Fair, F2 | 0.0343 | 0.2709 | 0.0823 | 0.0231 |
| Satisfactory, F3 | 0.2529 | 0.6570 | 0.3533 | 0.2227 |
| Good, F4 | 0.5691 | 0.7216 | 0.6567 | 0.5411 |
| Very good, F5 | 0.7497 | 0.3351 | 0.6690 | 0.7710 |
| Excellent, F6 | 0.3331 | 0.0347 | 0.2380 | 0.3833 |
| Commercial sample (S4) | ||||
| Not satisfactory, F1 | 0 | 0.0146 | 0 | 0 |
| Fair, F2 | 0.0267 | 0.1903 | 0.0823 | 0.0264 |
| Satisfactory, F3 | 0.2405 | 0.5270 | 0.3533 | 0.2380 |
| Good, F4 | 0.5617 | 0.7250 | 0.6567 | 0.5558 |
| Very good, F5 | 0.7637 | 0.4642 | 0.6690 | 0.7591 |
| Excellent, F6 | 0.3543 | 0.1052 | 0.2380 | 0.3574 |
From Table 5, it was observed that S4 had the maximum similarity value of 0.6952 (very good category) among all the samples. S2 and S3 were also found in the “very good” category with similarity values of 0.6835 and 0.6788, and S1 was in the “good” category with a value of 0.6927. The ranking order for the extrudate samples is as follows: S4 (very good) > S2 (very good) > S3 (very good) > S1 (good), i.e., commercial sample (S4) was the most accepted extruded sample by all panelists/judges followed by S2, S3, and S1.
From Table 6, it was observed that compared to taste and mouthfeel, color and flavor have less impact on assessing the quality attributes which fell under the I category. Taste and mouthfeel were under the HI category. These results led to the following general rankings of quality attributes for the samples: taste (HI) > mouthfeel (HI) > flavor (I) > color (I).
For functional extrudate sample (S1), Sm values for mouthfeel and taste were found to be 0.7330 and 0.7185 respectively under “good” category while for color and flavor these values were 0.8113 and 0.7667, respectively, and were under “satisfactory” category. Therefore, taste is the strongest quality of functional extrudate sample (S1) while its flavor is the weakest. Hence, improvement in the flavor of the functional extrudates can help to increase its marketability. For the other three commercial samples (S2, S3, and S4), color, taste, and mouthfeel fall under “very good” category while flavor falls under “good” category.
The sensory characteristics of functional extrudates were assessed based on their quality attributes, using the fuzzy logic technique. Before the sensory analysis was conducted, functional extrudates were developed by twin screw extrusion process of phytosterol enriched corn and pea protein. Functional extrudates (S1) were compared with commercial samples (S2, S3, and S4). Among these, S4 achieved the top rank, with a sensory scale labeled as “very good” and a similarity value of 0.6952. It was followed by S2, then S3, and finally the functional extrudates (S1). The overall SS for the samples, as obtained from the similarity values are:
S1: mouthfeel (good) > taste (good) > color (satisfactory) > flavor (satisfactory)
S2: mouthfeel (very good) > taste (very good) > color (very good) > flavor (good)
S3: mouthfeel (very good) > color (very good) > taste (very good) > flavor (good)
S4: color (very good) > mouthfeel (very good) > taste (very good) >aroma (good)
EI: extremely important
HI: highly important
I: important
MF: membership function
NI: not at all important
PPI: pea protein isolates
PR: phytosterol retention
SI: somewhat important
SS: sensory scores
The authors are grateful to the Centralized Research Facility (CRF) of NIT Rourkela for allowing them to use analytical instruments.
MP: Writing—original draft. PS: Conceptualization, Formal analysis, Validation, Writing—review & editing. DTR: Writing—review & editing. SKS: Methodology, Formal analysis, Validation, Conceptualization, Funding acquisition, Supervision, Project administration, Writing—review & editing.
The authors declare that they have no conflicts of interest.
Not applicable.
Not applicable.
Not applicable.
Datasets are available from the corresponding author upon reasonable request.
This work is funded by the Science and Engineering Research Board [SRG/2019/000998], New Delhi, India. The funders had no role in study design, data collection and analysis, decision to publish, or preparation of the manuscript.
© The Author(s) 2023.
Copyright: © The Author(s) 2023. This is an Open Access article licensed under a Creative Commons Attribution 4.0 International License (https://creativecommons.org/licenses/by/4.0/), which permits unrestricted use, sharing, adaptation, distribution and reproduction in any medium or format, for any purpose, even commercially, as long as you give appropriate credit to the original author(s) and the source, provide a link to the Creative Commons license, and indicate if changes were made.