 Original Article


Affiliation:
Department of Food Science and Nutrition, Kyungpook National University, Daegu 41566, Korea
ORCID: https://orcid.org/0009-0000-8088-451X

 ,
Affiliation:
Department of Food Science and Nutrition, Kyungpook National University, Daegu 41566, Korea
ORCID: https://orcid.org/0000-0002-0518-3390
,
Affiliation:
Department of Food Science and Nutrition, Kyungpook National University, Daegu 41566, Korea
Email: meerak@knu.ac.kr
ORCID: https://orcid.org/0000-0002-5600-1358

Explor Foods Foodomics. 2026;4:1010203 DOI: https://doi.org/10.37349/eff.2026.1010203
Received: April 08, 2026 Accepted: September 08, 2026 Published: November 16, 2026
Academic Editor: Ammar Altemimi, University of Basrah, Iraq
Aim: This study aimed to investigate the effects of lactic acid fermentation on the antioxidant properties and inhibition of nitric oxide production of extracts prepared from elderberry (Sambucus nigra) slurry.
Methods: Elderberry slurry was fermented with Lactobacillus plantarum, and water and 70% ethanol extracts were then prepared from non-fermented and fermented elderberry slurries. Total sugar, reducing sugar, vitamin C, total polyphenol, and flavonoid contents were determined, and antioxidant activities were evaluated using 2,2-diphenyl-1-picrylhydrazyl (DPPH), 2,2’-azino-bis(3-ethylbenzothiazoline-6-sulfonic acid) (ABTS) radical scavenging assays, and ferric reducing antioxidant power (FRAP).
Results: Fermentation significantly increased total polyphenol and flavonoid contents compared to non-fermented extracts. Correspondingly, fermented samples exhibited enhanced antioxidant activities, as evidenced by increased DPPH and ABTS radical scavenging activities and FRAP. In addition, fermented extracts showed significantly greater inhibition of nitric oxide production in LPS-stimulated RAW 264.7 macrophages, indicating enhanced inhibition of nitric oxide production.
Conclusions: Fermentation with Lactobacillus plantarum enhanced the bioactive compound content and antioxidant properties of elderberry extracts. These findings suggest that extracts prepared from fermented elderberry slurry may serve as potential functional food-related materials with enhanced antioxidant properties and inhibition of nitric oxide production under in vitro conditions.
Elderberry (Sambucus nigra) is widely recognized as a rich source of polyphenols and other bioactive compounds with antioxidant and health-promoting properties. Elderberry, a small purple-black fruit, is a well-known source of bioactive components, predominantly flavonols, phenolic acids, and anthocyanins [1, 2]. Polyphenols are present in various parts of the plant, including the leaves, fruits, and flowers, with the fruit being especially rich in isoquercetin, rutin, and cyanidin derivatives [1]. In addition, elderberry has been reported to regulate reactive oxygen species and may help prevent or mitigate oxidative stress-related diseases, including diabetes, cardiovascular disease, and cancer [3].
To further enhance these health benefits, fermentation with lactic acid bacteria has been investigated as a promising bioprocessing strategy for plant-derived materials, including elderberry. Lactic acid bacteria are known to produce antimicrobial substances such as organic acids, acetoin, and bacteriocins, which can prolong the shelf life of foods and inhibit the growth of pathogenic bacteria [4]. Galdeano et al. [5] demonstrated that milk fermented with Lactobacillus casei enhanced immune responses and increased resistance to infections, suggesting similar potential for other fermented products. Among lactic acid bacteria, Lactobacillus plantarum is well known for its high lactic acid production, robust fermentation performance, and ability to hydrolyze plant cell wall components, thereby releasing bound bioactive compounds [6]. Fermentation of natural products using microorganisms has been shown to increase the bioavailability of bioactive substances, as microbial hydrolytic enzymes can release compounds bound within plant cell structures [7]. Chae et al. [8] demonstrated that lactic acid fermentation of blueberry, black raspberry, and mulberry improved both functional efficacy and flavor. Jiménez-López et al. [9] reported enhanced phenolic content and antioxidant activity in fermented caperberries. Moreover, Kim and Hong [10] confirmed that fermentation of acai berry extract with lactic acid bacteria improved antioxidant properties.
Although elderberry has been studied primarily for its antioxidant and physiological effects, research on the lactic acid fermentation of elderberry remains limited. In particular, little information is available on how L. plantarum fermentation affects elderberry extracts prepared with different solvents. Therefore, this study aimed to compare the bioactive compounds, antioxidant activities, and inhibition of nitric oxide production of water and 70% ethanol extracts prepared from non-fermented and fermented elderberry slurries.
Elderberries (S. nigra L.) used in this study were obtained from Jangsu-gun (Daoni Farm), Korea. The reagents used in this study included 2,2-diphenyl-1-picrylhydrazyl (DPPH), 2,2’-azino-bis(3-ethylbenzothiazoline-6-sulfonic acid) (ABTS), Folin–Ciocalteu’s phenol reagent, L-ascorbic acid, gallic acid, cyanidin chloride, quercetin, and dimethyl sulfoxide (DMSO), which were purchased from Sigma-Aldrich (St. Louis, MO, USA). Roswell Park Memorial Institute medium (RPMI-1640, with L-glutamine), fetal bovine serum (FBS), penicillin–streptomycin solution, and 0.25% trypsin–EDTA solution were obtained from Gibco BRL (Rockville, MD, USA). De Man–Rogosa–Sharpe (MRS) broth was purchased from Oxoid Ltd. (Hampshire, UK). RAW 264.7 macrophages (murine macrophage cell line) were obtained from the Korean Cell Line Bank (KCLB, Seoul, Republic of Korea; KCLB No. 40071, Lot No. 79041). The specific cell lot was accompanied by complete quality-control records from KCLB, including a confirmed negative result for mycoplasma contamination. Given that the cells were used shortly after receipt, independent short tandem repeat (STR) profiling and additional mycoplasma testing were not performed in our laboratory.
L. plantarum KCTC 3108 used in this study was obtained from the Korean Collection for Type Cultures (KCTC), Korea Research Institute of Bioscience and Biotechnology (KRIBB) (Daejeon, Republic of Korea). Fresh elderberries were crushed using a stomacher (LS-400A, BNF Korea Co., Gimpo, Korea) for 10 min and pasteurized at 65°C for 30 min in a temperature-controlled chamber without pressurization. The pH of the elderberry slurry was adjusted to 6.5 using 1 N NaOH. L. plantarum was pre-cultured in MRS broth at 37°C for 24 h, and 3% (v/w) of the culture was inoculated into the elderberry slurry. The inoculated slurry was incubated at 37°C for 72 h under static conditions for lactic acid fermentation.
Hot water and 70% ethanol extracts were prepared from non-fermented and fermented elderberry slurries using the same extraction procedures. The non-fermented samples were prepared from elderberry slurry and subjected to the same extraction procedures as the fermented samples, except for the lactic acid fermentation step. For the water extracts, each slurry was mixed with tenfold distilled water and incubated in a water bath (WSB-45, DAIHAN Scientific Co., Ltd., Wonju, Korea) at 60°C for 12 h. For the 70% ethanol extracts, each slurry was mixed with tenfold 70% ethanol and extracted at 25°C for 12 h. Seventy percent ethanol was selected as an extraction solvent because aqueous ethanol is commonly used to extract phenolic compounds, flavonoids, and anthocyanin-related compounds from plant materials. The use of both water and 70% ethanol also allowed comparison of solvent-dependent differences in the recovery of elderberry bioactive compounds. The non-fermented water and 70% ethanol extracts were designated as EW (elderberry water extract) and EE (elderberry 70% ethanol extract), respectively, whereas the fermented water and 70% ethanol extracts were designated as FEW (fermented elderberry water extract) and FEE (fermented elderberry 70% ethanol extract), respectively.
To determine viable cell counts, 1 mL of fermented sample was diluted with 9 mL of 0.85% NaCl solution and serially diluted tenfold. A 100 μL aliquot was spread onto MRS agar plates and incubated at 37°C for 24 h. Colony-forming units (CFU) were counted and expressed as CFU/mL. The pH of the samples was measured in triplicate using a pH meter (CH-340, Mettler-Toledo Inc., Switzerland).
Total sugar content was determined using the phenol–sulfuric acid method [11], and reducing sugar content was measured using the 3,5-dinitrosalicylic acid (DNS) method [12]. Briefly, 1 mL of sample was mixed with 5% phenol and concentrated sulfuric acid, and absorbance was measured at 470 nm. For reducing sugar analysis, samples were reacted with DNS reagent in a boiling water bath for 5 min, cooled to 28°C, and absorbance was measured at 575 nm. Glucose was used as the standard for calibration.
Total polyphenol content was determined using the Folin–Ciocalteu method [13] and expressed as mg gallic acid equivalents (GAE)/g extract. The Folin–Ciocalteu method was selected as a conventional colorimetric assay widely used to estimate total phenolic content in plant extracts and to allow comparison with previous studies on fruit and fermented plant materials. Total flavonoid content was measured according to the method described by Moreno et al. [14] and expressed as mg quercetin equivalents (QE)/g extract. Total vitamin C content was determined using the 2,4-dinitrophenylhydrazine (DNPH) method according to the Korean Food Standards Codex (MFDS) [15] and expressed as mg ascorbic acid equivalents per 100 g extract. Unless otherwise specified, the compositional values were expressed on the basis of the prepared extracts.
Phenolic compounds in elderberry extracts were analyzed by HPLC using a Prominence HPLC system (Shimadzu Co., Kyoto, Japan) equipped with a UV–Vis detector. Gallic acid, myricetin, rutin, quercetin, and cyanidin chloride were used as authentic standards and prepared at a concentration of 1 mg/mL. The test solution was prepared by dissolving 10 mg of freeze-dried elderberry extract in 3 mL of distilled water and filtering the solution through a 0.45 μm syringe filter prior to injection. Chromatographic separation was performed on a C18 reversed-phase column maintained at 30°C. The mobile phase consisted of solvent A, 2% acetic acid in water, and solvent B, 2% acetic acid in methanol. Acetic acid was included in the mobile phase to maintain acidic chromatographic conditions and to help maintain the stability of cyanidin derivatives during HPLC analysis. The flow rate was 1.0 mL/min, and the injection volume was 10 μL. Gradient elution was carried out as follows: 0–15 min, 75% A and 25% B; 20 min, 50% A and 50% B; 35 min, 30% A and 70% B; and 50 min, 0% A and 100% B. Detection was performed at 265 nm for gallic acid, 370 nm for rutin, quercetin, and myricetin, and 510 nm for cyanidin chloride. Data collection and analysis were performed using Shimadzu Class-VP SP1 software, version 6.14. The detected phenolic compounds were tentatively assigned by comparing their retention times with those of the corresponding authentic standards analyzed under the same chromatographic conditions. Quantification was performed using external standard calibration, and phenolic compound content was expressed as mg/100 g extract on a freeze-dried extract basis. Because each sample was analyzed once by HPLC, the results were used as preliminary compositional data and were not subjected to statistical analysis.
DPPH radical scavenging activity was measured according to the method described by Blois [16]. Briefly, 2 mL of 7.5 × 10⁻⁵ M DPPH solution was mixed with 1 mL of sample dissolved in 0.1 M sodium acetate buffer and reacted at 37°C for 30 min. Absorbance was measured at 517 nm using a UV–Vis spectrophotometer (UV-1800, Shimadzu, Japan). L-ascorbic acid was used as the control. DPPH radical scavenging activity (%) was calculated as follows: (Abs blank − Abs sample)/Abs blank × 100.
ABTS radical scavenging activity was evaluated using the method of Re et al. [17]. ABTS⁺ solution (7 mM) was mixed with 2.45 mM potassium persulfate at a 1:1 ratio and incubated in the dark for 12–14 h. The solution was diluted with 5 mM potassium phosphate buffer (pH 7.4) to obtain an absorbance of 0.7–0.8 at 734 nm. After mixing 4 mL of diluted ABTS⁺ solution with 40 μL of sample for 1 min, absorbance was measured at 734 nm. L-ascorbic acid was used as the control. ABTS radical scavenging activity was calculated using the same equation as described above.
FRAP was determined according to Benzie and Strain [18]. The FRAP reagent was freshly prepared by mixing 300 mM acetate buffer (pH 3.6), 10 mM TPTZ solution in 40 mM HCl, and 20 mM FeCl3·6H2O in a 10:1:1 (v/v/v) ratio. Acetate buffer was used to maintain the FRAP reaction at pH 3.6, which is required for the ferric–TPTZ reduction reaction. After mixing 0.5 mL of sample with 3.5 mL of FRAP reagent, absorbance was measured at 593 nm using a UV–Vis spectrophotometer, incubated at 37°C for 5 min, and remeasured. FRAP values were expressed as μM Fe2+ equivalents using a calibration curve prepared with FeSO4·7H2O.
RAW 264.7 macrophages were cultured in RPMI-1640 medium supplemented with 10% FBS and 1% penicillin–streptomycin. Cells were seeded in 96-well plates at a density of 1 × 10⁵ cells/mL (180 μL/well) and incubated prior to treatment. Cell viability was assessed using the MTT [3-(4,5-dimethylthiazol-2-yl)-2,5-diphenyltetrazolium bromide] assay after treatment with elderberry extracts at concentrations ranging from 50–400 μg/mL. After treatment, MTT solution (0.5 mg/mL) was added, and the cells were incubated for an additional 4 h. The resulting formazan crystals were dissolved in DMSO, and absorbance was measured at 570 nm using a microplate reader. To correct for possible absorbance interference caused by the intrinsic color of elderberry extracts, extract-specific sample blanks were prepared at the same concentrations and volumes as the treated samples. The absorbance values of these blanks were measured and subtracted from the corresponding sample readings before calculating cell viability and inhibition of nitric oxide production.
RAW 264.7 cells were seeded in 96-well plates at a density of 1 × 10⁵ cells/mL and incubated for 24 h. The cells were pretreated with elderberry extracts (50–400 μg/mL) for 1 h, followed by stimulation with lipopolysaccharide (LPS, 1 μg/mL) for 24 h. Nitric oxide production was determined by measuring nitrite levels in the culture supernatant using the Griess reagent. Briefly, equal volumes of culture supernatant and Griess reagent were mixed and incubated at room temperature for 10 min, and the absorbance was measured at 540 nm using a microplate reader (TECAN, Infinite M Nano, Switzerland). Nitric oxide production was expressed relative to the LPS-treated control group, and the percentage inhibition of nitric oxide production was calculated based on the decrease in nitric oxide levels compared with the LPS-treated control group. For clarity, cell viability was calculated relative to the untreated control group, whereas the inhibition of nitric oxide production was calculated relative to the LPS-treated control group.
A bioactivity profile heatmap was constructed to compare the overall bioactivity patterns of elderberry extracts using the mean values of antioxidant components, antioxidant activities, and inhibition of nitric oxide production. Because the analyzed parameters had different units and ranges, z-score transformation was applied to standardize the data before visualization. Accordingly, higher z-scores indicate relatively greater bioactivity. The heatmap was generated using Python (version 3.9) with the seaborn and matplotlib visualization libraries.
All experiments, except HPLC analysis, were performed in triplicate using independently prepared samples, and results were expressed as mean ± SD. Statistical analyses were conducted using IBM SPSS Statistics (version 25, IBM Corp., Armonk, NY, USA). Analysis of variance (ANOVA) followed by Duncan’s multiple range test was used to determine significant differences at p < 0.05.
The initial lactic acid bacteria count of elderberry fermentation was 3.0 × 10⁷ CFU/mL, which increased to 4.5 × 10⁹ CFU/mL after 72 h, indicating active microbial growth during fermentation. During fermentation with L. plantarum, the pH decreased from 6.51 to 3.74 after 24 h and further to 3.56 after 72 h, confirming successful lactic acid fermentation.
The total and reducing sugar contents are presented in Table 1. The total sugar content was higher in EE (576.27 mg/g) than in EW (495.49 mg/g). Following fermentation, total sugar content decreased to 459.80 mg/g in FEW and 521.37 mg/g in FEE. Reducing sugar content also decreased after fermentation, from 431.30 and 512.37 mg/g in EW and EE to 220.11 and 278.51 mg/g in FEW and FEE, respectively.
Chemical composition of elderberry and fermented elderberry extracts.
| Sample | Total sugar content(mg/g) | Reducing sugar content(mg/g) | Total polyphenols(mg GAE/g) | Total flavonoids(mg QE/g) | Total ascorbic acid(mg/100 g) |
|---|---|---|---|---|---|
| EW | 495.49 ± 5.31C | 431.30 ± 3.78B | 35.49 ± 0.14D | 20.00 ± 2.47B | 47.81 ± 0.71C |
| EE | 576.27 ± 8.01A | 512.37 ± 4.69A | 47.16 ± 0.14C | 19.76 ± 5.99B | 68.26 ± 2.36A |
| FEW | 459.80 ± 8.67D | 220.11 ± 8.01D | 49.22 ± 0.73B | 37.86 ± 2.14A | 43.04 ± 1.89D |
| FEE | 521.37 ± 4.13B | 278.51 ± 5.45C | 76.92 ± 1.53A | 40.00 ± 1.89A | 64.58 ± 1.28B |
EW: elderberry water extract; EE: elderberry 70% ethanol extract; FEW: fermented elderberry water extract; FEE: fermented elderberry 70% ethanol extract. Values are expressed as mean ± SD (n = 3). Different capital letters (A–D) within the same column indicate significant differences among samples by Duncan’s multiple range test (p < 0.05).
As shown in Table 1, the total polyphenol content was highest in FEE (76.92 mg GAE/g), followed by FEW (49.22 mg GAE/g), EE (47.16 mg GAE/g), and EW (35.49 mg GAE/g). The 70% ethanol extracts exhibited higher polyphenol contents than water extracts, and fermentation further increased polyphenol levels. The total flavonoid content showed a similar pattern, with higher values observed in fermented extracts (FEE: 40.00 mg QE/g; FEW: 37.86 mg QE/g) compared with non-fermented extracts (EE: 19.76 mg QE/g; EW: 20.00 mg QE/g). Total vitamin C contents were higher in EE (68.26 mg/100 g) than in EW (47.81 mg/100 g). However, after fermentation, vitamin C content decreased to 64.58 mg/100 g in FEE and 43.04 mg/100 g in FEW.
The preliminary HPLC results suggested the presence of gallic acid, rutin, quercetin, myricetin, and cyanidin chloride in elderberry extracts based on retention time comparison with authentic standards (Table 2). Among the compounds tentatively detected and quantified, cyanidin chloride showed the highest level in all samples, with values of 93.18 mg/100 g in EW, 83.82 mg/100 g in EE, 165.29 mg/100 g in FEW, and 160.05 mg/100 g in FEE. Several phenolic compounds showed higher levels after fermentation. In particular, rutin content increased from 10.27 and 14.61 mg/100 g in EW and EE to 23.62 and 44.87 mg/100 g in FEW and FEE, respectively. Gallic acid content also increased from 8.85 and 7.05 mg/100 g in EW and EE to 11.35 and 13.97 mg/100 g in FEW and FEE, respectively. Quercetin and myricetin were present at relatively low levels across all samples, ranging from not detected to 1.54 mg/100 g and from not detected to 0.97 mg/100 g, respectively. The total quantified phenolic content was higher in fermented extracts, reaching 201.58 mg/100 g in FEW and 221.40 mg/100 g in FEE, compared with 113.36 and 105.48 mg/100 g in EW and EE, respectively. Because HPLC analysis was performed once for each sample, these results should be interpreted as preliminary compositional data.
Phenolic compounds in extracts prepared from non-fermented and fermented elderberry slurry as determined by HPLC analysis.
| Sample | Phenolic compound (mg/100 g) | |||||
|---|---|---|---|---|---|---|
| Gallic acid | Rutin | Quercetin | Myricetin | Cyanidin chloride | Σ Quantified phenolics | |
| EW | 8.85 | 10.27 | 0.30 | 0.76 | 93.18 | 113.36 |
| EE | 7.05 | 14.61 | N.D. | N.D. | 83.82 | 105.48 |
| FEW | 11.35 | 23.62 | 1.05 | 0.27 | 165.29 | 201.58 |
| FEE | 13.97 | 44.87 | 1.54 | 0.97 | 160.05 | 221.40 |
EW: elderberry water extract; EE: elderberry 70% ethanol extract; FEW: fermented elderberry water extract; FEE: fermented elderberry 70% ethanol extract. N.D.: not detected. Quantification was performed using external standard calibration. Values are expressed as mg/100 g extract on a freeze-dried extract basis.
The DPPH radical scavenging activities are shown in Figure 1A, and the corresponding IC50 values are presented in Table 3. All samples exhibited a concentration-dependent increase in scavenging activity. At 10 μg/mL, fermented extracts, particularly FEE (24.10%) and FEW (20.22%), showed higher scavenging activity than non-fermented extracts (11.99–13.17%). At 50 μg/mL, this difference was maintained, with FEE (64.98%) and FEW (64.26%) exhibiting higher activity than non-fermented extracts (50.68–50.91%). However, at higher concentrations, all samples exhibited similarly high scavenging activity (80.83–94.18%), indicating that the differences among samples became less distinct as the reaction approached a high scavenging range. Thus, the fermentation-related improvement in DPPH radical scavenging activity was more clearly observed at lower to intermediate concentrations than at higher concentrations. The DPPH IC50 values of EW, EE, FEW, and FEE were 49.08, 49.24, 36.11, and 34.26 μg/mL, respectively. Fermented extracts showed lower DPPH IC50 values than non-fermented extracts, indicating enhanced DPPH radical scavenging activity after fermentation.
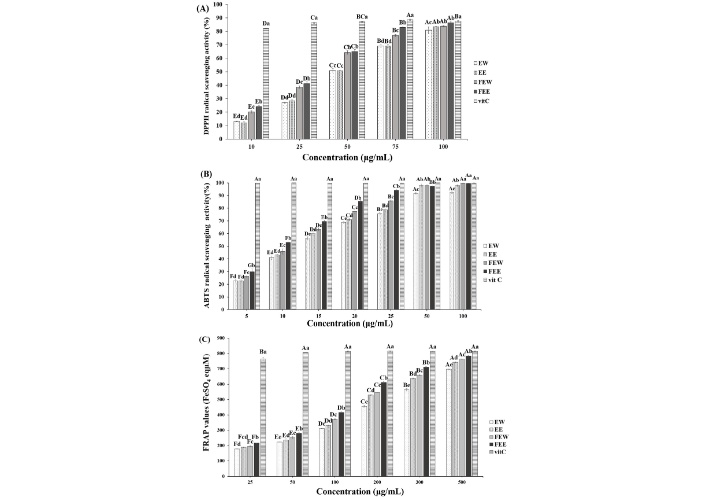
Antioxidant activities of elderberry extracts and fermented elderberry extracts. (A) DPPH radical scavenging activity; (B) ABTS radical scavenging activity; and (C) FRAP assay. EW: elderberry water extract; EE: elderberry 70% ethanol extract; FEW: fermented elderberry water extract; FEE: fermented elderberry 70% ethanol extract. L-ascorbic acid was used as the positive control. Different capital letters indicate significant differences among concentrations within the same sample (p < 0.05). Different lowercase letters indicate significant differences among samples at the same concentration (p < 0.05).
IC50 values of DPPH and ABTS radical scavenging activities of elderberry extracts.
| Sample | DPPH IC50 (μg/mL) | ABTS IC50 (μg/mL) |
|---|---|---|
| EW | 49.08 ± 1.28A | 12.92 ± 0.11A |
| EE | 49.24 ± 0.08A | 12.07 ± 0.19B |
| FEW | 36.11 ± 0.94B | 11.16 ± 0.50C |
| FEE | 34.26 ± 0.25C | 9.35 ± 0.03D |
EW: elderberry water extract; EE: elderberry 70% ethanol extract; FEW: fermented elderberry water extract; FEE: fermented elderberry 70% ethanol extract. Values are expressed as mean ± SD. IC50 values were calculated by linear interpolation from triplicate radical scavenging activity data. Different uppercase letters within the same column indicate significant differences among samples at p < 0.05.
The ABTS radical scavenging activities are presented in Figure 1B, and the corresponding IC50 values are presented in Table 3. All samples exhibited a concentration-dependent increase in activity. At 5 μg/mL, FEE (29.89%) and FEW (26.16%) showed higher scavenging activity than EE (22.63%) and EW (22.63%). At 10 μg/mL, this trend was maintained, with FEE (53.03%) and FEW (45.90%) exhibiting higher activity than EE (42.97%) and EW (40.97%). At 25 μg/mL, FEE (94.13%) showed the highest activity, followed by FEW (85.85%), EE (78.68%), and EW (75.70%). However, at 50–100 μg/mL, all samples exhibited similarly high scavenging activity, reaching 91.67–99.49%, suggesting that the ABTS radical scavenging response approached saturation and that discrimination among samples became limited at these higher concentrations. Therefore, the enhanced ABTS radical scavenging activity of fermented extracts was most evident at low to moderate concentrations, whereas the differences among extracts were less pronounced at higher concentrations. The ABTS IC50 values of EW, EE, FEW, and FEE were 12.92, 12.07, 11.16, and 9.35 μg/mL, respectively. Fermented extracts showed lower ABTS IC50 values than non-fermented extracts, with FEE exhibiting the lowest IC50 value among all samples.
FRAP values increased in a concentration-dependent manner in all samples (Figure 1C). At 100 μg/mL, FEE (416.25 μM Fe2+ equivalents) showed higher reducing power than FEW (372.21 μM Fe2+ equivalents), EE (330.99 μM Fe2+ equivalents), and EW (311.78 μM Fe2+ equivalents). This trend was consistently maintained at higher concentrations, and at 500 μg/mL, FEE reached the highest value (784.58 μM Fe2+ equivalents), followed by FEW (763.23 μM Fe2+ equivalents), EE (742.82 μM Fe2+ equivalents), and EW (697.25 μM Fe2+ equivalents). Overall, fermented extracts exhibited significantly higher reducing power than non-fermented extracts across all concentrations, with FEE showing the highest activity, followed by FEW, EE, and EW. In addition, 70% ethanol extracts consistently showed greater reducing power than water extracts at all concentrations.
Cell viability results are shown in Figure 2A. All samples maintained cell viability above 80% across the tested concentration range (50–400 μg/mL). Based on these results, concentrations up to 400 μg/mL were considered non-cytotoxic and were therefore used to evaluate the inhibition of nitric oxide production.
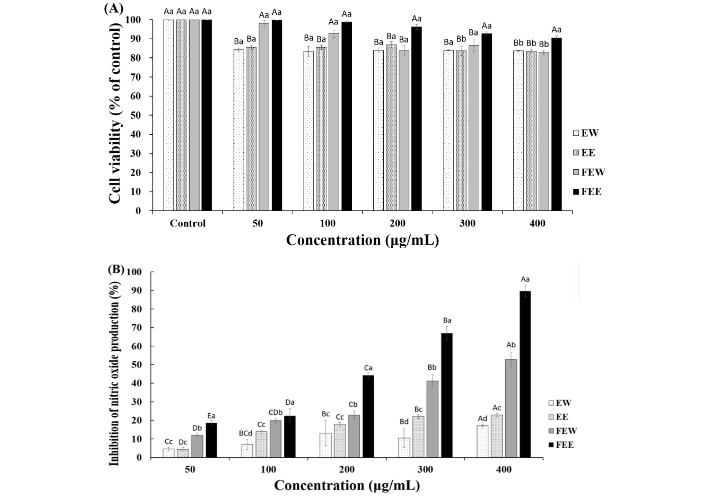
Effects of elderberry extracts and fermented elderberry extracts on RAW 264.7 cells. (A) Cell viability and (B) inhibition of nitric oxide production in LPS-stimulated RAW 264.7 cells. Cell viability and inhibition of nitric oxide production were expressed relative to the untreated control and LPS-treated control, respectively. EW: elderberry water extract; EE: elderberry 70% ethanol extract; FEW: fermented elderberry water extract; FEE: fermented elderberry 70% ethanol extract. Different capital letters indicate significant differences among concentrations within the same sample, and different lowercase letters indicate significant differences among samples at the same concentration (p < 0.05).
The inhibitory effects of elderberry extracts on LPS-induced nitric oxide production in RAW 264.7 cells are presented in Figure 2B. Nitric oxide production was measured in LPS-stimulated cells, and the percentage inhibition was calculated relative to the LPS-treated control group. All samples inhibited nitric oxide production in a concentration-dependent manner. FEE showed the greatest inhibition of nitric oxide production, increasing from 18.63% at 50 μg/mL to 89.67% at 400 μg/mL. FEW also demonstrated substantial inhibition, ranging from 11.95% to 52.74% across the tested concentrations. In contrast, the non-fermented extracts exhibited lower inhibitory effects. EE showed moderate inhibition (4.39–22.90%), whereas EW exhibited the lowest inhibition of nitric oxide production, remaining below 17.13% across all concentrations. These findings suggest that fermentation enhanced the inhibition of nitric oxide production by elderberry extracts in LPS-stimulated RAW 264.7 cells.
The bioactivity profile heatmap (Figure 3) shows the relative differences in overall bioactivity among samples based on z-score standardization. FEE exhibited higher z-score values in total polyphenol content (1.63), total flavonoid content (1.14), FRAP (1.17), and inhibition of nitric oxide production (1.48). FEW showed relatively high values in ABTS radical scavenging activity (1.18) and total flavonoid content (0.85), while a low value was observed for DPPH radical scavenging activity (−1.66). EE showed higher values in total vitamin C content (1.15) and DPPH radical scavenging activity (1.00), whereas lower values were observed in inhibition of nitric oxide production (−0.60). EW exhibited negative z-score values across most parameters, including ABTS radical scavenging activity (−1.50), FRAP (−1.54), and inhibition of nitric oxide production (−1.17).
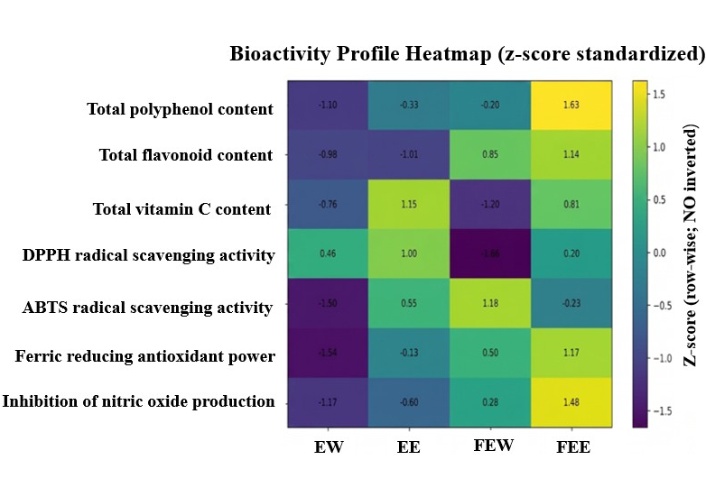
Bioactivity profile heatmap analysis. The heatmap was constructed using z-score-standardized mean values of antioxidant components, antioxidant activities, and inhibition of nitric oxide production. For parameters in which lower values indicated stronger activity, values were inversely transformed before standardization.
Fermentation with L. plantarum resulted in a substantial increase in viable cell counts and a marked decrease in pH, which can be attributed to the production of organic acids, particularly lactic acid, during microbial metabolism. The decrease in pH reflects active lactic acid fermentation and sugar metabolism by L. plantarum. Although acidification is generally associated with changes in microbial stability in fermented foods, the present study did not directly evaluate shelf-life, microbial safety, or pathogen inhibition. Therefore, these findings should be interpreted as evidence of successful fermentation rather than direct evidence of improved product safety [19].
The observed reduction in total and reducing sugar contents after fermentation indicates that sugars were utilized as carbon sources during lactic acid fermentation. Similar decreases in sugar content accompanied by increased organic acid production have been reported in plant-based beverages fermented with lactic acid bacteria. In particular, Küçükgöz et al. [20] reported that lactic acid fermentation of oat and buckwheat-based beverages resulted in decreased sugar content and changes in organic acid composition. These findings indicate that sugar metabolism contributes to organic acid production and pH reduction, which are closely associated with changes in physicochemical and functional properties. In addition, such metabolic changes during fermentation have been reported to promote the transformation and release of bioactive compounds, thereby enhancing biological activity [21].
Fermentation significantly increased total polyphenol and flavonoid contents, which may be attributed to microbial enzymatic activity. Enzymes such as β-glucosidase can hydrolyze glycosidic bonds and disrupt plant cell wall structures, thereby releasing bound phenolic compounds into more bioactive aglycone forms [7, 22]. Similar increases in total polyphenol and flavonoid contents have been reported in fruit-based fermentation systems. For example, Wang et al. [23] demonstrated that lactic acid fermentation of Opuntia ficus-indica juice significantly increased total phenolic content and antioxidant activity, accompanied by changes in metabolite profiles. These findings are consistent with the present study, in which fermented samples, particularly the fermented 70% ethanol extract (FEE), exhibited higher levels of bioactive compounds and enhanced biological activity compared with non-fermented samples.
Consistent with these results, the HPLC results suggested that fermentation increased the levels of several quantified phenolic compounds, including rutin and cyanidin chloride. Because the HPLC analysis was performed once for each sample, these data should be interpreted as preliminary compositional information rather than definitive quantitative evidence. The observed increase may be partly associated with microbial enzymatic activity, which can facilitate the release of bound phenolic compounds from plant matrices. Anthocyanins, particularly cyanidin derivatives, are predominant in elderberry and have been reported to contribute to antioxidant and inflammation-related bioactivities [24]. A recent study on wild-growing S. nigra plants reported diverse phenolic profiles depending on plant material and growing conditions, suggesting that compositional data should be interpreted with consideration of sample origin and extraction conditions [25]. However, further chromatographic validation and replicate analysis are required to confirm fermentation-induced changes in individual phenolic compounds.
The enhancement of antioxidant activities, as demonstrated by DPPH, ABTS, and FRAP assays, showed a similar trend with the increased levels of phenolic and flavonoid compounds in fermented samples. Ethanol has been reported to be more effective in extracting major antioxidant components, such as flavonoids and phenolic acids, which contribute significantly to antioxidant activity. In particular, extracts with higher phenolic content obtained using organic solvents exhibit superior radical scavenging activity due to their enhanced electron- or hydrogen-donating capacity [9, 26]. Therefore, the higher antioxidant activity observed in 70% ethanol extracts in the present study may be attributed to differences in the content and composition of phenolic compounds. In addition, fermentation further enhanced antioxidant activity. In the DPPH assay, fermented extracts exhibited significantly higher radical scavenging activity compared to non-fermented samples, which is associated with the release of phenolic compounds during lactic acid fermentation [8]. In addition, Kim and Hong [10] reported that ABTS radical scavenging activity was increased in lactic acid bacteria-fermented acai berry extracts, suggesting that fermentation promotes the formation of electron-donating antioxidant compounds. Furthermore, Zhao et al. [26] reported that lactic acid fermentation of plant-derived materials leads to the conversion of bound phenolic compounds into free forms and the production of various bioactive metabolites through microbial enzymatic activity, resulting in an increasing trend in FRAP activity. Consistent with these findings, the present study also showed that fermented elderberry extracts exhibited higher antioxidant activities across DPPH, ABTS, and FRAP assays compared to non-fermented extracts, suggesting that fermentation-induced biotransformation enhanced the antioxidant potential. This increase in antioxidant activity is likely associated with the formation of phenolic aglycones and other bioactive metabolites during fermentation.
In addition to antioxidant activity, fermented elderberry extracts exhibited stronger inhibition of LPS-induced nitric oxide production without marked cytotoxicity, suggesting greater inhibition of nitric oxide production in RAW 264.7 macrophages. This effect may be associated with increased phenolic compounds, which have been reported to modulate inflammatory mediator production in activated macrophages [19, 24]. In particular, phenolic compounds such as anthocyanins and flavonoids have been reported to suppress inducible nitric oxide synthase (iNOS) expression and reduce nitric oxide production [24]. However, the present study measured only nitric oxide production as an inflammation-related endpoint. Therefore, additional inflammatory markers, such as iNOS, COX-2, IL-6, and TNF-α, should be evaluated in future studies to confirm the broader anti-inflammatory effects of fermented elderberry extracts. In addition, probiotic lactic acid bacteria and their metabolites have been reported to regulate intracellular signaling pathways and inhibit the production of inflammatory mediators, including nitric oxide, thereby modulating immune responses [5, 19]. These findings suggest that the enhanced inhibition of nitric oxide production observed in fermented elderberry extracts may result from the combined effects of increased phenolic compounds and fermentation-induced biofunctional changes.
The bioactivity profile heatmap further demonstrated that the fermented 70% ethanol extract exhibited the most pronounced overall bioactivity. These results suggest that both extraction solvent and fermentation significantly influence the integrated functional properties of elderberry extracts. Previous studies have evaluated the functional properties of fermented plant-derived extracts by analyzing changes in antioxidant activity and bioactive compound profiles. For example, Wu et al. [27] reported that lactic acid fermentation of blueberry and blackberry juices enhanced antioxidant capacity through the transformation of phenolic compounds, while Hong et al. [28] demonstrated that fermentation of Taraxacum coreanum extract improved antioxidant and anti-photoaging activities, indicating that microbial fermentation can enhance the bioactivity of plant-derived materials. In addition, Ricci et al. [29] reported that lactic acid bacteria modified the polyphenolic profile of elderberry juice, supporting the possibility that fermentation can alter elderberry-derived phenolic compounds. Therefore, the heatmap analysis provides a comparative visualization of functional enhancement induced by fermentation. Overall, lactic acid fermentation with L. plantarum improved the bioactive compound content and antioxidant properties of elderberry extracts, particularly in the fermented 70% ethanol extract. Fermented extracts also showed enhanced inhibition of LPS-induced nitric oxide production in RAW 264.7 cells, suggesting that fermentation may be useful for improving the functional potential of elderberry-derived ingredients. However, HPLC analysis was performed once for each sample, and the inflammation-related evaluation was limited to inhibition of nitric oxide production without additional inflammatory markers. Therefore, further studies involving replicate-based chromatographic validation, additional inflammatory markers, and in vivo or formulation-based evaluation are needed before broader anti-inflammatory or functional food claims can be established.
ABTS: 2,2’-azino-bis(3-ethylbenzothiazoline-6-sulfonic acid)
DMSO: dimethyl sulfoxide
DNS: 3,5-dinitrosalicylic acid
DPPH: 2,2-diphenyl-1-picrylhydrazyl
FBS: fetal bovine serum
FRAP: ferric reducing antioxidant power
GAE: gallic acid equivalents
HPLC: high-performance liquid chromatography
MRS: de Man–Rogosa–Sharpe
MTT: 3-(4,5-dimethylthiazol-2-yl)-2,5-diphenyltetrazolium bromide
QE: quercetin equivalents
RPMI: Roswell Park Memorial Institute medium
CL: Conceptualization, Methodology, Formal analysis, Visualization, Writing—original draft. MP: Conceptualization, Methodology, Validation, Writing—original draft, Writing—review & editing. MK: Conceptualization, Writing—review & editing, Supervision. All authors have read and approved the final manuscript.
The authors declare no conflicts of interest.
Not applicable.
Not applicable.
Not applicable.
Data are available from the corresponding author upon reasonable request.
This research received no external funding.
© The Author(s) 2026.
Open Exploration maintains a neutral stance on jurisdictional claims in published institutional affiliations and maps. All opinions expressed in this article are the personal views of the author(s) and do not represent the stance of the editorial team or the publisher.
Copyright: © The Author(s) 2026. This is an Open Access article licensed under a Creative Commons Attribution 4.0 International License (https://creativecommons.org/licenses/by/4.0/), which permits unrestricted use, sharing, adaptation, distribution and reproduction in any medium or format, for any purpose, even commercially, as long as you give appropriate credit to the original author(s) and the source, provide a link to the Creative Commons license, and indicate if changes were made.



View: 41
Download: 4
Times Cited: 0


