 Original Article


Affiliation:
Department of Food Science, College of Agriculture, University of Basrah, Basra City 61004, Iraq
Email: alaa.niamah@uobasrah.edu.iq
ORCID: https://orcid.org/0000-0001-7501-2143


 ,
,
Affiliation:
Department of Food Science, College of Agriculture, University of Basrah, Basra City 61004, Iraq
ORCID: https://orcid.org/0000-0002-0617-6870
Explor Foods Foodomics. 2026;4:1010191 DOI: https://doi.org/10.37349/eff.2026.1010191
Received: March 02, 2026 Accepted: August 18, 2026 Published: September 24, 2026
Academic Editor: Andrea Gomez-Zavaglia, Center for Research and Development in Food Cryotechnology (CIDCA CONICET), Argentina
Aim: The objective of this study is to enhance the flavor of bio-yogurt through the addition of threonine at various concentrations, and to evaluate its influence on the physicochemical, microbiological, and sensory characteristics of the product.
Methods: To prepare bio-yogurt from cow’s milk, a probiotic starter culture comprising Bifidobacterium bifidum (Bb-12), Lactobacillus acidophilus (La-5), and Streptococcus thermophilus (ST) was used, both with and without the addition of the amino acid threonine at three concentrations: 1, 5, and 10 mg/100 mL milk. The bio-yogurt samples were then subjected to various physical, chemical, microbiological, and sensory analyses, and compared against a threonine-free control sample.
Results: On the first day, the logarithmic counts of the probiotic starter cultures were 8.55–8.58, 8.33–8.34, and 8.53–8.57 log CFU/g for Bb-12, La-5, and ST, respectively; these values decreased to 7.01–7.03, 7.52–7.56, and 7.82–7.89 log CFU/g after 21 days. The concentrations of volatile compounds (acetaldehyde, acetoin, and diacetyl) in the threonine-enriched bio-yogurt ranged from 42.12 µg/kg to 49.40 µg/kg, 25.11 µg/kg to 29.02 µg/kg, and 3.09 µg/kg to 3.97 µg/kg, respectively, compared to the control sample, which exhibited concentrations of 38.23 µg/kg, 22.50 µg/kg, and 2.55 µg/kg, respectively. Sensory evaluation results indicated that the sample supplemented with 10 mg of threonine received the highest scores compared to the other samples.
Conclusions: Our findings provide evidence of the value of supplementing bio-yogurt with threonine, as it does not alter its physicochemical properties. Furthermore, it does not adversely affect the total viable counts of probiotic bacteria but significantly improves the flavor profile and enhances consumer acceptability.
Yogurt is a fermented dairy product typically produced by fermenting various types of milk, such as cow, buffalo, sheep, and camel milk, using lactic acid bacteria starters. These traditional starters primarily include Lactobacillus bulgaricus subsp. bulgaricus and Streptococcus thermophilus (ST) [1]. Currently, several probiotic bacterial strains, such as Lactobacillus acidophilus (La-5) and Bifidobacterium bifidum (Bb-12), are incorporated into bio-yogurt production, either alone or mixed with a specific yogurt starter culture [2].
A key characteristic distinguishing yogurt from other dairy products is its distinct flavor profile, which is attributed to lactic acid and other volatile flavor compounds generated during fermentation by the starter culture. These compounds primarily comprise aldehydes, ketones, and organic acids [3]. Acetaldehyde is widely recognized as one of the most critical flavor compounds in yogurt and serves as a major determinant of product acceptance. Insufficient levels of acetaldehyde can result in an undesirable or flat flavor profile.
The optimal concentration of acetaldehyde typically ranges between 4 ppm and 8 ppm. Acetaldehyde is synthesized mainly through the metabolism of lactose, nucleic acids and certain amino acids, particularly threonine, methionine, and valine [4]. It is generated as a byproduct of glucose metabolism in starter cultures, where bacteria synthesize acetaldehyde by metabolizing threonine and, indirectly, methionine. Previous studies have demonstrated that the primary metabolic pathway for acetaldehyde formation involves the cleavage of threonine into acetaldehyde and glycine [5]. The key enzyme driving this bioconversion is threonine aldolase (EC 2.1.2.1), whose activity in starter bacteria significantly decreases when the growth temperature is raised from 30°C to 42°C [6]. Threonine concentration must be precisely calibrated to maximize flavor development without causing sensory impairment or metabolic inhibition. To prevent flavor degradation during storage, maintaining adequate acetaldehyde levels is crucial. The use of threonine has been shown to effectively promote acetaldehyde formation [7], making it a promising option for preserving the product’s sensory properties throughout its shelf life.
The sensory attributes of probiotic dairy products are highly influenced by the specific probiotic bacteria strains used as fermentation starters, as well as their capacity to generate flavor compounds. Probiotic strains often yield a milder flavor profile compared to traditional yogurts fermented solely with conventional lactic acid bacteria. To improve the sensory properties of probiotic dairy products, this study investigated the effect of supplementing bio-yogurt with varying concentrations of the amino acid threonine on the quantity of flavor compounds generated after processing and during subsequent refrigerated storage.
Fresh cow’s milk was obtained from the Animal Production Research Station, which is part of the College of Agriculture at the University of Basrah. The milk composition was 87.02% moisture, 3.52% protein, 4.09% lactose, 3.60% fat, and 1.77% ash, with a freezing point of –0.57°C. Commercial probiotic cultures were obtained from the laboratory of Chr. Hansen’s A/S (Hørsholm, Denmark). A mixed culture consisting of ST, Bb-12, and La-5 was prepared in equal proportions (1:1:1). De Man, Rogosa, and Sharpe (MRS)-sorbitol medium (MRS basal medium without glucose) was prepared by mixing 90 mL of basal medium with 10 mL of a sterile, membrane-filtered 10% D-sorbitol solution to achieve a final 1% sorbitol concentration. MRS-NNLP medium was prepared by adding filter-sterilized antibiotics to MRS basal medium to achieve final concentrations of 100 mg/L neomycin sulphate, 200 mg/L paromomycin, 15 mg/L nalidixic acid, and 3,000 mg/L LiCl (all purchased from Sigma-Aldrich, Germany). Additionally, M17 agar medium was utilized to activate the starter culture and enumerate the bacterial populations during yogurt manufacturing and storage. All other chemicals used in this study were of analytical grade.
Fresh milk was divided into batches and supplemented with three different concentrations of threonine (1, 5, and 10 mg/100 mL of milk). The mixtures were thoroughly stirred, pasteurized at 85°C for 20 min, and then cooled to 40°C. The milk was inoculated with 5% (V/W) of the active starter culture (~65 × 108 CFU/g), mixed thoroughly, and incubated at 37°C until a pH of 4.6 ± 0.2 was attained. The resulting bio-yogurt samples were then cooled and stored at 5 ± 1°C for 16 h before testing. All analyses were performed in triplicate for each sample.
The pH of the bio-yogurt samples was monitored after 1, 7, 14, and 21 days of storage using a digital pH meter (SD-3000, Germany). The total acidity was determined by titrating the sample against 0.5 M NaOH using phenolphthalein as an indicator. Susceptibility to syneresis was evaluated using the filtration method. 50 g of bio-yogurt was placed on the Whatman No. 1 filter paper inside a funnel, and the weight of the filtered whey (g) collected after 6 h at 22°C was recorded and expressed as a percentage (%) of syneresis [8]. For water-holding capacity (WHC) determination, 10 g of samples were centrifuged at 5,000 rpm for 15 min at 4°C [9]. After separation, the whey was weighed, and WHC was calculated using the following formula:
Viable cell counts of individual starter bacterial strains were determined using the pour-plate technique. S. thermophilus was enumerated on M17 agar after aerobic incubation at 42°C for 48 h. Anaerobic conditions were maintained for the growth of L. acidophilus and B. bifidum, which were cultivated on MRS-sorbitol agar and MRS-NNLP agar, respectively, and incubated at 37°C for 48 h [10].
The concentration of lactic acid, acetic acid, acetaldehyde, acetoin, diacetyl, and ethanol in the bio-yogurt samples was determined immediately after production and throughout the storage period using HPLC at the College of Pharmacy, University of Basrah, following the procedures modified from [11]. Briefly, 1 g of yogurt sample was centrifuged at 14,000 × g for 5 min at 4°C. The supernatant was filtered and transferred to a clean Eppendorf tube. The sample was diluted 1:1 (V/V) with 0.5% meta-phosphoric acid (Sigma-Aldrich, Germany), and a 20 μL aliquot was injected into the HPLC system. Separation was performed using a Capcell Pak C18 MG column (150 × 4.6 mm, 5 μm; Shiseido Co. Ltd., Tokyo, Japan) maintained at 30°C, under continuous gradient elution with the mobile phase. The mobile phase consisted of (A) 0.1% (v/v) aqueous phosphoric acid and (B) acetonitrile (Sigma-Aldrich, Germany). The gradient elution program was programmed as follows: 0.0–4.0 min, linear gradient from 5% to 20% (B); 4.0–5.0 min, linear decrease to 5% (B); and 5.0–6.0 min, hold at 5% (B) for column re-equilibration at a constant flow rate of 1.0 mL/min. The materials were separated within the chromatography by gradually and continuously changing the concentration of acetonitrile throughout the analysis. The total separation time was 5 min, with an overall run time of 6 min to ensure baseline stability. A Shimadzu Prominence HPLC system (Shimadzu, Kyoto, Japan) was employed, and all metabolite concentrations were quantified against standard curves generated using 10-point calibration standards (10 mg/mL) of sodium lactate, sodium acetate, acetaldehyde, acetoin, diacetyl, and ethanol obtained from Sigma-Aldrich (Munich, Germany).
Sensory assessment was conducted in accordance with the ethical principles of the Declaration of Helsinki. Before participation, all individuals were fully informed about the nature of the study, and written informed consent was obtained. Participants’ identities were kept strictly confidential to protect their privacy, and they were informed of their right to withdraw at any stage. Consumer acceptability was evaluated by 60 untrained panelists (30 men and 30 women) aged between 18 and 50 years. All samples were labelled with random three-digit codes, served in duplicate, and presented in a counterbalanced order to eliminate presentation bias. A five-minute break for rinsing was the palate with fresh water was required between each sample. Acceptability of taste, aroma, flavor, texture, appearance, and overall acceptability liking was assessed using a 9-point hedonic scale (ranging from 1 = dislike extremely to 9 = like extremely) [12].
Data were analyzed using a completely randomized design (CRD), treatment means were compared using the least significant difference (LSD) test at a significance level of p-value < 0.05. One-way analysis of variance (ANOVA) was performed using GenStat software (version 10), and standard deviations (± SD) were calculated using Microsoft Excel.
The physicochemical changes in the bio-yogurt samples supplemented with various threonine concentrations (1, 5, and 10 mg/100 mL of milk) over 21-day storage periods were detailed in Table 1. Statistical analysis showed that threonine supplementation had no significant effect (p ≥ 0.05) on pH or total acidity. On day 1 of refrigerated storage, pH values were 4.51, 4.48, 4.48, and 4.47 for the samples containing 0, 1, 5, and 10 mg/100 mL of threonine, respectively. After 21 days of refrigerated storage, the values decreased to 4.03, 4.04, 4.02, and 4.00, respectively. Conversely, total titratable acidity increased slightly to 1.11, 1.12, 1.13, and 1.13 after 21 days. Whey synaeresis and WHC serve as crucial physical indicators of yogurt quality during storage. Syneresis values ranged from 42.40% to 42.50% on day 1 and decreased slightly to a range of 38.98% to 39.01% by day 21. Parallel to this, WHC values started at 62.62–62.66% on day 1 and increased to 68.08–68.13% by the end of storage. No significant differences (p ≥ 0.05) were detected between the supplemented samples and the control.
Physicochemical properties of bio-yogurt supplemented with threonine (0, 1, 5, and 10 mg/100 mL of milk) during storage periods (21 days).
| Physicochemical tests | Threonine(mg/100 mL of milk) | Storage periods (days) | |||
|---|---|---|---|---|---|
| 1 | 7 | 14 | 21 | ||
| pH | 0 | 4.51a ± 0.13 | 4.32a ± 0.14 | 4.22a ± 0.08 | 4.03a ± 0.16 |
| 1 | 4.48a ± 0.19 | 4.31a ± 0.09 | 4.22a ± 0.13 | 4.04a ± 0.07 | |
| 5 | 4.48a ± 0.15 | 4.30a ± 0.11 | 4.22a ± 0.10 | 4.02a ± 0.11 | |
| 10 | 4.47a ± 0.11 | 4.30a ± 0.10 | 4.20a ± 0.09 | 4.00a ± 0.09 | |
| Total acidity (%) | 0 | 0.93a ± 0.05 | 0.97a ± 0.03 | 1.03a ± 0.05 | 1.11a ± 0.08 |
| 1 | 0.93a ± 0.03 | 0.97a ± 0.02 | 1.02a ± 0.05 | 1.12a ± 0.06 | |
| 5 | 0.94a ± 0.01 | 0.98a ± 0.01 | 1.03a ± 0.05 | 1.13a ± 0.09 | |
| 10 | 0.94a ± 0.01 | 0.98a ± 0.07 | 1.03a ± 0.05 | 1.13a ± 0.08 | |
| Syneresis (%) | 0 | 42.50a ± 0.22 | 40.71a ± 1.10 | 39.12a ± 0.94 | 39.01a ± 0.86 |
| 1 | 42.46a ± 0.41 | 40.69a ± 1.02 | 39.08a ± 0.95 | 38.99a ± 0.89 | |
| 5 | 42.43a ± 0.53 | 40.63a ± 0.99 | 39.08a ± 0.94 | 38.99a ± 0.91 | |
| 10 | 42.40a ± 0.82 | 40.62a ± 0.09 | 39.06a ± 0.88 | 38.98a ± 0.81 | |
| WHC (%) | 0 | 62.66a ± 0.92 | 64.51a ± 0.88 | 65.82a ± 0.98 | 68.08a ± 0.84 |
| 1 | 62.66a ± 0.91 | 64.49a ± 0.72 | 65.88a ± 0.85 | 68.09a ± 0.88 | |
| 5 | 62.63a ± 0.83 | 64.47a ± 0.96 | 65.80a ± 0.89 | 68.11a ± 0.97 | |
| 10 | 62.62a ± 0.89 | 64.44a ± 0.90 | 65.80a ± 0.98 | 68.13a ± 0.93 | |
a, b, c: different letters in columns indicate significant differences at p < 0.05.
Table 2 logarithm viable counts of the starter strains during refrigerated storage. On day 1, the counts of Bb-12, La-5, and ST across all samples ranged between 8.55–8.58, 8.33–8.34, and 8.53–8.57 log CFU/g, respectively. At the end of the storage period, viable counts declined to ranges of 7.01–7.03, 7.52–7.56, and 7.82–7.89 log CFU/g for Bb-12, La-5, and ST, respectively. Statistical analysis at a significance level (p < 0.05) revealed that threonine concentration had no significant effect (p ≥ 0.05) on bacterial survival during storage, despite a marginal, non-significant increase in counts at higher threonine concentrations.
Viable count (log CFU/g) of starter bacteria in bio-yogurt supplemented with threonine (0, 1, 5, and 10 mg/100 mL of milk) during a 21-day storage period.
| Starter bacteria count log CFU/g | Threonine(mg/100 mL of milk) | Storage periods (days) | |||
|---|---|---|---|---|---|
| 1 | 7 | 14 | 21 | ||
| Bb-12 | 0 | 8.55a ± 0.15 | 8.72a ± 0.29 | 7.22a ± 0.30 | 7.01a ± 0.55 |
| 1 | 8.58a ± 0.21 | 8.81a ± 0.41 | 7.22a ± 0.22 | 7.01a ± 0.46 | |
| 5 | 8.58a ± 0.36 | 8.80a ± 0.26 | 7.24a ± 0.51 | 7.02a ± 0.31 | |
| 10 | 8.57a ± 0.33 | 8.80a ± 0.25 | 7.25a ± 0.19 | 7.03a ± 0.29 | |
| La-5 | 0 | 8.33a ± 0.22 | 8.47a ± 0.18 | 8.05a ± 0.25 | 7.52a ± 0.14 |
| 1 | 8.33a ± 0.25 | 8.45a ± 0.31 | 8.03a ± 0.11 | 7.52a ± 0.32 | |
| 5 | 8.34a ± 0.29 | 8.44a ± 0.46 | 8.00a ± 0.21 | 7.55a ± 0.23 | |
| 10 | 8.34a ± 0.18 | 8.42a ± 0.51 | 8.00a ± 0.26 | 7.56a ± 0.21 | |
| ST | 0 | 8.53a ± 0.72 | 8.71a ± 0.10 | 8.22a ± 0.24 | 7.82a ± 0.16 |
| 1 | 8.56a ± 0.49 | 8.75a ± 0.22 | 8.23a ± 0.21 | 7.89a ± 0.23 | |
| 5 | 8.55a ± 0.55 | 8.76a ± 0.49 | 8.25a ± 0.34 | 7.85a ± 0.21 | |
| 10 | 8.57a ± 0.62 | 8.77a ± 0.33 | 8.26a ± 0.28 | 7.88a ± 0.11 | |
a, b, c: different letters in columns indicate significant differences at p < 0.05.
Data regarding the impact of threonine supplementation on the concentrations of final metabolic end-products during storage were shown in Table 3. Exogenous threonine did not significantly impact the production of lactic or acetic acid, which are the primary metabolic end-products of starter bacteria activity. On the first day of storage, lactic and acetic acid levels were measured at 43.21–45.73 mg/kg and 20.23–21.94 mg/kg, respectively. By day 21, these values significantly increased to 64.44–67.02 mg/kg and 33.01–34.27 mg/kg, respectively. Conversely, significant increases (p < 0.05) in volatile flavor compounds (acetaldehyde, acetoin, and diacetyl) were observed upon threonine supplementation compared to the control. These differences became more pronounced at higher amino acid concentrations. For instance, acetaldehyde content in yogurt supplemented with 10 mg of threonine/100 mL of milk reached 49.40 μg/kg on day 1, compared to 38.23 μg/kg in the control sample. Under the same conditions, acetoin and diacetyl levels reached 29.02 μg/kg and 3.97 μg/kg, respectively. Statistical analysis verified that threonine addition significantly elevated the proportion of diacetyl, acetoin, and acetaldehyde. These flavor compounds are synthesized via specific microbial metabolic pathways. Ethanol produced on the first day of storage ranged from 27.12 to 28.44 mg/kg. No significant differences were initially observed between the bio-yogurt samples. As the storage days progressed, significant differences emerged between the samples with added threonine and the control sample without threonine. Ethanol level decreased on day 21 of storage, reaching 16.99–19.16 mg/kg.
Volatile and metabolic components of bio-yogurt supplemented with threonine (0, 1, 5, and 10 mg/100 mL of milk) during a 21-day storage period.
| Physicochemical tests | Threonine(mg/100 mL of milk) | Storage periods (days) | |||
|---|---|---|---|---|---|
| 1 | 7 | 14 | 21 | ||
| Lactic acid (mg/kg) | 0 | 43.21a ± 1.35 | 49.88c ± 1.22 | 56.20a ± 1.10 | 64.44c ± 2.09 |
| 1 | 44.03a ± 2.01 | 50.11b ± 2.02 | 56.86a ± 2.00 | 65.00b ± 2.41 | |
| 5 | 44.88a ± 1.91 | 50.55b ± 1.96 | 57.15a ± 1.88 | 65.55b ± 2.17 | |
| 10 | 45.73b ± 2.11 | 51.10a ± 2.05 | 57.28a ± 2.02 | 67.02a ± 2.44 | |
| Acetic acid (mg/kg) | 0 | 20.23a ± 0.88 | 25.00b ± 1.00 | 28.86c ± 0.05 | 33.01ab ± 0.08 |
| 1 | 20.90a ± 0.65 | 25.92a ± 0.97 | 29.03ab ± 0.05 | 33.46a ± 0.06 | |
| 5 | 21.55a ± 0.77 | 26.49a ± 0.57 | 29.67a ± 0.05 | 33.93a ± 0.09 | |
| 10 | 21.94a ± 0.91 | 26.99a ± 0.93 | 30.01a ± 0.05 | 34.27a ± 0.08 | |
| Acetoin (μg/kg) | 0 | 22.50d ± 1.05 | 22.51d ± 0.96 | 21.82c ± 0.98 | 20.08c ± 0.91 |
| 1 | 25.11c ± 1.11 | 25.19c ± 1.02 | 23.88ab ± 0.65 | 22.09b ± 0.96 | |
| 5 | 26.23b ± 2.03 | 26.27b ± 1.06 | 25.00b ± 0.99 | 24.61a ± 0.99 | |
| 10 | 29.02 a ± 1.19 | 29.14a ± 0.99 | 27.50a ± 0.92 | 26.13a ± 0.97 | |
| Diacetyl (μg/kg) | 0 | 2.55c ± 0.02 | 2.53c ± 0.01 | 2.12b ± 0.03 | 2.03c ± 0.10 |
| 1 | 3.09ab ± 0.05 | 3.11ab ± 0.13 | 3.00a ± 0.09 | 2.86ab ± 0.08 | |
| 5 | 3.48a ± 0.01 | 3.50a ± 0.06 | 3.22a ± 0.08 | 3.02a ± 0.09 | |
| 10 | 3.97a ± 0.04 | 3.96a ± 0.05 | 3.80a ± 0.10 | 3.55a ± 0.05 | |
| Ethanol (mg/kg) | 0 | 27.12a ± 0.11 | 25.11a ± 0.33 | 22.76a ± 0.15 | 19.00a ± 0.53 |
| 1 | 27.50a ± 0.15 | 25.71a ± 0.15 | 22.09a ± 0.25 | 19.16a ± 0.06 | |
| 5 | 27.85a ± 0.33 | 24.58a ± 0.08 | 20.44b ± 0.05 | 17.13b ± 0.29 | |
| 10 | 28.44a ± 0.52 | 24.11a ± 0.12 | 20.31b ± 0.11 | 16.99b ± 0.17 | |
| Acetaldehyde (μg/kg) | 0 | 38.23d ± 0.22 | 36.64d ± 0.71 | 35.82d± 0.35 | 32.21c ± 0.29 |
| 1 | 42.12c ± 0.56 | 42.19c ± 0.78 | 40.28c ± 0.63 | 40.00ab ± 0.37 | |
| 5 | 46.13b ± 0.49 | 46.63b ± 0.41 | 45.08b ± 0.81 | 44.99a ± 0.58 | |
| 10 | 49.40a ± 0.59 | 49.62a ± 0.33 | 47.06a ± 0.58 | 46.95a ± 0.58 | |
a, b, c: different letters in columns indicate significant differences at p < 0.05.
Figure 1 presents the sensory evaluation scores provided by the 60-consumer panel on day 1 of storage. Bio-yogurt sample containing 10 mg/100 mL of threonine significantly outperformed other treatments in taste and flavor, securing the highest consumer marks. The next highest scores were recorded in samples containing 5 mg/100 mL of threonine. These observations confirm that threonine supplementation successfully enriched the palatability and flavor intensity of the bio-yogurt. Conversely, threonine addition did not affect texture or appearance scores, with all batches consistently scored 7.2 points. However, overall acceptability scores increased significantly to 8.1 points for samples containing 5 and 10 mg/100 mL of threonine, whereas the control and 1 mg/100 mL batches scored 7.2 points.
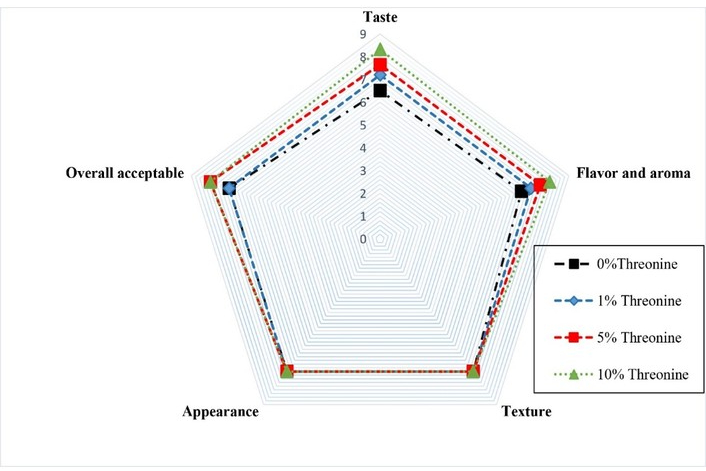
Sensory evaluation scores of bio-yogurts supplemented with different concentrations of threonine on day 1 of storage.
Yogurt production requires the generation of organic acids through milk sugar fermentation, driven by the metabolic activities of starter cultures-primarily lactic acid bacteria. This organic acid production is influenced by lactose fermentation through diverse metabolic pathways with mixed bacterial cultures [13]. Notably, adding amino acids does not alter the acidity of the resulting yogurt. Because acid production is directly linked to lactose metabolism by yogurt bacteria, and amino acids do not interfere with this mechanism that aligns with previous literature [14]. Furthermore, added amino acids do not affect the WHC. The increase in the WHC as the pH decreased is attributed to the metabolic activity of the starter cultures. As the pH values decreased, the protein matrix-specifically the casein network-underwent structural rearrangements as it approached the isoelectric point of casein (pI = 4.6). This decrease in electrostatic repulsion between protein molecules favored the formation of a denser and more interconnected three-dimensional gel network. This finer protein matrix effectively reduced the pore size within the fermented milk structure, thereby enhancing its ability to hold water and minimizing serum separation (syneresis). A higher WHC is a key quality indicator, imparting a firm, smooth texture. The enhanced water retention capacity across all yogurt samples is attributed to lower acidity [15].
Probiotic bacteria consistently met the standard therapeutic thresholds required for probiotic dairy products, indicating a robust, compliant manufacturing process [16]. During the first 7 days of refrigerated storage, a noticeable increase in probiotic bacteria numbers occurred, suggesting that the cold environment did not hinder their initial growth and proliferation [17]. However, beyond this initial week, a gradual decline in probiotic viability was observed, though final counts remained within the recommended therapeutic range (106–108 CFU/mL or g). This trend suggests that while refrigeration initially supports probiotic bacteria abundance, subsequent factors-such as progressive acidification- contribute to their eventual decline [18]. Similarly, Saccaro et al. [19], reported that incorporating L. delbrueckii subsp. bulgaricus and S. thermophilus alongside B. animalis subsp. lactis and L. rhamnosus yielded viable cell counts that satisfied the minimum probiotic requirements (6 log10 CFU/mL or g). Meeting these thresholds confirms yogurt’s efficacy as a functional probiotic product capable of delivering health benefits to consumers.
Previous research attributes this decline in probiotic viability during storage to post-acidification by the starter cultures [20], a phenomenon closely linked to strain-specific acid tolerance. For instance, lactobacilli exhibit higher resilience to acidic environments, surviving within a pH range of 4.30 to 3.70 [21]. This tolerance is mediated by an internal pH homeostasis system that stabilizes intracellular pH despite high extracellular acidity. Consequently, a strain’s inherent acid tolerance is pivotal in determining its long-term survival and viability in yogurt during storage [22].
Flavor profiles through the metabolic activities of the starter culture. Supplementing yogurt with threonine significantly increased volatile compounds (diacetyl, acetoin, and acetaldehyde), enhancing overall flavor and aroma. This concentration-dependent increase in flavor compounds correlated positively with sensory scores, yielding higher overall consumer acceptance. The core components of these starter cultures belong to the Firmicutes phylum, specifically lactic acid bacteria such as Lactococcus lactis, Lactobacillus spp., ST, Bifidobacterium spp., and certain Leuconostoc species [23, 24].
Biochemically, threonine is utilized via metabolic pathways where threonine aldolase catalyzes its conversion into acetaldehyde while releasing glycine [14]. Concurrently, proteolytic degradation of milk proteins generates free amino acids which convert into key volatile flavor compounds, including ammonia, amines, aldehydes, phenols, indole, and alcohols. These compounds establish the characteristic flavor profile of yogurt, with branched-chain amino acids serving as primary precursors derived from milk proteins [25]. While literature frequently cites threonine—rather than glucose oxidation—as the primary precursor for acetaldehyde in yogurt, exploring glucose oxidation within a three-species mixed culture remains a compelling area of study. This combination introduces diverse pyruvate utilization pathways that warrant further investigation [26]. Prior research evaluating the dual addition of threonine and glycine found that these amino acids did not affect starter culture growth or overall pH. However, media containing high threonine and low glycine concentrations stimulated acetaldehyde synthesis in the starter cultures [5]. Conversely, a high glycine and low threonine ratio suppressed acetaldehyde production. Furthermore, elevated threonine coupled with low glycine upregulated threonine aldolase activity in cell-free extracts from S. thermophilus and L. bulgaricus, whereas the inverse ratio suppressed enzyme activity [27]. Excessive threonine accumulation (above 3.0 g/L) can lead to an overproduction of glycine, which acts as a feedback inhibitor for threonine aldolase enzyme; signaling the bacteria to halt threonine conversion and rendering further supplementation ineffective.
Ethanol also serves as a minor flavor enhancer. In conventional cow’s milk yogurt, ethanol levels typically ranged from 0.20 to 9.90 mg/kg, whereas yogurt fermented with bifidobacteria exhibits higher concentrations. Storage duration affected the properties of volatile substances, which were characterized by changes in acetaldehyde concentration along with fluctuations in ethanol levels [28, 29].
Sensory evaluation is a critical determinant of dairy products quality and consumer preference. The sensory profile of fermented milk relies heavily on rapid initial acidification, which suppresses spoilage microorganisms, and the development of characteristic aromas, textures, and tastes [30]. Lactic acid bacteria enhance the overall quality of fermented food; their metabolic processes improve nutritional value and optimize sensory attributes [31]. Incorporating probiotic bacteria further enriches these profiles, introducing distinct flavor and textural properties [32]. Additionally, specific nutrient adjuncts, such as amino acids, stimulate the metabolic activity of starter cultures, inducing higher production of volatile flavor compounds [33]. In this study, bio-yogurt formulations with elevated flavor compound concentrations received superior scores from the sensory panel, resulting in higher overall acceptance. This underscores the importance of monitoring and optimizing volatile flavor profiles during dairy processing. These results align with several studies confirming that flavor compounds dictate consumer acceptance and that elevating their concentration enhances palatability and taste [34, 35].
Sensory evaluation demonstrated that yogurt supplementation with the highest concentration achieved the best performance. Consequently, flavor profiles can be successful by incorporating amino acids like threonine into probiotic dairy matrices, simultaneously boosting functional health benefits and marketability. Utilizing threonine as an industrial additive represents a practical, cost-effective innovation due to its capacity to enhance flavor, elevate nutritional value, and support fermentation dynamics, all while maintaining cost stability and regulatory compliance. Manufacturers should balance regional regulatory limits with optimal addition ratios to maximize efficacy. Future research should focus on elucidating the underlying biochemical mechanisms governing flavor evolution in probiotic-enriched dairy systems.
This study demonstrates that supplementing 10 mg/100 mL of threonine to bio-yogurt is a highly efficient and cost-effective industrial strategy to overcome the low aromaticity characteristics of probiotic strains. This amino acid-directed enrichment significantly stimulates (p < 0.05) the biosynthesis of key volatile compounds, specifically acetaldehyde, acetoin, and diacetyl, by activating the co-cultured starter bacteria (ST, Bb-12, and La-5). Importantly, the threonine addition does not cause any adverse change to the physicochemical properties (pH, acidity, and whey separation), while safely maintaining probiotic viability above the recommended limit (> 7.0 log CFU/g) throughout a 21-day refrigerated storage period. This dual optimization of flavor profile and sensory acceptance provides commercial dairy manufacturers with an ideal, scalable, and regulatory compliant pathway to producing innovative, health-promoting functional foods.
Bb-12: Bifidobacterium bifidum
HPLC: high-performance liquid chromatography
La-5: Lactobacillus acidophilus
MRS: De Man, Rogosa, and Sharpe
ST: Streptococcus thermophilus
WHC: water-holding capacity
STGAS: Conceptualization, Data curation, Formal analysis, Investigation, Methodology, Software, Visualization, Project administration, Writing—original draft. AKN: Conceptualization, Data curation, Formal analysis, Investigation, Methodology, Software, Visualization, Supervision, Validation, Writing—original draft, Writing—review & editing. Both authors read and approved the submitted version.
The authors declare that they have no conflicts of interest.
The study involved a standardized sensory evaluation of food products, and informed consent was obtained from all participants before testing. The protocol posed no health risks, and the Food Science department/University of Basrah exempted the study from formal ethical approval. Sensory assessment was conducted in accordance with the ethical principles of the Declaration of Helsinki.
Informed consent was obtained from all participants to participate in the sensory assessment in the study.
Not applicable.
The raw data supporting the conclusions of this manuscript will be made available by the authors, without undue reservation, to any qualified researcher.
The authors received no funding to complete this study.
© The Author(s) 2026.
Open Exploration maintains a neutral stance on jurisdictional claims in published institutional affiliations and maps. All opinions expressed in this article are the personal views of the author(s) and do not represent the stance of the editorial team or the publisher.
Copyright: © The Author(s) 2026. This is an Open Access article licensed under a Creative Commons Attribution 4.0 International License (https://creativecommons.org/licenses/by/4.0/), which permits unrestricted use, sharing, adaptation, distribution and reproduction in any medium or format, for any purpose, even commercially, as long as you give appropriate credit to the original author(s) and the source, provide a link to the Creative Commons license, and indicate if changes were made.



View: 375
Download: 12
Times Cited: 0


