 Original Article

Affiliation:
1Campo Experimental Mocochá, Centro de Investigación Regional Sureste, Instituto Nacional de Investigaciones Forestales, Agrícolas y Pecuarias (INIFAP), Mérida, CP 97454, México
ORCID: https://orcid.org/0000-0003-4805-4035
Affiliation:
1Campo Experimental Mocochá, Centro de Investigación Regional Sureste, Instituto Nacional de Investigaciones Forestales, Agrícolas y Pecuarias (INIFAP), Mérida, CP 97454, México
Affiliation:
2Facultad de Ingeniería Química, Universidad Autónoma de Yucatán, Mérida, CP 97203, México
ORCID: https://orcid.org/0000-0001-9748-3704
Affiliation:
2Facultad de Ingeniería Química, Universidad Autónoma de Yucatán, Mérida, CP 97203, México
Email: bancona@correo.uady.mx
ORCID: https://orcid.org/0000-0002-9206-3222
Explor Foods Foodomics. 2026;4:1010131 DOI: https://doi.org/10.37349/eff.2026.1010131
Received: September 09, 2025 Accepted: March 11, 2026 Published: April 01, 2026
Academic Editor: Yi Chen, Chinese Academy of Sciences, Huaiyin Institute of Technology, China
Aim: The common bean (Phaseolus vulgaris L.) is a vital source of protein, dietary fiber, minerals, and bioactive compounds in rural and low-income populations. The objective of this study was to evaluate the proximate composition, antinutritional factors, and cooking quality of four black bean varieties (Jamapa, Grijalva, Tacaná, and INIFAP) grown in stony soils of Southeastern Mexico.
Methods: Moisture, crude protein, crude fat, ash, crude fiber, and total carbohydrates were determined. The antinutritional factors assessed included cyanogenic glycosides, tannins, trypsin inhibitors, and phytates. Cooking quality was evaluated via cooking time and cooked grain hardness. All determinations were made in triplicate, and statistical differences among varieties were evaluated by one-way ANOVA with Tukey’s honestly significant difference (HSD) post-hoc test (p < 0.05).
Results: Significant differences were found between varieties (p < 0.05), with Jamapa and Grijalva standing out for their higher protein content (~27.5%) and, along INIFAP, for their low trypsin inhibitor content (~4 ITU/mg), while their phytate levels ranged between 46 and 65 mg/g. All antinutritional factors were found within acceptable ranges for human consumption. Regarding technological properties, the Tacaná variety exhibited the shortest cooking time (25.3 min) and cooked grain hardness (1.86 N), making it an attractive option for consumers and the food industry.
Conclusions: The evaluated bean varieties showed favorable nutritional profiles, low antinutrient concentrations, and superior cooking performance, rendering them suitable for human consumption. Their successful adaptation to stony-soil conditions underscores their potential to enhance agricultural and nutritional resilience in marginal environments.
Globally, new strategies are urgently needed to address the growing demands of food production in an increasingly globalized and borderless world. These strategies should recognize biodiversity as a key factor to enhance agricultural productivity and create opportunities that benefit rural producers and their social environments, particularly in developing countries [1].
Legumes are an essential food in plant-based diets and play a crucial role in mitigating climate change by reducing reliance on meat consumption and lowering production costs [2]. Their increasing global consumption, together with their high nutritional value, contributes to food security, enhances soil fertility through biological nitrogen fixation, and supports improved consumer health [3].
Among the leguminous plants, the genus Phaseolus, which includes several cultivated species such as Phaseolus vulgaris (common bean), Phaseolus lunatus (lima bean), Phaseolus acutifolius (tepary bean), Phaseolus polyanthus (year-bean), and Phaseolus coccineus (runner bean), stands out [4]. The common bean (P. vulgaris) is the most widely consumed legume in the world due to its availability, being a staple in the diet of Latin America, and representing a gluten-free ingredient widely used for dietary purposes [5].
Recently, the importance of the effects of food consumption on health has been emphasized, as epidemiological studies have shown that there is a relationship between people’s diet and the low incidence of diseases like cancer [6]. Common beans are an excellent source of protein, carbohydrates, dietary fiber, minerals, and vitamins [7]. In their natural form, they usually contain various metabolites, such as isoflavones, saponins, phytates, and tannins, which have bioactive effects that were considered as antinutritional factors but are currently being investigated under a new approach since their inclusion in the diet reduces the risk of suffering from chronic degenerative diseases. However, the presence of these compounds with antinutritional properties, such as phytic acid, lectins, raffinosaccharides, and protease inhibitors, may limit their nutritional value and their wider use in food preparations [8].
Common bean is a strategic product in Mexico, being the second most important agricultural product, after corn, in terms of cultivated area and number of dedicated farmers. The factors that determine the amount of beans produced are influenced by the agro-ecological conditions of the crop. Soil moisture availability during flowering and pod filling is a major agro-ecological factor affecting P. vulgaris yield. Water stress during these critical stages reduces seed set and weight due to flower abortion and shortened grain filling, limiting productivity in marginal soils such as those found in Southeastern Mexico [9]. Ramírez-Jaramillo et al. [10] indicated that the type of soil, temperature and precipitation, and the crop cycle are the determining factors to adequately define the zones with production potential, finding that it is possible to produce them in stony soils. Of these, those known as Nitisols and Luvisols (Ya’ax hom and K’ankab, respectively, by their Mayan names) turned out to be the most favorable soils for cultivation.
The factors that determine the quality of the bean can be divided into two categories: those related to consumer acceptance and those associated with nutritional value. The beans are traditionally used in the preparation of soups and salads, and are sometimes combined with cereals. There are some additional examples of their application, such as meat alternatives in food preparations and their use in the production of ready-to-eat products, which could promote an increase in consumption [11]. The objective of the present work was to determine the proximal chemical composition, antinutritional factors, and cooking process times of bean varieties (P. vulgaris) grown in stony soils under rainfed conditions.
The beans (P. vulgaris) were produced in plots at the Centro de Investigación Regional del Sureste of the Instituto de Investigaciones Forestales, Agrícolas y Pecuarias. The technical validation plots were established in the municipality of Tunkás (20°53’50” N, 88°45’17” W), located within the karstic plain in the center-east of Yucatán, Mexico, with an area of 2 ha where the bean varieties Tacaná, INIFAP, Grijalva, and Jamapa were established. The region is characterized by shallow, stony, calcareous soils developed over limestone bedrock, corresponding mainly to Rendzic Leptosols (Leptosoles). Soils are typically less than 25–30 cm deep, with a high proportion of rock fragments (> 2 mm) and silty-loam to sandy-loam texture, which are made up of a single stratum called the mollic horizon ‘A’, which rested on calcareous material with more than 40% calcium carbonate with a variable coloration between black and red passing through different shades of brown, with a medium texture showing a fine and weakly developed structure with a high content of organic matter, greater than 15% [12].
The physicochemical characteristics of the soils used in the experiment were a neutral to moderately alkaline pH (7.6), low electrical conductivity (< 0.5 dS/m), organic matter content of 5.5%, total nitrogen of 0.30%, and available phosphorus of 10 mg/kg. Exchangeable K, Ca, and Mg contributed to a moderate-to-high cation-exchange capacity (37 cmol+/kg–). These soils are heterogeneous, shallow, and highly porous (72%), conditions that restrict effective rooting depth and water retention, influencing the performance of P. vulgaris varieties cultivated under stony-soil environments. The plots were established in the spring-summer agricultural cycle. Beans were grown at a density of 260,000 plants ha–1 (70 cm between rows, 20 cm between plants). Fertilization was applied at the early vegetative stage using 200 kg ha–1 of 18-46-00 (N-P2O5-K2O). When necessary, irrigation was done with a center pivot system. Standard phytosanitary practices, including seed treatment with Captan 50 WP® and foliar applications of Benlate® and Agrimycu 100®, were used to prevent fungal diseases. Weed and pest control followed INIFAP recommendations for beans grown in stony soils. Harvesting was done when 70% of the plants reached physiological maturity [9], which became evident when the leaves changed from green to yellow and fell to the ground. Harvesting included cutting, drying, threshing, and cleaning. Cutting was done manually, and drying was done in the field. The plucked beans were placed in rows until they lost their moisture, and then they were cleaned by hand. For each variety, representative samples (50 kg of beans) were taken at random, homogenized, and divided by manual quartering to obtain 5 kg sub-samples that were ground in a Cemotec equipment (Tecator, Sweden) and sieved on an 80-mesh sieve to obtain flours with a particle size of 177 µm. The beans and flours were placed in plastic containers and stored refrigerated (4°C) until use.
The proximate composition of the samples was determined following the official analytical procedures established by the Association of Official Analytical Chemists (AOAC) [13]. All analyses were performed in triplicate, and the results were expressed on a dry basis (% db). The components evaluated were: moisture, ash, crude protein, crude fat, crude fiber, and total carbohydrates.
Two grams of each sample were weighed in previously dried aluminum moisture dishes and dried in a forced-air oven (Memmert UF55, Schwabach, Germany) at 110°C for 2 h until constant weight was achieved. The loss in weight was recorded as the moisture content.
The ash content was determined by incinerating approximately 2 g of each sample in a muffle furnace (Carbolite ELF 11/14B, Carbolite Gero Ltd., Hope, UK) at 550°C for 4 h until a constant grayish-white residue was obtained.
Nitrogen content was quantified using the Kjeldahl method with a fully automated digestion and distillation system (Kjeltec™ 8400, FOSS-Tecator, Höganäs, Sweden). Catalyst tablets containing potassium sulfate and copper sulfate (Sigma-Aldrich, St. Louis, MO, USA; Cat. No. 221856) and concentrated sulfuric acid (H2SO4; J.T. Baker, Phillipsburg, NJ, USA; Cat. No. 9681) were used for digestion. The protein content was calculated by multiplying the total nitrogen value by the conversion factor 5.83 [14].
Fat extraction was performed using a semi-automatic Soxhlet system (Soxtec™ 2050, FOSS-Tecator, Höganäs, Sweden). Approximately 2 g of each sample was extracted with analytical-grade hexane (Sigma-Aldrich; Cat. No. 296090) for 4 h. The solvent was evaporated, and the residue was dried and weighed to determine crude fat content.
The crude fiber content was quantified by sequential acid and alkaline digestion using a Fibertec™ 2010 System (FOSS-Tecator, Höganäs, Sweden). Samples were digested with H2SO4 (1.25%, v/v; J.T. Baker; Cat. No. 9681), followed by sodium hydroxide (NaOH 1.25%, w/v; Sigma-Aldrich; Cat. No. 306576). The residue was filtered, dried, and incinerated in a muffle furnace (Carbolite ELF 11/14B, Carbolite Gero Ltd., Hope, UK) at 550°C, and the difference in mass was used to calculate crude fiber content.
The total carbohydrate content was obtained by difference, subtracting the sum of the percentage values of crude protein, crude fat, crude fiber, and total ash from 100.
All reagents used were of analytical grade, and all instruments were calibrated prior to analysis.
The quantification of cyanogenic glycosides was done according to the method described by da Silva Pereira et al. [15], based on acid hydrolysis of cyanogenic compounds, followed by steam distillation and colorimetric determination of liberated hydrogen cyanide (HCN). Twenty grams of each finely ground sample were weighed on a semi-analytical balance (Ohaus Adventurer AX224, Parsippany, NJ, USA) and transferred into a 500 mL round-bottom flask connected to a steam distillation apparatus (FISATOM Model 218, São Paulo, Brazil). The condenser outlet was immersed in an Erlenmeyer flask containing 20 mL of NaOH solution (2.5%, w/v; Sigma-Aldrich, St. Louis, MO, USA; Cat. No. 306576) to trap the released HCN. Subsequently, 80 mL of distilled water and 20 mL of H2SO4 (10%, v/v; J.T. Baker, Phillipsburg, NJ, USA; Cat. No. 9681) were added to the distillation flask to initiate acid hydrolysis. Hydrolysis was carried out for 3 h under gentle heating to promote the breakdown of glycosidic bonds and the release of volatile HCN.
At the end of the hydrolysis step, 40 mL of 10% H2SO4 was added to the flask, and distillation was continued until 125 mL of distillate was collected. For the colorimetric determination, 5 mL aliquots of distillate were mixed with 5 mL of alkaline picrate solution (0.5%, w/v; Sigma-Aldrich; Cat. No. P7629) in glass test tubes. A reagent blank containing 5 mL of distilled water and 5 mL of the same alkaline picrate solution was prepared in parallel. The tubes were sealed and incubated in a thermostatic water bath (Julabo TW12, Seelbach, Germany) at 70°C for 10 min to allow color development. After cooling to room temperature, the absorbance of each solution was measured at 490 nm using a UV-visible spectrophotometer (Jenway 7315, Cole-Parmer, Staffordshire, UK). A calibration curve was constructed using sodium cyanide (NaCN) standard solutions (Sigma-Aldrich; Cat. No. 205557) at concentrations ranging from 50 to 250 µg CN–. Cyanide concentration in each distillate was determined from the calibration curve, and the total cyanide content of the samples was expressed as milligrams of HCN per 100 g of sample (mg HCN/100 g).
The determination of protease inhibitors was performed according to the spectrophotometric method described by Hasanaklou et al. [16]. Approximately 10 g of the ground sample was dispersed in 50 mL of 0.5 M NaCl solution (Sigma-Aldrich, St. Louis, MO, USA; Cat. No. S9888) and stirred for 30 min at room temperature (25°C) using a magnetic stirrer (IKA® C-MAG HS7, IKA-Werke GmbH, Staufen, Germany). The homogenate was centrifuged at 10,000 × g for 15 min in a refrigerated centrifuge (Eppendorf 5810 R, Eppendorf AG, Hamburg, Germany), and the supernatant was filtered through Whatman No. 42 filter paper (Cytiva, Marlborough, MA, USA; Cat. No. 1442-110) to obtain the extract for analysis.
A standardized trypsin solution (40 mg/mL) was prepared using bovine pancreatic trypsin (Sigma-Aldrich; Cat. No. T4799), and the substrate solution was prepared from N-benzoyl-DL-arginine p-nitroanilide hydrochloride (BAPNA; Sigma-Aldrich; Cat. No. B4875). The assay was based on the hydrolysis of BAPNA by trypsin, which releases p-nitroaniline, producing a yellow coloration measurable at 410 nm. For the assay, 2 mL of the extract was mixed with 2 mL of trypsin solution and 10 mL of BAPNA substrate in glass test tubes. A control reaction containing only the trypsin solution and substrate (without extract) was used to determine the uninhibited enzyme activity. The mixtures were incubated for 30 min at room temperature, and absorbance was measured at 410 nm using a UV-visible spectrophotometer (Jenway 7315, Cole-Parmer, Staffordshire, UK).
The color intensity, inversely proportional to the trypsin inhibitor concentration, was used to determine the inhibitory capacity of the extract. One trypsin unit (TU) was defined as a 0.01 unit increase in absorbance at 410 nm per 10 mL of reaction mixture. Trypsin inhibitor activity was expressed as inhibited TU (ITU) per gram of sample, corrected for dilution and sample weight.
The tannin content was determined according to the spectrophotometric procedure described by Wang et al. [17], with some modifications. One gram of the finely ground sample was extracted with 20 mL of a 75% (v/v) dimethylformamide solution (Sigma-Aldrich, St. Louis, MO, USA; Cat. No. D4551) under constant agitation for 30 min at room temperature (25 ± 2°C) using a magnetic stirrer (IKA® C-MAG HS7, IKA-Werke GmbH, Staufen, Germany). The mixture was centrifuged at 10,000 × g for 15 min in a refrigerated centrifuge (Eppendorf 5810 R, Eppendorf AG, Hamburg, Germany), and the supernatant was used as the extract for analysis.
A series of standard solutions of tannic acid (Merck, Darmstadt, Germany; Cat. No. 773) was prepared to generate a calibration curve. For the colorimetric reaction, aliquots of 2 mL of the sample extract or standard solution were transferred into 50 mL volumetric flasks and diluted with 35 mL of distilled water. Subsequently, 1 mL of Folin-Denis reagent (Sigma-Aldrich; Cat. No. F9252) and 2.5 mL of saturated sodium carbonate solution (Na2CO3; Sigma-Aldrich; Cat. No. S7795) were added. The mixtures were adjusted to volume with distilled water, homogenized, and allowed to react for 90 min at room temperature in the dark.
The absorbance of the resulting blue coloration was measured at 710 nm using a UV-visible spectrophotometer (Jenway 7315, Cole-Parmer, Staffordshire, UK) against a reagent blank. Tannin concentration was calculated from the standard calibration curve and expressed as milligrams of tannic acid per gram of dry sample.
The quantification of phytate was performed according to the procedure described by Siroli et al. [18]. One gram of the finely ground sample was extracted with 100 mL of 0.5 M hydrochloric acid (HCl; Sigma-Aldrich, St. Louis, MO, USA; Cat. No. 320331) under continuous stirring for 30 min at room temperature (25°C) using a magnetic stirrer (IKA® C-MAG HS7, IKA-Werke GmbH, Staufen, Germany). The suspension was filtered through Whatman No. 42 paper (Cytiva, Marlborough, MA, USA; Cat. No. 1442-110), and the resulting filtrate was used for the subsequent analysis.
The phytic acid present in the extract was precipitated by adding an excess of ferric chloride solution (FeCl3 solution; Sigma-Aldrich; Cat. No. 236489). The obtained precipitate was converted to sodium phytate by the addition of 2 mL of 2% NaOH solution (Sigma-Aldrich; Cat. No. 306576). The resulting material was subjected to acid digestion using an acid mixture containing equal volumes (1 mL each) of concentrated H2SO4 (J.T. Baker, Phillipsburg, NJ, USA; Cat. No. 9681) and 65% perchloric acid (HClO4; Sigma-Aldrich; Cat. No. 244252) to liberate inorganic phosphate.
After digestion, the mixture was filtered, and 5 mL of ammonium molybdate solution (5%, w/v; Sigma-Aldrich; Cat. No. A7302) was added to the filtrate. The reaction mixture was left to rest for 30 min at room temperature to allow color development through the formation of a phosphomolybdate complex. The absorbance of the resulting blue solution was measured at 520 nm using a UV-visible spectrophotometer (Jenway 7315, Cole-Parmer, Staffordshire, UK), with distilled water serving as the blank. A calibration curve was prepared using standard sodium phytate (Sigma-Aldrich; Cat. No. P8810), and the phytate concentration in each sample was determined from the standard curve. Results were expressed as milligrams of phytic acid per gram of sample (mg/g, db).
The cooking time of the bean varieties was determined following the method proposed by Ferreira et al. [19]. For each variety, 300 g of beans free of impurities, broken seeds, or visible defects were weighed using a semi-analytical balance (Ohaus Adventurer AX224, Parsippany, NJ, USA). The beans were soaked in 3 L of distilled water (Milli-Q®, Millipore-Sigma, Burlington, MA, USA) for 12 h at room temperature (25°C). After soaking, the water was drained, and the beans were transferred into a stainless-steel cooking pot (3 L capacity, Tramontina, Brazil).
The cooking process was performed using an open-pot method. Three liters of fresh distilled water were brought to a boil on an electric heating plate (IKA® C-MAG HS7, IKA-Werke GmbH, Staufen, Germany). Once the water reached 90°C (monitored with a thermometer, Hanna Instruments HI98501, Woonsocket, RI, USA), the beans were added, and the heat was reduced to maintain a gentle boil. Periodically, samples of 30 whole beans were removed using stainless-steel tongs, and each grain was manually tested for softness by pressing between the fingers, ensuring no hard center or separated cotyledons. The cooking time was recorded when at least 96% of the beans reached complete softening, as established by the sensory endpoint criterion of Mattson [20].
After the cooking time was established for each variety, bean hardness was measured using an Instron Universal Testing Machine (Model 4411, Instron Corp., Norwood, MA, USA) equipped with a 5 kg load cell (Instron Cat. No. 2530-428). Thirty cooked beans from each variety were individually compressed to 80% of their original height using a stainless-steel cylindrical probe (35 mm diameter; Instron Cat. No. 2830-015) at compression rate of 10 mm/min. The tests were performed at room temperature (25°C). Hardness was determined as the maximum peak force observed during the compression cycle and expressed as Newtons (N). All measurements were performed in triplicate for each variety, and results were reported as mean ± standard deviation.
All results were analyzed using descriptive statistics with central tendency and dispersion measures. One-way ANOVAs were run to evaluate the effect of varieties on chemical components, the antinutrients, and cooking properties. A Tukey’s post hoc multiple range test was used to determine differences between varieties, with a significance level of 5%. Before performing the ANOVA, the normality of the data was verified with the Shapiro-Wilk test and the homogeneity of variances with the Levene’s test. All analyses were processed with the Statgraphics 19-X64 software.
The proximate composition of P. vulgaris varieties grown on stony soils showed statistically significant differences (p < 0.05) in all parameters analyzed (Table 1). The values fall within the general ranges reported for the Phaseolus species. Protein content was high and homogeneous across the four varieties, slightly exceeding values indicated for dry beans with ~16–25% db [21]. These values are comparable to or higher than those described for high-protein landraces and improved cultivars of P. vulgaris [22]. These results indicate that the varieties grown under stony soil conditions represent excellent protein sources, potentially influenced by the genetic background and the edaphic environment of the region that influences nutrient accumulation in beans [23].
Chemical composition of Phaseolus vulgaris varieties grown in stony soils (% db, except moisture).
| Component | Phaseolus vulgaris varieties | |||
|---|---|---|---|---|
| Jamapa | Grijalva | Tacaná | INIFAP | |
| Moisture | (7.24 ± 0.22c) | (8.10 ± 0.16b) | (9.05 ± 0.12a) | (9.10 ± 0.20a) |
| Protein | 27.49 ± 0.15a | 27.52 ± 0.18a | 26.93 ± 0.16b | 27.22 ± 0.10a |
| Crude fat | 1.99 ± 0.06b | 1.97 ± 0.08b | 2.65 ± 0.16a | 2.62 ± 0.10a |
| Crude fiber | 2.18 ± 0.10b | 3.02 ± 0.16a | 1.98 ± 0.10c | 2.30 ± 0.14b |
| Ash | 3.42 ± 0.17d | 4.29 ± 0.14b | 4.05 ± 0.12c | 4.63 ± 0.21a |
| Carbohydrates (as NFE) | 64.92 ± 0.32a | 63.20 ± 0.21c | 64.39 ± 0.22b | 63.23 ± 0.28c |
The data represent the average value ± standard deviation. a–d: different superscripts in a row indicate significant statistical differences (p < 0.05) among the four bean varieties according to one-way ANOVA followed by Tukey’s honestly significant difference (HSD) post hoc test. db: dry basis; NFE: nitrogen-free extract.
Crude fat content ranged from 1.97 to 2.65% db, which was in the upper end of the range reported by Rodríguez Madrera et al. [24] for common beans (0.3–2.5% db). Varietal genetic factors and environmental and soil characteristics favor lipid accumulation, as previously indicated for certain Phaseolus genotypes cultivated under stress conditions [25]. Crude fiber (1.98–3.02% db) and ash (3.42–4.63% db) values exhibited significant intervarietal variation, with ash contents aligning with the typical range for dry beans (~3–5% db) and fiber levels comparable to those widely reported in recent studies [21, 26].
Carbohydrates as NFE content were consistent with the starch-rich nature of P. vulgaris and with reports showing wide carbohydrate variability (55–75% db) depending on genotype and environmental conditions [26, 27]. Overall, the proximate composition profile of the four varieties in the study was typical for dry beans, but stood out for its relatively high protein concentration and slightly elevated lipid content. These compositional traits may have both nutritional and technological implications, for example, influencing flour formulation, cooking behavior, and processing quality.
The antinutritional factors found in the four varieties of P. vulgaris (Jamapa, Grijalva, Tacaná, and INIFAP) grown in stony soils (Table 2) showed statistically significant differences (p < 0.05) among them.
Antinutritional factors content in Phaseolus vulgaris varieties grown in stony soils.
| Antinutrient | Phaseolus vulgaris varieties | |||
|---|---|---|---|---|
| Jamapa | Grijalva | Tacaná | INIFAP | |
| Cyanogenic glycosides (mg HCN/100 g) | 4.08 ± 0.42c | 6.72 ± 0.21a | 5.61 ± 0.12b | 6.98 ± 0.12a |
| Trypsin inhibitors (ITU) | 7.87 ± 0.35a | 4.19 ± 0.18b | 4.05 ± 0.23b | 4.22 ± 0.15b |
| Tannins (mg tannic acid/g) | 0.45 ± 0.06a | Tracesb | Tracesb | Tracesb |
| Phytates (mg phytic acid/g) | 65.2 ± 3.1a | 32.4 ± 1.2c | 50.7 ± 2.2b | 46.1 ± 3.3b |
The data represent the average value ± standard deviation. a–c: different superscripts in a row indicate significant statistical differences (p < 0.05) among the four bean varieties according to one-way ANOVA followed by Tukey’s honestly significant difference (HSD) post hoc test. HCN: hydrogen cyanide; ITU: inhibited trypsin unit.
Evaluation of cooking time and hardness in P. vulgaris beans grown on stony soils revealed statistically significant differences (p < 0.05) among varieties. Among the cultivars evaluated, Grijalva had the longest cooking time, followed by INIFAP and Jamapa, while Tacaná had the shortest cooking time with 25.3 min (Figure 1). Grijalva, Jamapa, and INIFAP varieties recorded the highest hardness values with ~2.26 N, while Tacaná presented the lowest (Figure 2).
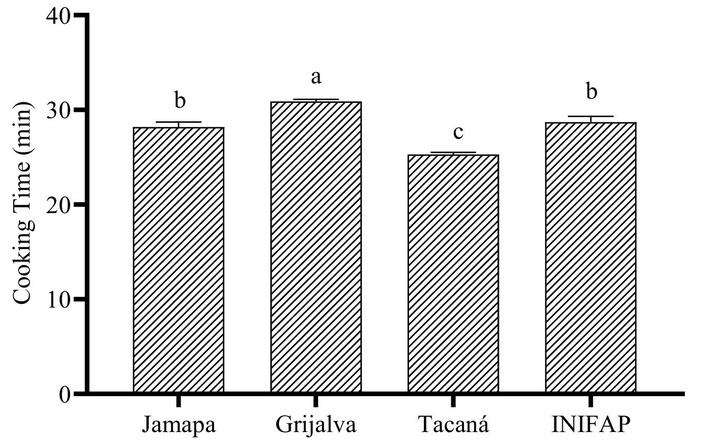
Cooking time (min) of cooked Phaseolus vulgaris bean varieties grown in stony soils. a–c: different superscripts indicate significant statistical differences (p < 0.05) among the four bean varieties according to one-way ANOVA followed by Tukey’s honestly significant difference (HSD) post hoc test.
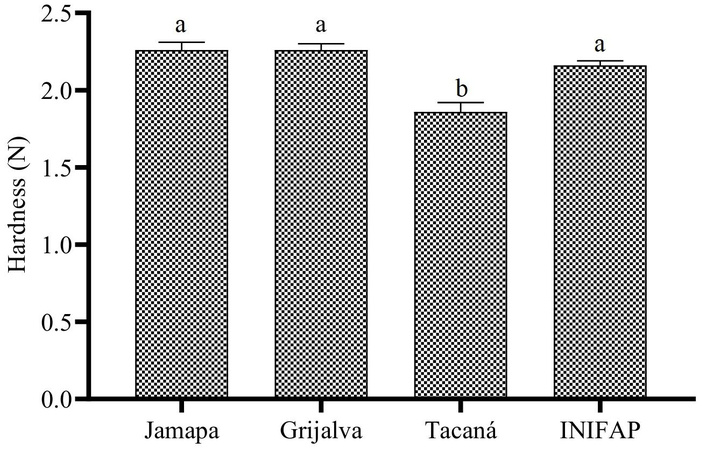
Hardness (N) of cooked Phaseolus vulgaris bean varieties grown in stony soils. a and b: different superscripts indicate significant statistical differences (p < 0.05) among the four bean varieties according to one-way ANOVA followed by Tukey’s honestly significant difference (HSD) post hoc test.
Moisture content ranged from 7.24% in the Jamapa variety to 9.10% in the INIFAP. These values were consistent with those reported for dry legumes, where moisture content is generally less than 12%, which favors stability and reduces the risk of microbiological contamination during storage. However, higher moisture content, like in the Tacaná variety, could shorten shelf life if optimal storage conditions are not managed [28].
The Jamapa variety stood out for their high protein levels (~27.5%), which exceed the averages reported for common beans (20–25%) and represent a relevant source of low-cost, high biological value vegetable protein in developing regions [29]. These results suggest that these varieties could have a high potential for human nutrition programs and for the development of value-added food formulations.
The Tacaná and INIFAP varieties had the highest levels of crude fat (~2.6%), which implies a higher energy density and possible functional contributions when considering that beans are rich in unsaturated fatty acids [30]. Although lipid levels in legumes are generally low, their qualitative composition could positively influence cardiovascular health [31].
The crude fiber content was higher in the Grijalva variety (3.02%), a value that may provide physiological benefits, such as improving intestinal motility and reducing glucose and cholesterol absorption. Dietary fiber from beans has been associated with prebiotic effects and the prevention of chronic non-communicable diseases [32].
Ash content was the highest in INIFAP (4.63%), followed by Grijalva (4.29%), which suggests a higher intake of macro- and micronutrients such as iron, zinc, magnesium, and calcium, essential in the prevention of nutritional deficiencies. The observed variability may have been related both to genetics and to the ability of plants to absorb and accumulate minerals in stony soils [23]. The high ash content observed in the four P. vulgaris varieties evaluated suggests a notable total mineral residue in the seeds; however, ash does not allow identification of specific mineral contributions. Common beans typically contain Fe within 9–150 mg/kg, Zn within 30–65 mg/kg, and Ca and Mg commonly ranging from 59–123 mg/kg and 6.5–11 mg/kg, respectively, varying according to genotype and growing environment [1, 33]. These ranges are consistent with the magnitudes of ash reported in the present study. Since the varieties were cultivated on shallow calcareous stony soils, it is plausible that high Ca and Mg availability in this edaphic setting may influence mineral uptake, while high Ca and alkaline pH may restrict Fe and Zn bioavailability through competitive and sorption processes [34]. Therefore, while our results support the presence of substantial mineral content, confirmation of element-specific concentrations and soil-plant transfer mechanisms remains a necessary objective for future research.
The carbohydrate content was higher in Jamapa, followed by Tacaná, which indicates a higher proportion of starches that could be used as an energy source. However, beans have also been reported to contain resistant starch, which may modulate the postprandial glycemic response [35]. Varieties with a lower proportion of carbohydrates, such as Grijalva and INIFAP, suggest a more functional profile from a point of view of nutrient supply.
The results indicated that the nutritional composition of common beans is influenced by both variety and edaphic conditions, which would allow the selection of specific genotypes for nutraceutical or technological applications. In particular, the Grijalva and INIFAP varieties stand out for their higher nutritional density, while Jamapa could be more suitable for products with higher energy content.
Cyanogenic glycosides, compounds capable of releasing HCN during digestion, were present in all varieties, with values ranging from 4.08 to 6.98 mg HCN/100 g. Grijalva and INIFAP had the highest values, while Jamapa showed the lowest content, indicating varietal differences in the synthesis of these compounds. Comparatively, Palupi et al. [36] found similar levels of cyanogenic glycosides in lima bean (P. lunatus) flour, with values of 3.1 mg/100 g. However, all values were below the acute toxic threshold for humans (50–60 mg HCN/100 g) and can be reduced by conventional thermal treatments such as soaking and cooking [37].
Trypsin inhibitors were significantly (p < 0.05) higher in the Jamapa variety with 7.87 ITU compared to Grijalva and Tacaná (~4 ITU). These values place Jamapa within the range commonly reported for P. vulgaris accessions with moderate ITU and the other three varieties within the range described as low-to-moderate. Recent studies indicated wide trypsin inhibitor activity variability across cultivars, with values below ~10 TIU/mg in raw seed of common black bean [25]. These compounds interfere with the activity of digestive proteases, decreasing the protein digestibility of food [38]. However, they are thermolabile and can be inactivated by cooking or other thermal processes [39]. These authors indicate an 80 to 90% reduction in inhibitor content when beans are subjected to soaking and heat treatments.
Regarding tannins, only the Jamapa variety showed detectable amounts (0.45 mg tannic acid/g), while only trace amounts were detected in the other varieties. These levels can be considered insignificant from a toxicological perspective. Corzo-Ríos et al. [40] found tannin content values between 0.62 and 12.02 mg/g in raw beans of P. vulgaris and P. coccineus, which showed a reduction ranging from 17 to 85% as a result of the cooking process. Although tannins can form complexes with proteins and minerals, they have also been reported to possess antioxidant and antimicrobial properties, so their presence, even in low concentrations, could contribute in a functional way to the diet [41].
Phytates were present in varying amounts (p < 0.05) in all varieties, with the highest concentration in Jamapa (65.2 mg/g) and the lowest in Grijalva (32.4 mg/g). These values were comparable to those found by Nagessa et al. [42] in common bean varieties, with contents between 10.4 and 29.3 mg/g in common black beans, 5.0 and 27.0 mg/g in great northern beans, 61 and 23.8 mg/g in pinto beans, 8.1 and 20.7 mg/g in red beans, 12.0 and 26.3 mg/g in red kidney beans, and 5.5 and 18.0 mg/g in white beans. Phytates are known chelators of minerals, which can decrease their bioavailability. However, their negative impact can be counteracted by soaking, fermentation, or germination. In this sense, these same authors found that unprocessed beans had an average phytate concentration of 52.25 mg/g, while overnight soaking in water reduced it to 42.95 mg/g, and overnight soaking with pressure cooking reduced it to 33.8 mg/g.
The data for the antinutritional factors indicated that, although there are significant varietal differences in content, the concentrations found remain within acceptable limits for human consumption. In addition, these compounds can be reduced or eliminated by traditional and technological processing techniques, which reinforces the value of these varieties as accessible and safe sources of nutrients.
According to Tafiire et al. [43], these variations can be attributed to differences in the thickness of the testa, the structure of the cotyledon, and the biochemical composition of the varieties. These factors affect the rate of water absorption and starch gelatinization during cooking due to the composition of the proteins in their Osborne fractions and the amylose/amylopectin ratio [44].
The lower hardness in Tacaná is related to its shorter cooking time, which is desirable from a technological and consumer standpoint, since it implies less energy use and a softer texture after cooking [45]. Recent studies have reported a strong inverse correlation between bean hardness and cooking time, which coincides with the results of the present study [43]. This relationship is important not only to improve the sensory acceptability of cooked beans but also to optimize industrial processes and reduce energy consumption during preparation. In addition, shorter cooking times allow for better preservation of heat-sensitive compounds, such as vitamins and antioxidants, thus increasing the nutritional value of the final product [46].
The chemical, antinutrient and cooking-quality profiles observed in Jamapa, Grijalva, Tacaná, and INIFAP support their targeted inclusion in common-bean breeding programs. These varieties combine a notably high and stable seed protein concentration (~27% db), low trypsin-inhibitor activity (≈ 4 ITU/mg in three varieties) and, in the case of Tacaná, superior cooking performance with short cooking time and low cooked grain hardness, traits that are genetically variable, heritable, and relevant for both nutrition and consumer acceptance. Recent reviews and empirical studies emphasize that consumer-preferred traits such as reduced cooking time and high protein are amenable to selection and correlate with market uptake. The breeding can reduce key antinutrients to improve micronutrient bioavailability without penalizing yield, and modern genomic prediction and pre-breeding strategies accelerate the introgression of stress-adaptation and quality traits into elite backgrounds, especially for marginal soils. Together, these lines of evidence indicate that the genotypes characterized here are valuable donor material for breeding pipelines aimed at improving nutritional quality, processing traits, and resilience in stony-soil agroecosystems [8, 47].
P. vulgaris varieties grown on stony soils in Southeastern Mexico showed outstanding nutritional characteristics and levels of antinutritional factors within safe ranges for human consumption. Jamapa and Grijalva varieties showed the highest protein content, and Tacaná had the most favorable values in terms of cooking and texture, making it ideal for food applications and consumer acceptance. Grijalva and INIFAP, for their high protein, fiber, and mineral contents, low antinutrients, and moderate cooking time, also represent promising varieties. These techno-functional qualities are relevant not only for domestic preparation but also for the processed food industry that values the reduction in cooking time and energy, with the Tacaná variety of particular relevance in this aspect. Given their high protein content, low antinutrient levels, and favorable cooking characteristics, the Jamapa, Grijalva, Tacaná, and INIFAP common bean varieties are recommended as promising germplasm for breeding programs focused on nutritional quality, consumer-oriented processing traits, and adaptation to marginal stony soils. Incorporation of these varieties into breeding and genomic-assisted selection efforts should facilitate the development of improved cultivars that enhance food security and dietary quality in vulnerable rural regions.
AOAC: Association of Official Analytical Chemists
BAPNA: N-benzoyl-DL-arginine p-nitroanilide hydrochloride
db: dry basis
H2SO4: sulfuric acid
HCN: hydrogen cyanide
ITU: inhibited trypsin unit
N: Newtons
NaOH: sodium hydroxide
NFE: nitrogen-free extract
TU: trypsin unit
YMO: Investigation, Formal analysis, Methodology. EEV: Investigation, Formal analysis, Funding acquisition, Methodology. LCG: Methodology, Formal analysis, Writing—review & editing. DBA: Conceptualization, Investigation, Formal analysis, Methodology, Project administration, Writing—original draft, Writing—review & editing. All authors read and approved the submitted version.
The authors declare that there are no conflicts of interest.
Not applicable.
Not applicable.
Not applicable.
Datasets are available from the corresponding author upon request.
The authors wish to thank the Instituto Nacional de Investigaciones Forestales, Agrícolas y Pecuarias (INIFAP) of the state of Yucatán for the financial support provided during the research [FPY-2003]. The funder had no role in study design, data collection and analysis, decision to publish, or preparation of the manuscript.
© The Author(s) 2026.
Open Exploration maintains a neutral stance on jurisdictional claims in published institutional affiliations and maps. All opinions expressed in this article are the personal views of the author(s) and do not represent the stance of the editorial team or the publisher.
Copyright: © The Author(s) 2026. This is an Open Access article licensed under a Creative Commons Attribution 4.0 International License (https://creativecommons.org/licenses/by/4.0/), which permits unrestricted use, sharing, adaptation, distribution and reproduction in any medium or format, for any purpose, even commercially, as long as you give appropriate credit to the original author(s) and the source, provide a link to the Creative Commons license, and indicate if changes were made.

View: 1092
Download: 52
Times Cited: 0
