Original Article

Affiliation:
UO Malattie Cardiovascolari, Ospedale San Luca, 55100 Lucca, Italy
Email: lacortig@tin.it
ORCID: https://orcid.org/0000-0002-1804-4939
Affiliation:
UO Malattie Cardiovascolari, Ospedale San Luca, 55100 Lucca, Italy
Affiliation:
UO Malattie Cardiovascolari, Ospedale San Luca, 55100 Lucca, Italy
Affiliation:
UO Malattie Cardiovascolari, Ospedale San Luca, 55100 Lucca, Italy
Explor Cardiol. 2023;1:49–58 DOI: https://doi.org/10.37349/ec.2023.00007
Received: May 19, 2023 Accepted: June 09, 2023 Published: September 18, 2023
Academic Editor: Simon Rabkin, University of British Columbia, Canada
Aim: Transthoracic echocardiography (TTE) is the first-line imaging test for patients with chronic coronary syndrome (CCS) and the cornerstone of risk stratification is left ventricular (LV) ejection fraction (EF). Aim of the study was to investigate the value of TTE supplemented with strain echocardiography (STE) and lung ultrasound (LUS) to assess the risk of patients with CCS.
Methods: In a prospective, single-center, observational study, from November 2020 to December 2022, 529 consecutive patients with CCS were recruited. All patients were evaluated at rest. A single vendor machine (GE Vivid E95) was used. EF with biplane Simpson’s method (abnormal cut-off < 50%), LV global longitudinal strain (GLS%, abnormal cut-off ≤ 16.2% by receiver-operating characteristics analysis) by STE, and B-line score (abnormal cut-off ≥ 2) by LUS (4-site simplified scan) were assessed. Integrated TTE score ranged from 0 (all 3 parameters normal) to 3 (all parameters abnormal). All patients were followed-up and a composite endpoint was considered, including all-cause death, acute coronary syndrome (ACS), and myocardial revascularization.
Results: During a follow-up of 14.2 months ± 8.3 months, 72 events occurred: 10 deaths, 11 ACSs, and 51 myocardial revascularizations. In multivariable analysis, B lines [hazard ratio (HR) 1.76, 95% confidence Interval (CI) 1.05–2.97; P = 0.03], and GLS ≤ 16.2% (HR 2.0, 95% CI 1.17–3.45; P = 0.01) were independent predictors of events. EF < 50% was a significant predictor in univariate, but not in multivariable analysis. Event rate at 2 years increased from score 0 (8%), to score 1 (21%), 2 (23%), and 3 (40%), P < 0.0001.
Conclusions: TTE with left ventricular ejection fraction (LVEF) can be usefully integrated with STE for GLS, and LUS for B-lines, for better prediction of outcome in CCS. The 3 parameters can be obtained in every echo lab with basic technology, no harm, no risk, and no stress.
Transthoracic echocardiography (TTE) is the first-line test for the diagnostic and prognostic evaluation of patients with chronic coronary syndromes (CCSs), due to widespread availability, low cost, safety, portability, and versatility [1, 2]. In particular, left ventricular (LV) ejection fraction (EF) is the cornerstone of risk stratification and disease phenotyping [3, 4]. Recently, the TTE study has been enriched with new variables of proven value in risk stratification, assessing myocardial deformation with strain echocardiography (STE) and longitudinal function with global longitudinal strain (GLS) [5], and pulmonary congestion with lung ultrasound (LUS) and B-lines [6].
The hypothesis of the study was that a resting evaluation of EF by TTE, GLS by STE, and B-lines by LUS may offer independent and additive prognostic information in CCS since they focus on 3 interdependent but distinct phenotypes: LV function (including longitudinal, circumferential and mostly radial function) with EF, myocardial deformation and LV subendocardial, longitudinal function with GLS, and pulmonary congestion with B-lines. To test this hypothesis, a comprehensive resting TTE (consisting of TTE, STE, and LUS) was performed in all comers with CCS referred for clinically indicated TTE.
In this prospective study, consecutive CCSs patients referred to the echocardiography lab of the Lucca Hospital for a diagnostic evaluation from November 2020 to December 2022 were initially considered. The inclusion criteria were: 1) age > 18 years; 2) TTE of acceptable quality at rest; 3) no severe valvular or pericardial disease, pulmonary hypertension, acute and chronic inflammatory heart disease, severe bronchial asthma and/or chronic obstructive pulmonary disease or non-cardiac prognosis-limiting disease such as an advanced cancer; 4) willingness to give their written informed consent allowing scientific utilization of observational data, respectful of privacy rights.
Written informed consent was obtained in all patients. The study complies with the Declaration of Helsinki and was approved by the institutional ethics committee (Azienda USL Toscana Nordovest, decreto N. 1954, June 19, 2018).
The same commercially available machine [GE Vivid E95 (General Electric, Boston, MA, USA)] was used throughout the study period. All patients underwent comprehensive TTE at rest including assessment of the regional wall motion score index in a 16-segment model of the left ventricle, valvular function, and diastolic function. Modified biplane Simpson’s method was used to measure LV volumes and EF [7]. An average value of EF < 50%, as calculated from biplane method, was considered abnormal.
Per current recommendations, 2D-speckle tracking echocardiography was conducted for all patients offline. The frame rate was > 40 frames/s. Peak systolic LV-GLS was calculated using the average of 16 segment values (6 basal, 6 mid, and 4 apical segments) [8]. Due to the vendor-dependence of this parameter, an absolute GLS value ≤ 16.2% was considered abnormal being the best cut-off to predict events on a receiver-operating characteristics analysis [area under the curve 0.65, 95% (confidence Interval) CI 0.61–0.69; sensitivity 64%, specificity 61%] and broadly corresponding to the data proposed in the literature [9].
The same cardiac transducer was used for TTE and LUS. A 4-site simplified scan was adopted. At each site, B-lines (from 0 to 10) were counted, and a cumulative score (from 0 to 10) was obtained for each patient. An absolute B-lines value ≥ 2 units was considered abnormal [10].
TTE response was also summarized with an EF-B-lines-GLS score ranging from 0 to 3 as follows: score 0 (all markers within normal limits) or score 1–3, according to the number of abnormal steps (e.g., score 3 indicated all 3 steps were abnormal).
No patient was lost to follow-up. Deaths were identified from the national health service database while nonfatal events from review of the patient’s chart. Assessors were blinded to clinical and TTE results. The primary outcome measure was a composite endpoint of all-cause death, acute coronary syndrome (ACS; non-fatal myocardial infarction, hospitalization for unstable angina), and myocardial revascularization.
Categorical data are expressed in terms of the number of subjects and percentages while continuous data are expressed as mean ± standard deviation (SD). The cut-off values were determined a priori on the basis of existing literature for EF and B-lines and with a receiver-operating characteristics analysis for GLS. Kaplan Meier curves were used to evaluate and compare event-free survival while Cox regression was used to identify variables associated with the risk of future events. Univariable analyses by Cox proportional hazards models were performed to assess the association between each variable and the outcome. All variables with P < 0.10 in the univariable analysis were considered for inclusion in the Cox proportional hazards model and the variance inflation factor was used to assess collinearity. The incremental value of each parameter was evaluated comparing multivariable models with and without individual steps using global χ2 value to evaluate the improvement of goodness-of-fit. Statistical significance was set at P < 0.05. SPSS 13.0, Chicago, IL, USA was used for analysis.
Of the initial population of 558 patients, 28 were discarded for at least one of the following exclusion criteria: 1) poor-quality echo images at rest (n = 7); 2) images of adequate quality for EF assessment by eye, but not suitable for LV volumetric assessment (n = 7); 3) images adequate for quantitative volumetric assessment of EF, but unsuitable for quantitative, offline GLS measurement (n = 14). No patient was dismissed for poor LUS quality. The overall success rate on the initial population of 558 patients was 544/558 (97%) for quantitatively assessed EF, 530/558 (95%) for GLS, and 558/558 (100%) for B-lines: P < 0.0001 vs. EF and GLS. The final study population consisted of 529 patients with complete TTE, LUS, and GLS information. Of these patients, 58 (11%) had EF < 50%, 108 (20%) had B-lines ≥ 2, and 223 (42%) had GLS ≤ 16.2%.
The main clinical characteristics of the 529 study patients are described in Table 1.
Clinical and echocardiographic findings of the study population
| Variable | Data |
|---|---|
| Clinical findings | |
| Age (years) | 68 ± 10 |
| Male sex | 341 (64%) |
| BMI (kg/m2) | 26.8 ± 4.3 |
| BMI ≥ 30 | 104 (20%) |
| Diabetes mellitus | 142 (27%) |
| Arterial hypertension | 344 (65%) |
| Hypercholesterolemia | 324 (61%) |
| Current smoker | 112 (21%) |
| Left bundle branch block | 26 (5%) |
| Permanent atrial fibrillation | 21 (4%) |
| Paced rhythm | 15 (3%) |
| Prior myocardial infarction | 98 (18%) |
| Prior CABG | 15 (3%) |
| Prior PCI | 125 (24%) |
| Known CAD | 150 (28%) |
| Ongoing medical therapy | |
| Angiotensin-converting-enzyme inhibitors | 151 (28%) |
| Angiotensin receptor blocker | 105 (20%) |
| Calcium-antagonist | 123 (23%) |
| β-Blocker | 189 (36%) |
| Statin | 309 (58%) |
| Antiplatelet | 229 (43%) |
| Anticoagulant | 31 (6%) |
| Echocardiographic findings | |
| Heart rate (beats/min) | 68 ± 11 |
| SBP (mmHg) | 134 ± 16 |
| DBP (mmHg) | 79 ± 9 |
| LVEDV (mL) | 88 ± 28 |
| LVESV (mL) | 37 ± 19 |
| SBP/LVESV | 4.4 ± 1.8 |
| LVEF | 59 ± 9 |
| LVEF < 50% | 58 (11%) |
| B-lines | 1.4 ± 3.8 |
| B-lines ≥ 2 | 108 (20%) |
| GLS (%) | 16.3 ± 3.2 |
| GLS ≤ 16.2% | 223 (42%) |
The data presented are mean ± SD or number (%) of patients. BMI: body mass index; CABG: coronary artery bypass grafting; PCI: percutaneous coronary intervention; CAD: coronary artery disease; SBP: systolic blood pressure; DBP: diastolic blood pressure; LVEDV: left ventricular end-diastolic volume; LVESV: left ventricular end-systolic volume; LVEF: left ventricular ejection fraction
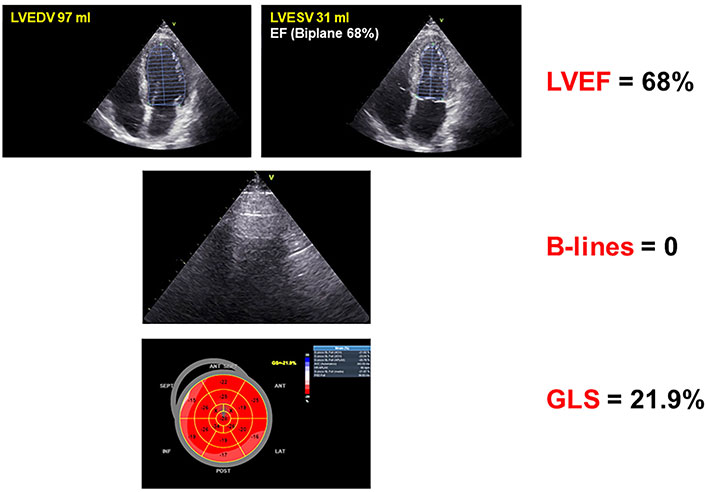
An example of a fully normal response (normal EF, normal GLS, and B-lines) with a score = 0 is shown in Figure 1.
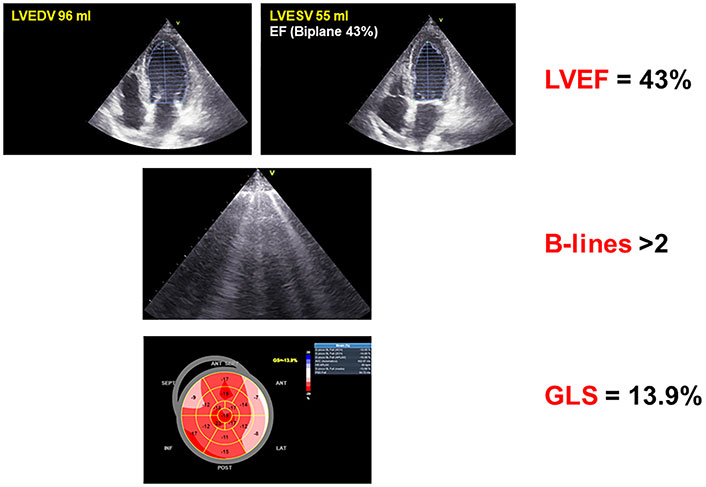
An example of a fully abnormal response (low EF, reduced GLS, and B-lines) with a score = 3 is shown in Figure 2.
After a mean follow-up time of 14.2 months ± 8.3 months, 72 events occurred: 10 deaths, 11 ACSs (8 non-fatal myocardial infarctions, 3 hospitalizations for unstable angina), and 51 myocardial revascularizations (14 surgeries and 37 angioplasties). The event rate was lower in patients with EF ≥ 50% compared to patients with EF < 50% (Figure 3 upper panel), lower in patients with B-lines < 2 compared to patients with B-lines ≥ 2 (Figure 3 middle panel), and lower in patients with GLS > 16.2% compared to patients with GLS ≤ 16% (Figure 3 lowest panel). In multivariable analysis of the whole cohort, B-lines ≥ 2 [hazard ratio (HR) 1.76, 95% CI 1.05–2.97; P = 0.03] and GLS ≤ 16.2% (HR 2.00, 95% CI 1.17–3.45; P = 0.01) were independent predictors of events together with permanent atrial fibrillation (HR 2.90, 95% CI 1.38–6.07; P = 0.005) (Table 2). EF < 50% predicted outcome at univariable (HR 1.87, 95% CI 1.03–3.4; P = 0.04) but was not significant in multivariable analysis. In stepwise incremental analysis, B-lines ≥ 2 and GLS ≤ 16.2% added significant prognostic value to clinical variables, including permanent atrial fibrillation (Figure 4). The event rate rose progressively from TTE score 0 to score 1–2 to score 3, which showed a 5-fold higher event rate compared to score 0 (Figure 5).
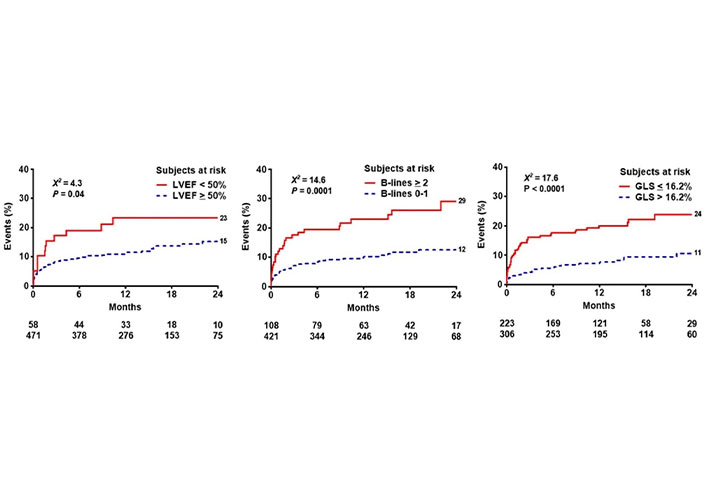
Reverse Kaplan-Meier curves show that abnormal values of EF (left panel), B-lines (middle panel), and GLS (right panel) are associated with worse event-free survival
Univariate and multivariate prognostic predictors
| Variables | Univariate analysis | Multivariate analysis | ||
|---|---|---|---|---|
| HR (95% CI) | P | HR (95% CI) | P | |
| Age | 1.02 (0.99–1.04) | 0.09 | ||
| Male sex | 1.80 (1.04–3.10) | 0.03 | ||
| BMI ≥ 30 | 1.51 (0.89–2.55) | 0.12 | ||
| Diabetes mellitus | 1.62 (1.00–2.62) | 0.05 | ||
| Arterial hypertension | 1.46 (0.87–2.45) | 0.15 | ||
| Hypercholesterolemia | 1.02 (0.63–1.63) | 0.94 | ||
| Current smoker | 1.04 (0.60–1.82) | 0.88 | ||
| Left bundle branch block | 0.54 (0.13–2.20) | 0.39 | ||
| Permanent atrial fibrillation | 4.81 (2.46–9.40) | < 0.0001 | 2.90 (1.38–6.07) | 0.005 |
| Paced rhythm | 1.44 (0.45–4.58) | 0.54 | ||
| Prior myocardial infarction | 2.07 (1.25–3.41) | 0.005 | ||
| Prior CABG | 1.62 (0.51–5.15) | 0.41 | ||
| Prior PCI | 1.45 (0.88–2.39) | 0.15 | ||
| β-Blocker therapy | 1.14 (0.71–1.84) | 0.58 | ||
| LVEDV | 1.01 (1.00–1.02) | 0.005 | ||
| LVESV | 1.01 (1.00–1.02) | 0.006 | ||
| SBP/LVES volume | 0.90 (0.79–1.04) | 0.15 | ||
| LVEF < 50% | 1.87 (1.03–3.42) | 0.04 | ||
| B-lines ≥ 2 | 2.45 (1.52–3.96) | < 0.0001 | 1.76 (1.05–2.97) | 0.03 |
| GLS ≤ 16.2% | 2.69 (1.66–4.36) | < 0.0001 | 2.00 (1.17–3.45) | 0.01 |
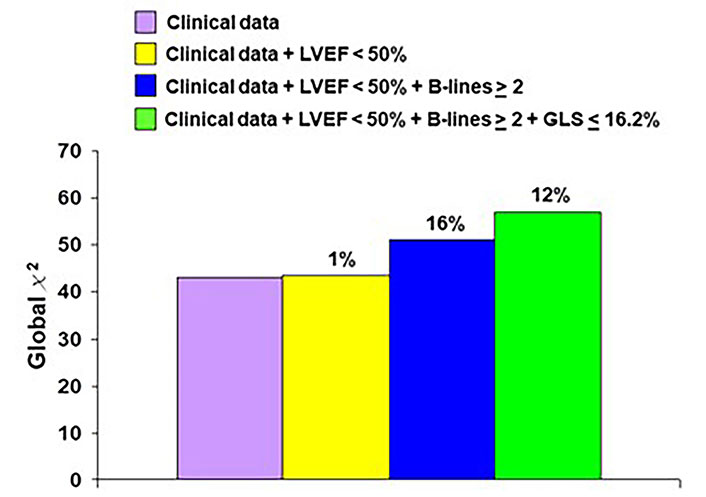
Incremental prognostic variables of imaging over clinical parameters are significant for B-lines and GLS, not for EF
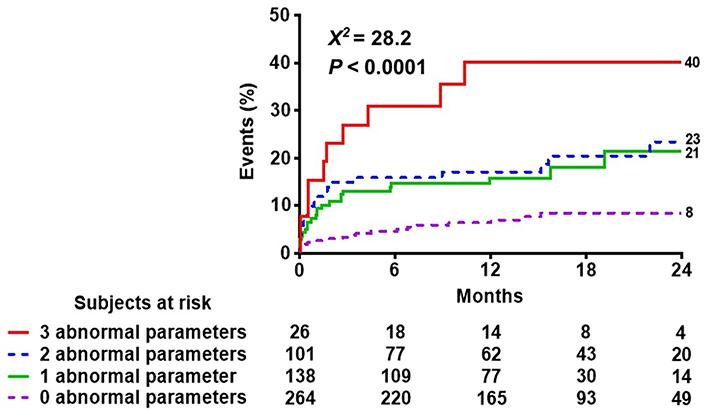
Reverse Kaplan-Meier curves show that higher scores are associated with worse event-free survival
The current study shows that EF, GLS, and B-lines can be performed in almost all consecutive patients referred to the echocardiography laboratory for CCS. The training, technology, and time required are minimal, resulting in a success rate highest for B-lines, and slightly but significantly lower for EF and GLS. The 3 parameters offer incremental and independent prognostic information since they focus on different pathophysiological variables and targets of disease: radial LV function for EF; longitudinal (subendocardial) function for GLS; pulmonary congestion (and diastolic dysfunction) for B-lines.
The prognostic value of resting EF, GLS, and B-lines has been abundantly shown, confirmed, and reconfirmed in the literature. The evidence base dates back to the last 50 years for EF [3, 4, 11–15], the last 20 years for GLS [9, 16–23], and mostly the last decade for B-lines [24–30]. Previous large multicenter trials reported a close relationship between declining of EF and poorer prognosis both in patients with ACS [13, 14] and CCS [15]. GLS was found to be a powerful prognostic indicator in various cardiac conditions adding prognostic information over EF assessment [16, 17]. In the Copenhagen City Heart Study on a general population followed for a median of 11 months, GLS independently predicted morbidity and mortality and provided incremental prognostic information over current risk stratification models [19]. On note, each 1% deterioration of GLS was associated with 12% increased risk of acute myocardial infarction or cardiovascular death [18]. In addition, GLS allowed effective prognostication in patients with heart failure [16], ACS [18, 20], normal EF [21], and permanent atrial fibrillation [22]. Finally, it was independently associated with mortality in a large cohort of patients with suspected CAD referred for stress echocardiography [23]. Several studies showed that B‐lines predict adverse survival both in patients with chronic [24] and acute heart failure [25–30], including those with preserved EF [29]. The presence of B-lines at hospital discharge implied a worse prognosis also in the absence of rales in the auscultation [28]. To date, no study has evaluated the three parameters simultaneously in the same cohort showing the additive and incremental value of each of the three parameters, with the latest (GLS and B-lines) even outperforming EF in these consecutive populations with mostly preserved EF.
The present study underlines the importance of identifying and quantifying the 3 parameters—EF, GLS, and B-lines—when performing an echocardiographic examination. This implies the use of technology present in most if not all, echocardiographic machines such as GLS. LUS employs the same technology and transducer as TTE and is simple to learn, to use, and to quantify. GLS is operator-independent and requires a better-quality image than EF, but once the learning curve has been completed it can be performed off-line with minimal time and limited training requirements. The most time-consuming and less feasible parameter is EF, readily available now in some commercially available instruments with artificial intelligence-based automated analysis. In this way, the standard TTE exam is simpler, objective, and more informative as a first-line imaging technique in all CCS patients.
The single-center, prospective, observational study design was limited by the relatively small sample size for a prognostic study, with the need to include soft and subjective endpoints such as myocardial revascularization in the data analysis. However, the homogeneous methodology was also a potential advantage, since the same machine was used for vendor-dependent assessment of GLS, and the same operator (CL) performed all examinations eliminating the confounder of inter-operator variability affecting EF assessment. In addition, some parameters of recognized prognostic value such as severe mitral regurgitation or pulmonary hypertension were not assessed, by the selection, and may further contribute to the risk stratification potential of TTE supplemented by TTE and LUS.
In conclusion, TTE, STE, and LUS at rest offer additive and complementary information for the prediction of survival in CCS. The 3 items are EF, GLS, and B-lines. GLS and B-lines are even more feasible to obtain and simpler to measure than time-honored EF. They can be obtained in almost all patients, also in a semiautomatic or fully automated fashion, and are simple to image, analyze, and use. A simple TTE + STE + LUS score ranges from 0 (all parameters normal) to 3 (all parameters abnormal) and identifies a spectrum of annual event rates from < 4% to > 20% with no risk, no harm, no advanced imaging, and can be used in principle in all patients, by all doctors, with all machines.
ACS: acute coronary syndrome
CCS: chronic coronary syndrome
CI: confidence Interval
EF: ejection fraction
GLS: global longitudinal strain
HR: hazard ratio
LUS: lung ultrasound
LV: left ventricular
LVEF: left ventricular ejection fraction
STE: strain echocardiography
TTE: transthoracic echocardiography
LC: Conceptualization, Data curation, Formal Analysis, Writing—original draft. MFO, MF and FB: Data curation, Formal Analysis, Writing—review & editing. All authors approved the submitted version of the manuscript.
The authors declare that they have no conflicts of interest.
The study complies with the Declaration of Helsinki and was approved by the institutional ethics committee (Azienda USL Toscana Nordovest, decreto N. 1954, June 19, 2018).
The informed consent to participate in the study was obtained from all participants.
The informed consent to publication was obtained from relevant participants.
The data that support the findings of this study are available from the corresponding author upon reasonable request.
Not applicable.
© The Author(s) 2023.
Copyright: © The Author(s) 2023. This is an Open Access article licensed under a Creative Commons Attribution 4.0 International License (https://creativecommons.org/licenses/by/4.0/), which permits unrestricted use, sharing, adaptation, distribution and reproduction in any medium or format, for any purpose, even commercially, as long as you give appropriate credit to the original author(s) and the source, provide a link to the Creative Commons license, and indicate if changes were made.

View: 4319
Download: 29
Times Cited: 0