Original Article

Affiliation:
1Cardiology Department, San Giovanni di Dio e Ruggi D’Aragona Hospital, 84131 Salerno, Italy
Email: costantinaprota@gmail.com
ORCID: https://orcid.org/0000-0003-0393-9876
Affiliation:
2Cardiology Department, San Luca Hospital, 55100 Lucca, Italy
ORCID: https://orcid.org/0000-0002-1804-4939
Affiliation:
3Cardiology Department, Fatebenefratelli Hospital, 82100 Benevento, Italy
Affiliation:
4Department of Internal Disease and Clinical Pharmacology, Bieganski Hospital, Medical University, 91347 Lodz, Poland
ORCID: https://orcid.org/0000-0002-7623-5389
Affiliation:
5Cardiology Department, Hospital Medical University, 91347 Lodz, Poland
ORCID: https://orcid.org/0000-0002-5850-8187
Affiliation:
6Department of Cardiology, Policlinico Hospital, 70120 Bari, Italy
ORCID: https://orcid.org/0000-0001-5864-2012
Affiliation:
7Department of Cardiology, Ospedale per gli Infermi, 48018 Faenza, Ravenna, Italy
ORCID: https://orcid.org/0000-0002-7689-1167
Affiliation:
8Department of Cardiology, San Giuseppe Moscati Hospital, 83100 Avellino, Italy
ORCID: https://orcid.org/0000-0002-1442-9604
Affiliation:
9Cardiology Department, Parma University Hospital, 43126 Parma, Italy
ORCID: https://orcid.org/0000-0002-2207-3388
Affiliation:
10Cardiology Department, Umberto I Hospital, 84014 Nocera Inferiore, Salerno, Italy
ORCID: https://orcid.org/0000-0002-9698-9145
Affiliation:
3Cardiology Department, Fatebenefratelli Hospital, 82100 Benevento, Italy
Affiliation:
2Cardiology Department, San Luca Hospital, 55100 Lucca, Italy
ORCID: https://orcid.org/0000-0002-9927-4639
Affiliation:
1Cardiology Department, San Giovanni di Dio e Ruggi D’Aragona Hospital, 84131 Salerno, Italy
ORCID: https://orcid.org/0000-0002-7796-6298
Affiliation:
3Cardiology Department, Fatebenefratelli Hospital, 82100 Benevento, Italy
Affiliation:
3Cardiology Department, Fatebenefratelli Hospital, 82100 Benevento, Italy
Email: qciampi@gmail.com
ORCID: https://orcid.org/0000-0003-4775-8380
Explor Cardiol. 2024;2:19–30 DOI: https://doi.org/10.37349/ec.2024.00018
Received: November 27, 2023 Accepted: January 18, 2024 Published: February 26, 2024
Academic Editor: Andrea Borghini, Institute of Clinical Physiology - National Research Council (IFC-CNR), Italy
Aim: Left atrial volume index (LAVI), left atrial reservoir function through left atrial reservoir strain (LASr), and B-lines in lung ultrasound serve as supplementary indicators of left ventricular filling pressures. This study analyzes the interrelation between LAVI, LASr, and B-lines in both resting and peak vasodilator stress.
Methods: Dipyridamole stress echocardiography (SE) was conducted on 252 individuals (180 males, 71%, age 65 years ± 10 years) with chronic coronary syndromes. LAVI was quantified using the biplane disk summation method; LASr was obtained using 2-dimensional speckle tracking echocardiography; B-lines were evaluated through a simplified 4-site scan in the third intercostal space during lung ultrasound.
Results: During SE, a reduction in LAVI (26 ml/m2 ± 14 ml/m2 vs. 24 ml/m2 ± 12 ml/m2, P < 0.001) and an increase in LASr from rest (33% ± 8% vs. 38% ± 10%, P < 0.001) were respectively observed from rest to stress. B-lines were increased significantly during SE, from 19 (7.5%) to 29 (11.5%), P < 0.001. A substantial, inverse linear correlation was identified between LAVI and LASr both at rest (r = –0.301, P < 0.001) and peak stress (r = –0.279, P < 0.001). At group analysis, peak B-lines showed a direct correlation with peak LAVI (r = 0.151, P = 0.017) and an inverse correlation with peak LASr (r = –0.234, P < 0.001). In individual assessments, 9.7% (20/207) of patients displayed stress B-lines with normal LAVI and preserved LASr, while 20% (9/45) exhibited stress B-lines with abnormalities in both LAVI and LASr.
Conclusions: Vasodilator SE with combined left atrial and volume assessment, related to pulmonary congestion, is feasible with a high success rate. Pulmonary congestion is more frequent with dilated left atrium with reduced atrial contractile reserve (ClinicalTrials.gov identifier: NCT030.49995; NCT050.81115).
Left atrium (LA) myopathy is a common structural and functional basis for atrial fibrillation (AF) [1], detectable in patients maintaining sinus rhythm (SR) using transthoracic echocardiography (TTE) through its anatomical and functional indicators: an elevated left atrial volume index (LAVI) and a diminished left atrial strain during the reservoir phase [left atrial reservoir strain (LASr)] [2, 3]. An increase in LAVI and a decrease in LASr are linked with previous episodes of paroxysmal AF in SR patients and can be predictive of potential AF development in individuals without any arrhythmic history [4–6]. This information is crucial clinically, as precise treatments with oral anticoagulants can prevent AF complications such as acute cardiac failure and cerebrovascular accidents [5]. Occasionally, LAVI enlargement and LASr diminution are not present at rest but emerge only during stress [7–9]. Yet, to date, there is a notable absence of data regarding the response of LAVI and LASr under vasodilator stress echocardiography (SE), which is recommended by current cardiology guidelines for chronic coronary syndromes (CCS) primarily to diagnose coronary artery disease through regional wall motion abnormality (RWMA) and evaluation of coronary flow velocity reserve (CFVR) in patients with angiographically unremarkable coronary arteries [10, 11]. The central hypothesis of this study is that vasodilator stress could reveal hidden LA myopathy through LAVI dilation and LASr reduction during stress, frequently accompanied in lung ultrasound (LUS) by the new emergence or exacerbation of B-lines, indicative of elevated pulmonary capillary wedge pressure and pulmonary congestion [12]. In this hypothesis-driven research, we examined the behavior of LAVI, LASr, and B-lines in 252 consecutive patients undergoing dipyridamole SE for CCS diagnosis and risk stratification.
The study initially involved 266 patients, prospectively registered between March 16, 2016, and March 16, 2023 [13]. The primary reason for selecting dipyridamole SE was to determine inducible ischemia in individuals with CCS. Exclusions were based on inadequate acoustic windows at rest, significant valvular or congenital cardiac anomalies, and severe non-cardiac conditions leading to a poor prognosis (like advanced cancer, terminal renal failure, or serious obstructive pulmonary issues). Each participant underwent TTE and SE, focusing on measurements of LAVI and LASr. From the initial pool, 4 (1.5%) were excluded from analysis for inadequate imaging of LAVI or missing LAVI data during stress, and 8 (3.0%) for inadequate imaging missing of LASr, leaving 252 participants (180 males, 71%; mean age 65 years ± 10 years) for the study. The protocol received approval from institutional ethics committees as part of the more comprehensive SE 2020 study (148-Comitato Etico Lazio-1, July 16, 2016; ClinicalTrials.gov identifier: NCT030.49995) and SE 2030 study (291/294/295 Comitato Etico Lazio-1, March 8, 2021; ClinicalTrials.gov identifier: NCT050.81115) [13, 14].
TTE was conducted with standard ultrasound equipment (Philips Epiq CVx), including comprehensive rest assessments and ejection fraction (EF) evaluations, executed by accredited cardiologists in line with the American Society of Echocardiography and the European Association of Cardiovascular Imaging guidelines [15].
All subjects underwent dipyridamole SE (0.84 mg/kg in 6 min). SE followed existing protocols [16, 17], evaluating the wall motion score index (WMSI) at baseline and peak stress, in a four-point score ranging from 1 (normal) to 4 (dyskinetic) in a 17-segment model of the left ventricular (LV) [18]. LUS was utilized to identify B-lines, as vertical lines departing from the pleural line and synchronous with respiration; in a simplified 4-site scan, each space scored from 0 (normal horizontal A-lines) to 10 (white lung), with a cumulative score per patient from 0 (normal) to 40 (severely abnormal), was used [19]. All readers underwent quality control as already described [20].
LAVI measurements were derived from apical 4- and 2-chamber views, with software-assisted planimetry (QLab Philips) and indexing to body surface area [15]. Care was exercised to exclude the LA appendage and pulmonary vein ostia during endocardial tracing. Low intra- and inter-observer variability for LAVI and LASr had been already confirmed among SE 2030 network readers [7, 9].
LASr was measured using speckle tracking echocardiography (STE) with frame rates between 40/s to 80/s, analyzing either from a 4-chamber view (average value from 6 LA segments) or a combined 4- and 2-chamber view (average value from 6 LA segments), as recommended by current guidelines [21, 22]. Offline analysis used the QRS point as a reference and a region of interest (ROI) of 3 mm, with measurements averaged over three cardiac cycles; LASr was estimated as the peak positive strain value corresponding to the period between the rand the T wave on the ECG and expressed in percentage values [21]. Abnormal values were set at ≥ 34 ml/m2 for LAVI and ≤ 24% for LASr [23].
Data presentation varied as mean ± SD, number (N, percentage), or median [interquartile range (IQR)], as suited. Normal distribution of all continuous variables, was tested using the one sample Kolmogorov-Smirnov test. Logarithm (Log) transformation was performed on LAVI at rest (P < 0.001) and at peak stress (P < 0.001) values because of nonlinear distribution.
Group differences were evaluated using the Student’s t-test for normally distributed continuous variables, the Mann-Whitney U test for skewed continuous variables, and the chi-square (χ²) or Fisher exact tests for categorical variables. Pearson’s correlation coefficient was used to examine relationships between continuous variables.
Independent predictors of LAVI dilatation at peak stress and reduced LASr at peak stress were assessed by means of multiple linear regression analysis. Statistical significance was set at P < 0.05. All statistical calculations were performed using SPSS for Windows, release 20.0 (Chicago, Illinois).
Key clinical and echocardiographic traits of the patients are outlined in Table 1. Notably, 46.8% had a history of myocardial infarction, and 43.3% underwent coronary revascularization. High success rates were noted for LAVI and LASr measurements at rest and peak stress. We excluded only 13 patients (4.5%) from initial study population for inadequate imaging of LAVI or LASr, without additional imaging (LA acquired during the 4-2 chambers view) and limited analysis time: LAVI in 4-2 chambers view: 30 s at rest and 30 s at peak stress; LASr in 4-2 chambers view: 45 s at rest and 45 s at peak stress.
Clinical and echocardiographic characteristics of the patients
| Clincal and echocardiographic characteristics | Mean ± SD or N (%) or median (IQR) |
|---|---|
| Age (years) | 65.4 ± 10.2 |
| Sex, N (%) | |
| Male | 180 (71.7%) |
| Female | 72 (28.6%) |
| Body surface area (m2) | 1.94 |
| Hypertension, N (%) | 218 (86.5%) |
| Diabetes, N (%) | 53 (21.1%) |
| B-blockers, N (%) | 172 (68.3%) |
| Ace-inhibitors/Sartans, N (%) | 201 (79.8%) |
| History of myocardial infarction, N (%) | 118 (46.8%) |
| Previous PCI/CABG, N (%) | 109 (43.3%) |
| B-lines at rest, median (IQR) | 0.4 (0–30) |
| B-lines at rest (≥ 2), N (%) | 19 (7.5%) |
| B-lines at peak, median (IQR) | 0.7 (0–30) |
| B-lines at peak (≥ 2), N (%) | 29 (11.5%) |
| LAVI at rest (ml/m2) | 26.5 ± 12.5 |
| LAVI at rest ≥ 34 ml/m2, N (%) | 39 (15.5%) |
| LAVI at peak (ml/m2) | 24.2 ± 12.1 |
| LAVI at peak ≥ 34 ml/m2, N (%) | 33 (13.1%) |
| LASr at rest (%) | 33.0 ± 8.2 |
| LASr at rest ≤ 24%, N (%) | 37 (14.7%) |
| LASr at peak (%) | 38.0 ± 10.1 |
| LASr at peak ≤ 24%, N (%) | 23 (14.7%) |
| Ejection fraction at rest (%) | 59.3 ± 7.2 |
| Ejection fraction at peak (%) | 73.0 ± 7.8 |
PCI: percutaneous coronary intervention; CABG: coronary artery bypass graft
During the dipyridamole SE, a notable reduction in LAVI was observed (baseline = 26 ml/m2 ± 14 ml/m2 vs. during stress = 24 ml/m2 ± 12 ml/m2, P < 0.001). Enlarged LAVI (≥ 34 ml/m2) was found in 15.5% (39 patients) at rest and in 13.1% (33 patients) at peak SE. A detailed patient-by-patient analysis showed that in 92.8% of patients LAVI remained stable, in 4.8% it showed improvement, and in 2.4% there was a worsening (Figure 1).
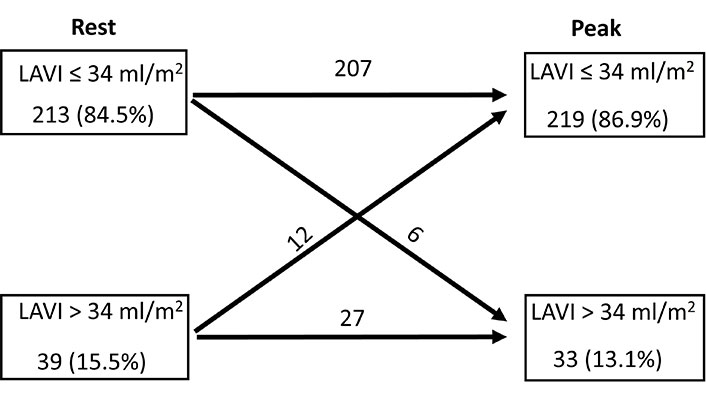
Normal (≤ 34 ml/m2) and dilated LAVI (> 34 ml/m2) at rest and at peak stress, with individual analysis of LAVI rest-stress change for each group
Conversely, LASr demonstrated an increase during the SE (baseline = 33% ± 8% vs. stress = 38% ± 10%, P < 0.001). A diminished LASr (≤ 24%) was seen in 14.7% (37 patients) at rest and in 9.1% (23 patients) at peak SE. In individual patient evaluations, LASr remained unchanged in 87.3%, improved in 9.1%, and deteriorated in 3.6% of the patients (Figure 2). The incidence of B-lines significantly escalated during SE [from 19 (7.5%) at rest to 29 (11.5%) at peak stress, P < 0.001].
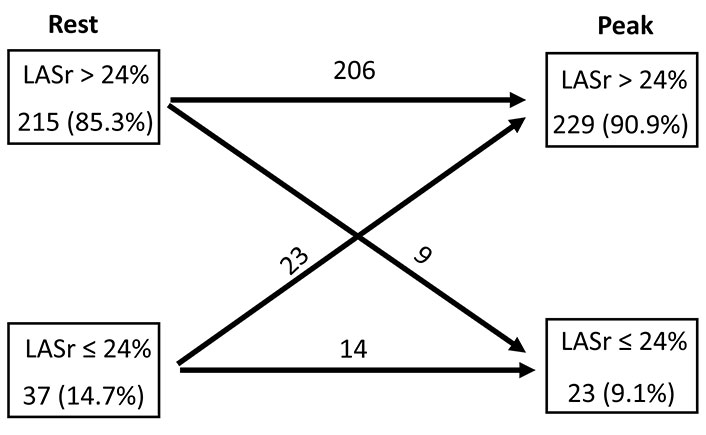
Normal (> 24%) and reduced LASr (≤ 24%) at rest and at peak stress, with individual analysis of LASr rest-stress change for each group
The correlation analysis revealed that LASr at both rest and peak stress inversely correlated with age, WMSI at rest and peak stress, and directly correlated with EF at both stages (Table 2).
Linear correlation analysis between LASr at rest and at peak stress
| Clinical an echocardiographic characteristics | LASr at rest | LASr at peak |
|---|---|---|
| Age | r = –0.225 P < 0.001 | r = –0.327 P < 0.001 |
| NYHA functional class | r = –0.159 P = 0.012 | r = –0.263 P < 0.001 |
| Log LAVI at rest | r = –0.304 P < 0.001 | r = –0.225 P < 0.001 |
| EF at rest | r = 0.178 P = 0.004 | r = 0.211 P < 0.001 |
| WMSI at rest | r = –0.272 P < 0.001 | r = –0.295 P < 0.001 |
| MR at rest | r = –0.264 P < 0.001 | r = –0.416 P < 0.001 |
| Log LAVI at peak | r = –0.289 P < 0.001 | r = –0.304 P < 0.001 |
| EF at peak | r = 0.262 P < 0.001 | r = 0.388 P < 0.001 |
| WMSI at peak | r = –0.222 P = 0.001 | r = –0.298 P < 0.001 |
| Blines at peak | r = –0.124 P = 0.044 | r = –0.234 P < 0.001 |
NYHA: New York Heart Association; MR: mitral regurgitation
Our study identified a direct association between the NYHA functional class and the Log LAVI at rest (r = 0.127, P = 0.044) and during peak stress (r = 0.170, P = 0.007). Conversely, an inverse relationship was observed between the NYHA functional class and LASr both at rest and peak stress (Table 2).
There was a noteworthy inverse linear correlation identified between Log LAVI and LASr, both under resting conditions (r = –0.304, P < 0.001) and during peak stress (r = –0.289, P < 0.001). At group analysis, the occurrence of peak B-lines showed a direct correlation with the peak Log LAVI (r = 0.146, P = 0.020) and an inverse one with peak LASr (r = –0.234, P < 0.001). A detailed patient-specific analysis revealed that 9.7% (20 out of 207) displayed stress B-lines with a normal LAVI and maintained LASr, while 20% (9 out of 45) exhibited stress B-lines alongside abnormalities in both LAVI and LASr (Figure 3).
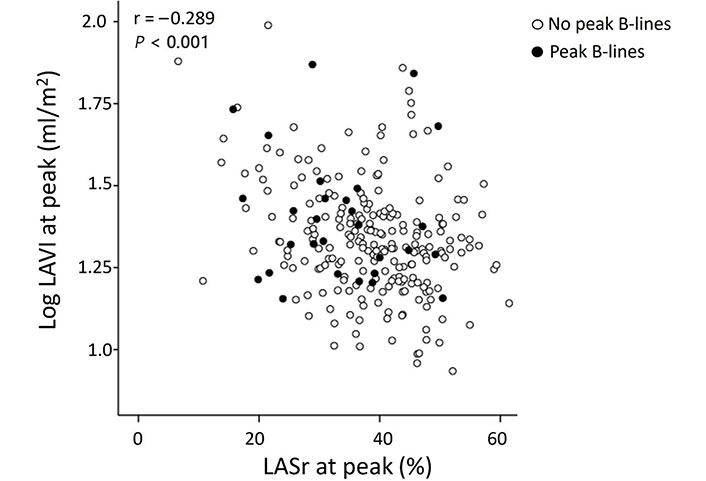
Peak stress Log LAVI vs. LASr at peak stress in patients with (full dots) and without (empty dots) B-lines
Key independent predictors of LAVI dilation at its peak were identified as mitral regurgitation at rest and the peak EF (Table 3). Similarly, independent predictors for peak LASr dilation included mitral regurgitation at rest and EF during peak stress (Table 4).
Predictors of LAVI dilatation at peak stress
| Variables | Univariable logistic regression analysis | Multivariable logistic regression analysis | ||
|---|---|---|---|---|
| HR (95% CI) | P | HR (95% CI) | P | |
| Age (years) | 1.081 (1.036–1.128) | < 0.001 | - | - |
| Sex (male) | 0.638 (0.264–1.543) | 0.319 | - | - |
| Hypertension | 1.649 (0.474–5.733) | 0.432 | - | - |
| Diabetes | 2.095 (0.943–4.655) | 0.069 | - | - |
| History of myocardial infarction | 1.241 (0.597–2.582) | 0.583 | - | - |
| Beta-blockers therapy | 3.853 (1.306–11.366) | 0.015 | - | - |
| Diuretics therapy | 2.818 (1.250–6.354) | 0.012 | - | - |
| Ace-inhibitors/Sartans therapy | 1.489 (0.545–4.070) | 0.438 | - | - |
| Mitral regurgitation at rest | 31.883 (8.912–113.703) | < 0.001 | 4.696 (1.188–18.571) | 0.027 |
| Ejection fraction at rest | 0.949 (0.907–0.992) | 0.021 | - | - |
| Ejection fraction at peak | 0.964 (0.937–0.993) | 0.015 | 0.910 (0.849–0.974) | 0.007 |
| Heart rate at rest | 0.975 (0.939–1.011) | 0.172 | - | - |
| Heart rate at peak | 0.964 (0.937–0.993) | 0.015 | - | - |
| Systolic blood pressure at rest | 1.018 (0.996–1.041) | 0.319 | - | - |
| Systolic blood pressure at peak | 1.004 (0.984–1.024) | 0.697 | - | - |
HR: hazard ratio; CI: confidence interval; -: no data
Predictors of reduced LASr at peak stress
| Variables | Univariable logistic regression analysis | Multivariable logistic regression analysis | ||
|---|---|---|---|---|
| HR (95% CI) | P | HR (95% CI) | P | |
| Age (years) | 1.062 (1.013–1.113) | 0.012 | - | - |
| Sex (male) | 0.483 (0.201–1.157) | 0.102 | - | - |
| Hypertension | 3.704 (0.463–28.420) | 0.208 | - | - |
| Diabetes | 2.169 (0.866–5.431) | 0.098 | - | - |
| History of myocardial infarction | 1.535 (0.647–3.644) | 0.331 | - | - |
| Beta-blockers therapy | 3.377 (0.973–11.718) | 0.055 | - | - |
| Diuretics therapy | 3.563(1.432–8.865) | 0.006 | - | - |
| Ace-inhibitors/Sartans therapy | 6.145 (0.808–46.175) | 0.079 | - | - |
| Mitral regurgitation at rest | 12.733 (3.944–41.112) | < 0.001 | 5.787 (1.371-24.423) | 0.017 |
| Ejection fraction at rest | 0.944 (0.899–0.991) | 0.020 | - | - |
| Ejection fraction at peak | 0.895 (0.851–0.941) | < 0.001 | 0.942 (0.754-0.940) | 0.002 |
| Heart rate at rest | 1.026 (0.994–1.059) | 0.118 | - | - |
| Heart rate at peak | 0.990 (0.960–1.021) | 0.524 | - | - |
| Systolic blood pressure at rest | 1.026 (1.000–1.053) | 0.049 | - | - |
| Systolic blood pressure at peak | 1.005 (0.982–1.029) | 0.645 | - | - |
-: no data
In Figure 4 and Figure 5, examples of LAVI and LASr improved and worsened respectively, during dipyridamole SE, associated to B-lines evaluation were showed.
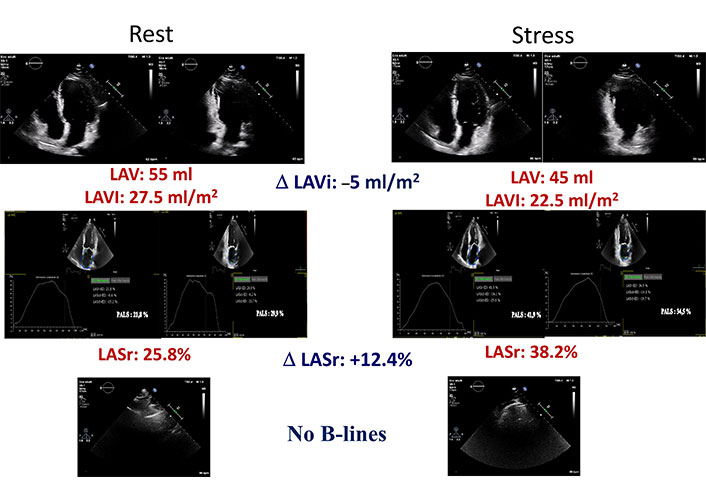
A normal LAVI and LASr stress echo. Left column: rest images; right column: stress images. From top to bottom: LAVI in 4 and 2 chambers with mean value and stress-rest change (Delta LAVI); LASr in 4 and 2 chambers with mean value and stress-rest change (Delta LASr); normal LUS without B-lines
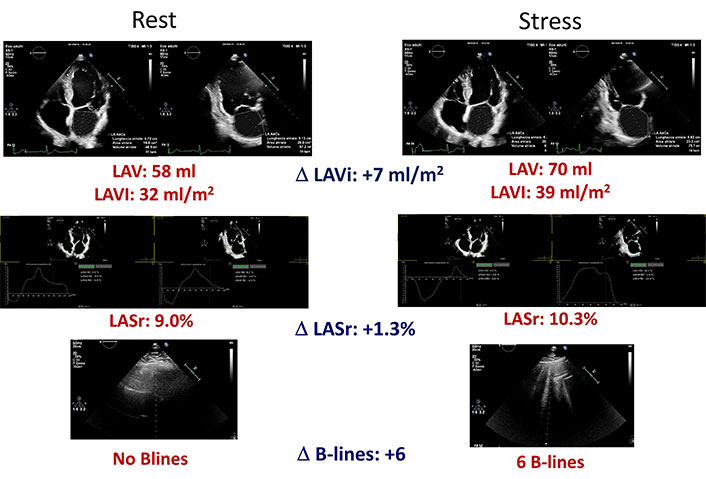
An abnormal LAVI and LASr stress echo. Left column: rest images; right column: stress images. From top to bottom: LAVI in 4 and 2 chambers with mean value and stress-rest change (Delta LAVI); LASr in 4 and 2 chambers with mean value and stress-rest change (Delta LASr); normal LUS without B-lines at rest (left) and presence of B-lines at peak stress (right)
In our investigation, we evaluated LA responses during dipyridamole SE, focusing on LAVI and left atrial strain of the reservoir phase (LASr) in patients with CCS. Key discoveries include: (1) high feasibility and success rate of LA SE during dipyridamole stress, integrating LAVI and LASr assessment without interference with standard evaluations of RWMA and CFVR; (2) a common and likely normal response pattern in dipyridamole LA SE is LAVI reduction paired with LASr enhancement, despite considerable individual variability; (3) an infrequent, potentially abnormal LA response pattern involves increased LAVI, decreased LASr, often coupled with emerging or intensifying B-lines, indicative of acute pulmonary congestion. These insights carry significant pathophysiological and clinical implications.
The normal response of the LV to vasodilator stress is a reduction of LV filling pressures, an increase of LV contractility (around 10% from baseline) and unchanged pulmonary artery wedge pressure. In case of inducible ischemia or LV diastolic dysfunction with normal coronary arteries, the pulmonary wedge pressure and LV filling pressures increase [24, 25]. A similar pattern was found in the LA, with the most frequent pattern characterized by a 10% increase in LASr and a mild decrease or no change in LAVI, whereas the abnormal pattern is characterized by the development of LAVI dilation, reduction of LASr, and more B-lines. The functional unit LV-LA-lung alveolar-capillary barrier is tightly interconnected and ideally suited for a comprehensive assessment with SE, especially with dipyridamole stress which minimally degrades the image quality, only mildly although significantly increases the heart rate, and is an effective ischemic and, independently of ischemia, diastolic stress, probably for a direct, flow-independent effect of adenosine on cellular calcium fluxes [26], since dipyridamole acts through an accumulation of endogenous adenosine. Elevations of intracellular adenosine in specific types of cardiac disease, including those where myocardial energy reserve is limited, contribute to diastolic dysfunction by recruiting cross-bridges, and thereby increase myocardial stiffness [27].
The findings of the present paper are in agreement with previous studies showing the feasibility of LAVI and LASr assessment during SE performed with exercise or pharmacological stress [7–9]. The technical success rate can be even higher with dipyridamole stress, technically easier than exercise or dobutamine. This is especially important for LASr, since SR requires an adequate frame rate and the possibility of artifacts and inadequate signal-to-noise ratio increases with high heart rate. However, we limited our LA STE to LASr, by far the easiest to measure and the most reproducible of atrial strain parameters, which also include conduit strain and contraction strain [28].
Step L of LA can be easily included in the comprehensive assessment of SE, with a simultaneous assessment of LA volume (with LAVI) and function (with LASr). There is a normal LA pattern, with unchanged-reduced LAVI and increased LASr, and a less frequent abnormal pattern, with marked LAVI dilation and decrease of LASr. These findings suggest that a simple SE can identify an incipient LA myopathy, more vulnerable to develop AF. These initial, observational studies are hypothesis-generating and should be now corroborated by future prospective studies evaluating whether the abnormal LA SE response is associated with greater chances to develop AF in the follow-up.
The study design was observational and the data analysis retrospective, although the data collection was prospective. Not all patients had all parameters, since the SE protocol rapidly evolved in recent years and the standard assessment of LAVI was only later enriched with the evaluation of LASr. The study design did not include a core lab assessment, but a preliminary quality control of one reader from each center, also to ensure the generalizability of the findings in the real world, as required by an effectiveness study [29].
In conclusion, vasodilator SE with combined assessment of LA volume and function, with pulmonary congestion with LUS, is feasible with a high success rate in patients with CCS. Pulmonary congestion is more frequent with a dilated LA with reduced atrial contractile reserve, but it may occur in a minority of patients with normal LAVI and normal LASr. Whether this pattern predicts the future occurrence of AF in patients in SR remains to be assessed in prospective, longitudinal, large-scale studies.
AF: atrial fibrillation
CCS: chronic coronary syndromes
EF: ejection fraction
IQR: interquartile range
LA: left atrium
LASr: left atrial reservoir strain
LAVI: left atrial volume index
Log: Logarithm
LUS: lung ultrasound
LV: left ventricular
NYHA: New York Heart Association
SE: stress echocardiography
SR: sinus rhythm
TTE: transthoracic echocardiography
WMSI: wall motion score index
CP: Writing—original draft. LC: Conceptualization, Data curation. E Campagnano and E Cerracchio: Investigation. KWD, JK, PC, EM, FM, NG, AD, LM, and RC: Investigation, Resources. BV: Investigation, Resources, Supervision. QC: Writing—original draft, Conceptualization, Supervision.
The authors declare that they have no conflicts of interest.
The research complies with the Declaration of Helsinki and the study protocol were reviewed and approved by the institutional ethics committees.
Informed consent to participate in the study was obtained from all participants.
Not applicable.
The raw data supporting the conclusions of this manuscript will be made available by the authors, without undue reservation, to any qualified researcher (Quirino Ciampi, qciampi@gmail.com; Costantina Prota, costantinaprota@gmail.com).
Not applicable.
© The Author(s) 2024.
Copyright: © The Author(s) 2024. This is an Open Access article licensed under a Creative Commons Attribution 4.0 International License (https://creativecommons.org/licenses/by/4.0/), which permits unrestricted use, sharing, adaptation, distribution and reproduction in any medium or format, for any purpose, even commercially, as long as you give appropriate credit to the original author(s) and the source, provide a link to the Creative Commons license, and indicate if changes were made.