 Review

Affiliation:
1Physics Faculty, Taras Shevchenko National University of Kyiv, 01601 Kyiv, Ukraine
ORCID: https://orcid.org/0000-0001-6793-7947
Affiliation:
1Physics Faculty, Taras Shevchenko National University of Kyiv, 01601 Kyiv, Ukraine
2Education and Research Institute of Energetics, Automation and Energy Efficiency, National University of Life and Environmental Sciences of Ukraine, 01601 Kyiv, Ukraine
ORCID: https://orcid.org/0000-0003-3727-5617
Affiliation:
1Physics Faculty, Taras Shevchenko National University of Kyiv, 01601 Kyiv, Ukraine
Email: SGNedilko@gmail.com
ORCID: https://orcid.org/0000-0001-5196-6807
Explor BioMat-X. 2025;2:101353 DOI: https://doi.org/10.37349/ebmx.2025.101353
Received: May 22, 2025 Accepted: December 03, 2025 Published: December 22, 2025
Academic Editor: Esmaiel Jabbari, University of South Carolina, USA
The article belongs to the special issue Nature-Based Biomaterials for Biomedical Applications
Luminescent markers have been widely used in medicine, biology, agrotechnology, and for marking nuclear wastes and consumer goods. The high sensitivity and selectivity of the markers/labels allow the detection of various substances and the obtaining of valuable information about the distribution of constituents in specific media. This review describes the state of the art in luminescent marking/labeling of various cellulose forms, including nanosized ones, cellulose derivatives, and cellulose-containing materials. The importance of this consideration is explained by the role of cellulose and its derivatives in human life and their overall impact on mankind’s development. The structure and luminescence properties of cellulose and other related materials and cellulose derivatives are discussed from the viewpoint of cellulose luminescent “self-labeling”. It is shown that dyes, organic molecules, and organic-inorganic complexes, as well as inorganic dielectric and semiconductor micro/nanoparticles, can be effectively applied for the purposes of cellulose luminescent marking/labeling. This review discusses various application examples and explains the performance and mechanisms of various systems labeling (e.g., dye-cellulose, quantum dot-cellulose complex) in these applications. The review not only comprehensively summarizes existing approaches to luminescent labeling of cellulose-containing materials. It also highlights problematic issues that arise for developers of new luminescent markers (quenching of luminescence in an aqueous environment, the need to functionalize the luminescent marker material, etc.). At the same time, this work demonstrates the prospects for luminescent labeling data in modern digital technologies, particularly in the Internet of Things (IoT).
There is no doubt that the luminescent labeling method has become a much more powerful scientific tool than it was conceived. In fact, among the analytical detection methods, the luminescence ones are characterized by high sensitivity and selectivity. These peculiarities allow the detection of various substances and the obtaining of valuable information about luminescent particles’ distribution in specific media.
Labeling is a part of our everyday life as we mark some things by drawing, sticking, sewing, scratching, etc. A bright label, particularly one seen at low-intensity lighting, can be made using luminescent stickers or inks. Such luminescent labeling has been widely used, e.g., for marking the boxes during transportation. Similar methods have been applied in science and high technologies. However, the materials and tools for luminescent labels are quite specific. In such a case, the luminescent atoms, molecules, or ions play the role of labels and should be “glued”/introduced to the substance that is labeled. The micro/nanoparticles of the luminescent compound incorporated into the structure of another compound (matrix) can also be used as labels. Such a label manifests itself, if needed, under action on the marked substance of energy flow (excitation), e.g., ionizing radiation (gamma and X-ray quanta) or light from vacuum ultraviolet up to visible and infrared spectral regions. The label under excitation can reveal light emission at longer wavelengths (compared with excitation wavelength)—fluorescence, and, in some specific cases, long-lasting luminescence (phosphorescence) can also be detected. Such luminescent marking allows the creation of a map of the sample, or the marked area can be seen even with the naked eye when labels emit light in the visible spectral region. Nowadays, such visualization is a powerful tool in biological and medical studies.
Spectrum (band shapes and positions, intensity), quantum yield, and kinetics (changes in intensity over time after excitation pulse) are the main characteristics of the luminescence. These characteristics of luminescent labels have no interest for the average user; however, they are crucial for scientific studies and high-tech applications. The development of modern microscopy and optical technologies significantly widens the area of luminescent labels’ usage in medicine, biology, agrotechnology, for marking nuclear wastes, consumer goods, etc. Thus, it is unsurprising that numerous studies in the abovementioned branches of science were performed, and the results have been published in original and review papers [1–10]. The various compounds and their combinations/composites were used as luminescent labels in the abovementioned studies. Concerning the objects for labeling, it is worth mentioning the DNA [4–6, 9, 11], proteins/enzymes [12–14], blood [15], media with heavy metal ions [16], nucleic acids [16–20], etc.
In this review paper, we focus attention on the luminescent labeling/marking of various forms of cellulose, namely, microfibrillated (MFC), microcrystalline (MCC), nanocrystalline/nanosized (NC), bacterial cellulose (BC), as well as cellulose derivatives and cellulose-based materials/composites. The relevance of this consideration is due to the role of cellulose and its derivatives in the everyday life of every human and overall impact on mankind’s development [21–31]. It is worth noting that there are numerous cellulose derivatives and cellulose-based materials. All of them have specific composition, structure, and properties (chemical, physical, biochemical, etc.). Therefore, the development of suitable luminescent markers for such diversity of cellulose forms and derivatives attracted significant attention from scientists for a long time. Thus, we describe the most widely used luminescent labels at the beginning of the present review.
Some important data on the chemical composition and structure of cellulose chains and molecules, as well as micro-/nanosized forms of cellulose, such as MFC, MCC, NC, and BC, will be described in the second part (Cellulose forms and structures) of this work. The methods and procedures for obtaining the abovementioned cellulose forms and cellulose-containing composites will also be briefly described.
It is worth noting that cellulose, its derivatives, and cellulose-containing materials are active in luminescence—they reveal so-called “own” (intrinsic) luminescence. This luminescence can suppress/mask the label function through the overlapping of luminescence characteristics of cellulose-containing material with those related to a label. At the same time, the own luminescence of the cellulose can also be used for luminescent marking/labeling (e.g., reported in [32]). So, the application of cellulose’s intrinsic luminescence for various purposes would be described in the third part (Self-labeling of luminescent cellulose materials) of this work.
Some interesting cases of luminescent materials application for labeling and visualization of cellulose-related materials are described in the final fourth part (Luminescent markers for cellulosic materials) of the paper.
Luminescent markers and labels can be used in various commercial applications such as anti-counterfeiting, bioaffinity assays, bio-imaging [33], pharmaceutical [34], food packaging [35], etc. Nowadays, agriculture, in particular farming, is increasingly transforming from traditional to precise. Precise agriculture requires continuous real-time data collection, plant condition monitoring, etc. Consequently, the elaboration of an intelligent labeling system that would allow continuous monitoring of plant condition and, at the same time, be reliable, simple, and allow digitization of sensor data is an urgent task. The light signal from a luminescent label applied to a plant can precisely satisfy these conditions [36].
At present, a large number of different markers for various applications already exist and continue to be developed. The specific type of markers is determined by the object of marking, the nature of its binding to the marker, and the possible influence of the object on the luminescent characteristics of the marker. In particular, the most commonly used luminescent markers for bio-medical applications are molecular systems with a defined structure, such as fluorescent proteins, organic dyes, metal-ligand complexes like lanthanide chelates, semiconductor, carbon, or silicon quantum dots, fluorophore-tagged latex/silica nanobeads, self-luminescent organic or lanthanide-doped inorganic nanoparticles, etc. [4, 12, 37–53].
It is worth noting that small-molecule fluorescent probes are the main instruments used for fluorescent imaging. This method has become an indispensable technique for the real-time detection and imaging in various biological systems [12]. However, there are several important drawbacks inherent to organic fluorophores that affect the sensitivity of the method. In particular, sudden decomposition of the molecule leads to photobleaching. The organic fluorophores often suffer from low signal intensities and random on/off light emission (blinking). At the same time, organic-inorganic compounds based on the metal-ligand complexes of transition metals (MC) demonstrate more attractive properties from the viewpoint of their usage as luminescent labels [54–57].
Organic dyes are among the earliest types of classical fluorescent labels used in biology. Despite their inherent drawbacks, such as small Stokes shift, poor photochemical stability, susceptibility to photobleaching, and decomposition under repeated excitation, organic dyes are still popular due to their low cost, availability, and simplicity of their application. Moreover, the new organic dyes with improved chemical stability and optical properties have been produced. It is worth noting also that intermittent on/off emission of the organic dyes is not always a drawback, but can be used as a sensitive method for the detection of single molecules. As the most commonly used dyes, the fluorescein, rhodamine, cyanine, and Alexa dyes should be mentioned [38].
Fluoresceins are used for protein labeling as this type of dye is an amine-reactive organic fluorophore. The fluorescein-5-isothiocyanate (FITC) of chemical formula C21H11NO5S is among the most popular fluorescein dyes available for this purpose. This dye is typically characterized by good solubility in water, UV and visible light absorption, high luminescence quantum yield, etc. [58]. Among the most significant drawbacks of the FITC are its sensitivity to the pH level of the solution and the photobleaching problem. The latter results in a significant decrease in the FITC luminescence intensity just after a few minutes under constant illumination [38]. Nevertheless, fluorescein dyes are widely used as tracers in analytical chemistry, forensics, and biomedical analysis [59–62]. Moreover, the close location of the excitation band maxima of FITC (λmax = 494 nm) to the emission line of argon-ion laser (λem = 488 nm) makes this dye the main fluorophore for application in flow cytometry and confocal laser-scanning microscopy [38].
Rhodamine dyes are another common type of dye that have been widely used for the labelling of biomolecules [63–65]. Rhodamine dyes with red fluorescence, e.g., 5-carboxyrhodamine 6G succinimidyl ester with molecular formula C31H29N3O7 [66], exhibit better photostability as well as emission maxima at longer wavelengths than FITC mentioned above [38]. Good matching of the fluorescence excitation peak of C31H29N3O7 (λmax = 520 nm) with a spectral line of argon-ion laser (λem = 514 nm) makes this dye another important fluorophore for laser-scanning microscopy and flow cytometry [38].
Cyanine dyes have been known for a long time as fluorophores for laser applications. This large class of organic compounds can be divided into two subclasses: 1) monomethine cyanine with the asymmetric cyanines—thiazole orange (TO), oxazole yellow (YO), or a dimer of both TO and YO (TOTO, YOYO)—as the most known representatives; 2) polymethine cyanines, to which widely used cyanin 3 (Cy3) and cyanin 5 (Cy5) are belong [38]. Due to their good water solubility, high photostability, good optical and luminescence properties, particularly, relatively high quantum yield, the cyanine dyes have been considered as prospective biological labels/markers [67]. Alexa dyes can be obtained as a result of sulfonation of the abovementioned classes of dyes, namely, rhodamine, aminocoumarin, or carbocyanine ones [68, 69]. The Alexa dyes demonstrate an outstanding performance as labels in biomedical applications, compared to other dyes [68–70]. The peculiar characteristic of the Alexa dyes’ fluorescence is that their emission and excitation bands cover a wide spectral range, spreading from ultraviolet to red light. So, it is easy to match the excitation band of the dye with the emission line of an available light source. It is worth noting that the negative net charge of Alexa dyes sometimes leads to a nonspecific electrostatic interaction with positively charged cell structures [71]. In such cases, it is better to use rhodamine dyes, which are neutral, for labeling despite their worse luminescence yield compared to Alexa dyes [38].
Fluorescent protein family with green fluorescent protein (GFP), its famous member, is another class of organic compounds suitable for luminescent labeling. In contrast to other organic compounds, namely bioluminescent ones, the GFP doesn’t require external proteins, substrates, or any cofactors for emitting light after photo-excitation. It is known that light absorption and emission in GFP are related to the chromophore that is p-hydroxybenzylidene-imidazolidinone. This chromophore originates from cyclized and oxidized Ser–Tyr–Gly own sequence of the protein at positions 65–67 [72, 73]. Currently, there are seven classes of GFP fluorophores, each one with specific components in their constituent chromophores [38, 74].
GFPs have been used as tools in numerous applications, including as biological labels to track and quantify individual or multiple protein species, as probes to monitor protein–protein interactions, and as biosensors to describe biological events and signals [38]. In particular, GFP fluorescence can be modulated post-translationally by its chemical environment and protein–protein interactions [74], facilitating the in vivo detection of gene expression [75, 76]. GFPs can be fused as luminescent labels to any kind of protein by means of genetic engineering. Importantly, during such manipulation, the target protein does not alter its functions, which allows the analysis of the protein distribution, motion, and interaction with living cells [77]. However, aggregation of fluorescent proteins in the living cell may lead to cellular toxicity, so this issue should be taken into account [78]. Another problem in the application of single proteins for fluorescent labeling is related to a possible large-time blinking (turn on/off on timescale of seconds), which is a challenge for the detection of single molecules [79, 80].
Transition metal clusters compounds of the general formula An[M6Qi8L6a] (A = alkali; M = metal atom; Qi = inner ligand, halogen or chalcogen; La = apical ligand, halogen, organic ligands) with octahedral structure belong to an actively elaborate class of luminescent additives (Figure 1). In particular, Costuas et al. [81] and Dierre et al. [82] reported that molybdenum-containing MC shows high intensity of photoluminescence (PL) in the NIR range of light. The luminescence quantum yield of MC can be from a few to nearly 100%, which depends on the types of Qi and La ligands [83, 84].

Structure of cellulose acetate phthalate (a) and the Mo6 metal nanocluster anion (b). The asterisk represents the linking point of the R group. Reprinted from [55]. © 2023 by the authors. Distributed under a CC BY 4.0.
The MC of the abovementioned type can be used in liquid crystals or various polymers as anti-counterfeiting materials [85], solar concentrators [86], wave-guiding, inkjet printing, and materials for lightning [87–90]. The MC fluorophores have been actively studied as antibacterial tools in photodynamic therapy [91, 92] and as oxygen sensors [93, 94] due to their ability to generate singlet oxygen species.
It should be emphasized that MC incorporation into an eco-friendly matrix represents a new way of designing sustainable materials. However, physical segregation of the inorganic luminescent component and organic host leads to significant light scattering. This problem should be resolved before the application of hybrid inorganic-organic composites in optoelectronic devices. Up to now, many of the studies have been performed on the properties of composites where the aforementioned fluorophores were incorporated into an organic matrix.
Luminescent lanthanide labels contain lanthanide elements of [Xe]4fn configuration with n ranging from 0 to lanthanum up to 10 for lutetium, respectively. The most important electronic transitions used for the spectroscopic properties of lanthanide complexes arise from 4f-4f intra-shell transitions. It is known that electrons of the 4f shell are shielded from the environment by the outer filled 5s2 and 5p6 shells. These outer shells also prevent a radial expansion of the 4f shell. So, the abovementioned 4f-4f transitions are weakly affected by the ligand field and chemical surroundings [95], resulting in narrow spectral emission lines is a characteristic of most of the lanthanide ions [96]. In fact, the full width at half maxima (FWHM) for Tb3+ ion luminescence bands is close to 10 nm, whereas in the case of the Alexa dye, the FWHM is about 43 nm and, additionally, a large tail at the long-wavelength side can be seen [96].
Purely electronic dipole transitions between two levels in the 4f shell are forbidden by the parity selection rule, so electronic transitions within the 4f orbitals are usually considered as the combination of electric and magnetic dipole ones. The corresponding bands are weak and characterized by low absorption coefficients [97]. However, some organic photosensitizers are able to generate the “antenna effect,” which significantly improves direct excitation of the ions [96, 98]. The excited state lifetimes for many lanthanide (rare-earth) ions, e.g., Eu3+ or Tb3+ ones, reach a few milliseconds, so there is the advantage of Ln complexes in the improved signal-to-noise ratio due to the possibility of performing time-resolved measurements. In comparison, the lifetimes for organic fluorophores are of the order of tens of nanoseconds, so time-resolved detection of the luminescence signal is impossible. Even in the case of coordination complexes containing heavy elements, like iridium or platinum, the luminescence lifetimes are only about microseconds for emission from triplet states, supported by spin-orbit coupling.
There are several important options that Ln luminescent label will possess for being suitable for bioanalytical needs. It is obvious, an absorption of the material used has to be as high as possible in an adequate spectral range. Then, the efficiency of the sensitization should be optimized experimentally for the specific lanthanide. The third, non-radiative deactivation pathways for Ln ions must be minimized, so the PL efficiency will be as high as possible. Surely, lanthanide labels should have the highest possible solubility in water to facilitate the labelling procedure. However, experimental studies have already shown that the solubility is not so critical [99–104]. Water solubility is not a prerequisite for the use of an Ln-based luminescent label, as the required result can be achieved by using a mixture of a highly polar solvent (e.g., DMSO or DMF) with water.
In a case of successful formation of Ln-based luminescent complex by attaching ligands, the next step is linking such a label to biomaterial by covalent bonding. Importantly, the biomaterial should not affect the electronic and vibrational energy levels of the label. Otherwise, the luminescent properties of the latter could be significantly worsened [96].
The metal-organic frameworks (MOFs), due to their ordered porous structure with the possibility to be adjusted for the sake of tuning chemical and physical properties, are promising materials for the elaboration of optical devices, particularly fluorescent sensors [37, 105, 106]. The MOFs are similar to the transition metal and lanthanide-based complexes. Their luminescent properties can be designed and controlled by utilizing specific molecular fragments as building blocks in order to meet the requirements of the application [107]. The physical and chemical characteristics of MOFs can be improved by moving to the ‘‘Guest@MOF’’ composite system [108], yielding luminescent materials for optoelectronic devices, e.g., optical sensors [37, 106, 109]. In such composites, the MOFs serve as a host for luminescent species, which are incorporated into the pores of the MOFs. Because of the confinement effect of the host on luminescent particles, trapped in pores, the non-radiative relaxation in the fluorophore molecule is limited, resulting in improved luminescence characteristics of the guest [110, 111]. It should also be taken into account that many of the MOFs reveal their own luminescence, forming with the guest a dual-emission system or providing an energy transfer to the guest molecule, enhancing the luminescence intensity of the latter [112].
A RhB@ZIF-71 system (i.e., rhodamine B fluorophores confined in zeolitic imidazolate framework-71 host) was described in the work [37]. The system not only overcomes the drawback but also endows the material with new functions, namely, mechanochromism, thermochromism, and solvatochromism [113]. However, the Guest@MOF materials may suffer from certain shortcomings, especially poor long-term stability under real operational conditions. This drawback can be overcome by a combination of Guest@MOF material with polymer. In such a hybrid composite, the Guest@MOF material preserves its fluorescence properties, and additionally, thermal stability and processability can also be improved in this way. In particular, Zhang et al. [37] reported the preparation by electrospinning technology of the nanofibers consisting of RhB@ZIF-71 nanocrystals and polyvinylidene difluoride (PVDF) polymer matrix (Figure 2). Such fibers are characterized by excellent thermal stability and a high quantum yield that widens the application range for this composite material compared with RhB@ZIF-71 powder [37].
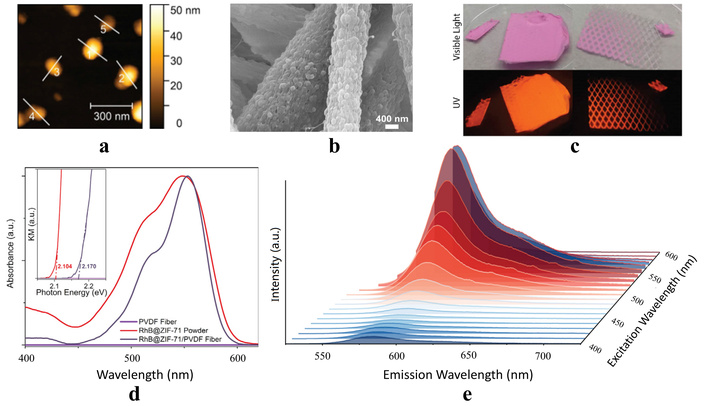
Morphology and optical properties. a) AFM topography showing the nominal size of the RhB@ZIF-71 nanocrystals synthesized by the high concentration reaction (HCR) method; b) SEM image which reveal the uniform dispersion of the RhB@ZIF-71 HCR nanocrystals coated by the PVDF matrix; c) RhB@ZIF-71/PVDF fiber parts (random and textured) under the visible light and under 365 nm excitation UV lamp; d) UV-Vis diffuse reflectance spectra (inset: Kubelka-Munk function and estimated the band gaps); e) PL map for the RhB@ZIF-71/PVDF fiber. Adapted with permission from [37]. © 2021 The Author(s). CC BY-NC-ND 4.0.
Today, it is difficult to overestimate the importance of quantum dots, in particular, luminescent ones, in science and technology [16, 38, 114, 115]. Several types of quantum dots can be noted that have been developed over a long period of time, and until recently. Those are carbon quantum dots (CQDs) [116, 117], perovskite quantum dots (PQDs) [118–120], and semiconductor quantum dots (SQDs) [114, 121–124]. Luminescent particles (fluorescent nanoclusters) of extra small size (< 5 nm) can also be regarded as QDs. Due to a small difference between the size of QDs and fluorescent nanoclusters (1–2 nm), these two terms correspond to almost the same objects.
It is known that the carbon quantum dots can be used as biological labels/markers as they have high solubility in water, low cytotoxicity, and good biocompatibility. In addition, they are chemically inert, and their physical properties can be adjusted by simple functionalization. However, CQDs lack sufficient quantum yield; the mechanisms of their luminescence are not clarified yet, so it is hard to find ways to improve the PL properties of the CQDs. The application of CQDs as luminescent probes requires NIR emission for two reasons: 1) Blue-green luminescence can overlap with intrinsic emission from cells and their constituents, so it is hard to separate contribution from label; 2) animal tissues are transparent in ~750–1,300 nm range, so emission in this region can be used for in vivo studies. Although most of the studied CQDs emit in the blue-green region, there are also recent reports concerning luminescence of CQDs in the yellow-red and NIR spectral regions, which is prospective for biomedical applications [47, 116].
Due to the tunable luminescence and high color purity (CP) of perovskite quantum dots, they attracted great attention as materials for photonic and optoelectronic applications, e.g., next-generation displays, topological lasers, light-emitting diodes, etc. [125]. Especially, the emerging lead halide PQDs (APbX3, where A = methylammonium MA, Cs; X = Cl, Br, I) are very exciting due to the low-cost solution synthesis process and the continuously tunable band gap by variation of halide compositions and crystal size [126, 127], comparing to traditional metal chalcogenide QDs such as CdSe, lead halide PQDs show high PL quantum yields (PLQY over 90%), narrower FWHM (12~25 nm) and wider color gamut (~150% NTSC) [127]. Details of the synthesis, treatments, functionalization, chemical, and physical properties of PQDs can be found in various reviews and original works (e.g., [118–120, 128–130]).
Semiconductor quantum dots are nanocrystals composed of chemical elements of II–VI (e.g., ZnSe, ZnS, or CdSe) or III–V groups (e.g., InP, InAs, GaAs, and GaN). The size of these nanocrystals should be up to 5 nm [131, 132]. The first studied SQDs (which were in fact semiconductor cores without any covers) revealed weak and unstable emission due to defects and imperfections of the particle surface. These defects captured the excitation energy, followed by the deactivation of the excited particle as usual, in a non-radiative manner. In addition, a high surface-to-volume ratio results in high chemical reactivity of such semiconductor particles. Consequently, some additional energy traps can be created on the basis of agents adsorbed on the surface of SQDs, leading to additional quenching of luminescence [128]. In order to resolve the noted above problem with the effect of surface on luminescence properties of SQDs, these objects were covered by a shell, resulting in core-shell structures with improved stability and quite high PLQY [38, 121].
It is worth noting that composite systems in which dyes or QDs are combined with some other nanosized labels. So-called FloDots composite systems (dye-doped silica nanoparticles) are good examples of such objects. Typical FloDots consist of luminescent organic or inorganic dye molecules dispersed inside the silica matrix. Among the advantages of FloDots, it is worth noting their high emission intensity, excellent photostability, water solubility, and efficient conjugation—all these factors make FloDots composites prospective luminescent labels [133]. Biochemically modified FloDots have been developed for various applications using well-developed immobilization protocols based on the silica surface [134–138]. Another type of composite is constructed from QDs and silica nanoparticles. These composites are the classes of luminescent materials that overcome the limitations encountered by organic fluorophores in bioassay and biological imaging applications [50].
In order to integrate the unique electrical and optical properties of carbon nanomaterials with the advantages of nanogels, the hybrid nanogels are actively being developed nowadays. As can be seen from the above, luminescent markers/labels usually have to be protected from the influence of the environment into which they are introduced, so the markers do not lose their luminescent properties. From this point of view, a marker in the form of a relatively large inorganic, in particular oxide, nanoparticle may look even more attractive than those described above, since its central part is protected from the environment by a self-formed transition layer.
A particle of an inorganic compound acting as a luminescent marker/label has to include luminescent ions of the rare-earth (lanthanides), transition, mercury-like elements [139–143], or silver [144–146]. Various types of inorganic materials, such as simple and complex oxides, fluorides, and oxofluorides, have been used as the matrices for the aforementioned ions. The multifunctionality can be considered among the main advantages of luminescent inorganic nanoparticles when used in bio-applications, as such matrices can possess luminescence sensitization. Importantly, the inorganic particles can be used simultaneously as the carrier for drugs and as an imaging probe.
Lanthanide-doped inorganic nanoparticles are characterized by narrow PL bands (lines) caused by radiative transitions in the rare-earth ions, similarly to that observed for lanthanide chelates. However, in contrast to the last ones, the rare-earth-doped inorganic nanoparticles are characterized by high photochemical stability and luminescence with a large lifetime constant (up to several milliseconds and even seconds) [38, 139–143].
A lot of papers have been devoted to elaboration of dispersed colloids of doped with Ln3+ and Ln2+ ions nanoparticles of aluminates [36], titanates [147], tungstates [148], vanadates [149], fluorides [150, 151], phosphates [152–154], fluoro-phosphates [155, 156], and silica [157]. The use of core-shell composites, where the core is doped with luminescent ions, increases the efficiency of using such nanoparticles as markers/labels. Such markers were developed and reported, in particular, in the works [158–160]. These materials have strong fluorescence, low toxicity, and are readily synthesized in water, which greatly simplifies their biofunctionalization. So, they can be regarded as promising candidates for luminescent marking and labeling. Moreover, their applications for biological purposes have already been reported [161–164].
Up-converting nanophosphors are very attractive for the purposes of luminescent labeling of bio-objects [165, 166]. A low level of own luminescence of materials under study under IR excitation, and a large spectral distance between excitation and luminescent radiation spectral bands are among the main advantages of these phosphors [167, 168].
Cellulose is a natural polymer, a linear homopolysaccharide, that consists of β-d-glucopyranose long chains that are joined by β(1→4) glycosidic bonds. The chains of cellulose have glucose as a repeat unit (i.e., monomer) with a non-reducing and a reducing end [169–173]. In our opinion, Figure 3 perfectly illustrates the origin and hierarchy of the structure of cellulose forms at various levels—from the plant (tree) to the molecule.
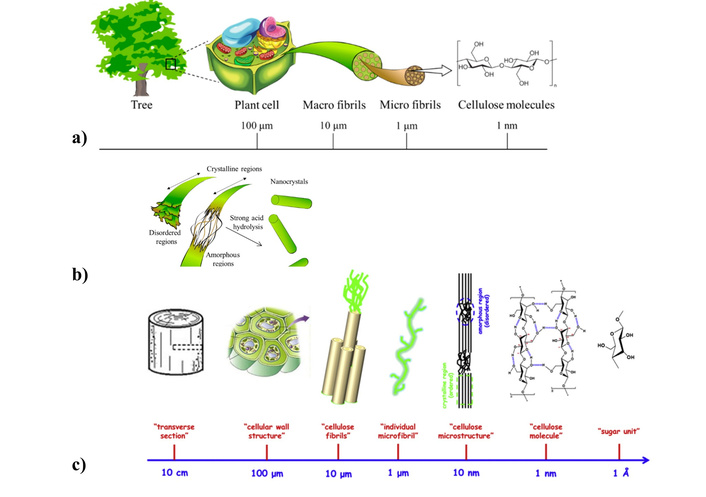
Origin of cellulose micro/nanomaterials. Schemes of hierarchical genesis of the cellulose (a, c); scheme of cellulose production by acid hydrolysis (b). (a) and (b) adapted from [174]. © 2020 by the authors. Distributed under a CC-BY 4.0. (c) adapted with permission from [175]. © 2014 Published by Elsevier Ltd. CC BY-NC-ND 3.0.
Considerable attention has been paid for the last few decades to studies of cellulose and its derivatives as prospective materials for modern optoelectronic devices [22]. This natural polymer has numerous advantages compared to artificial ones. In particular, cellulose-based materials are inexpensive, versatile, biodegradable, and eco-friendly systems [21]. Cellulose is one of the polysaccharides that covers a broad range of life and is the most abundant natural material on our planet, as it is the main component of the cell walls of all plants. Consequently, cellulose materials, in particular cellulose nanomaterials (CNMs), can be obtained from various abundant sources, e.g., agricultural waste, or produced by bacterial processes [170–173].
As has been emphasized earlier [31], the nomenclature of the cellulose particles has not been standardized yet. Thus, there is some inconsistency in terms that correspond to different kinds of cellulose nanoparticles in the literature. CNMs can be divided into several forms. In particular, cellulose nanofibrils (CNFs) and cellulose nanocrystals (CNCs) have been extensively studied over the past three decades [24, 176–180]. CNFs are usually produced through the mechanical and/or chemical/enzymatic breakdown of plant matter, using processes such as grinding, homogenization, and microfluidization. The so-called BC, produced by bacteria, also consists of similar CNFs [181–184]. It is also important to mention the microcrystalline form of cellulose—MCC [185, 186].
The CNCs are nano-sized chains with a length of about 100–400 nm and with a diameter in the 3–50 nm range. The CNFs have nano-sized chains with a length of 500–2,000 nm and a diameter in the 6–80 nm range. Both CNCs and CNFs are produced from cellulosic fibers with a crystallinity degree varying in a range of 40–90%, depending on the source of raw cellulose [187–190].
The MCC is a material obtained by purification and partial depolymerization of cellulose, in particular, by treatment of α-cellulose with mineral acids, such as H2SO4 or HCl [187, 191]. The degree of crystallinity of MCC in most cases is about 54–65%. The typical length of MCC fibers substantially exceeds that of CHFs and can be up to hundreds of microns (e.g., ~250 μm). Meanwhile, the crystallites in MCC have a length of about 35 nm, and the width was found to be approximately 3–5 nm [192]. It is seen that both MCC and NC consist of cellulose fibrils of similar dimensions. Thus, some common peculiarities in the physical properties of MCC and CNCs can be expected [187, 191, 193–195].
Taking into account the purpose of this review, it is worth mentioning a hydrogel state, as this form of cellulose material is very important regarding possible bio-medical applications of CNMs [196–199].
While glucose and cellobiose (a disaccharide consisting of two glucose molecules)—building blocks of cellulose—are easily soluble in water, cellulose itself is extremely stable against a number of different solvents, including water. The strong hydrogen bonding within the crystalline regions has been considered as a main factor in determining the insolubility of cellulose. However, this point of view is not unambiguous. In fact, amorphous cellulose is also insoluble in water, although the hydrogen bonds here are much weaker than in the crystalline part. At the same time, cellulose and its derivatives swell and can be dispersed in water, forming suspensions. The interaction of cellulose molecules with water results in the formation of numerous hydroxyl groups along the chains. These interactions have been used as a processing and activation step in the dissolution in other solvents, and the medium provides the means for the dispersion of CNMs when a cellulose-based composite is produced. The peculiarities of the cellulose-water interaction are also important from the point of view of luminescent labeling, because they determine the behavior of cellulose in relation to water-soluble markers.
Numerous examples of elaboration of the cellulose-based composite materials that were proposed for plenty of different applications can be found in the literature [200–203]. Particularly, biocomposites are among the most important. A common bio-composite consists of a matrix (e.g., resin) and plant fibers used as reinforcing agents. The artificial fibers can also be used as a reinforcing material in biocomposites, as obtaining of suitable herbal fibers may be accompanied by environmental issues and a high cost of their production. Polymer matrices can be either from renewable or non-renewable sources. The main role of the matrix in such composites is the protection of the fibers from mechanical damage and from the influence of environmental factors. Due to the advantages, such as biodegradability, relatively cheap price of production, and ease in recycling, the biocomposites are gaining increased interest as materials for flexible electronics, motors, packages, textiles, water treatment, etc. [35, 143, 204–207].
Bio-medicine is one of the important fields of cellulose-based composites applications. Cellulose can be considered a material with high biocompatibility and, as a rule, causes only a moderate response of the immune system in vivo. The low level of biodegradation of cellulose-based biocomposites is inevitably caused by a lack of cellulolytic enzymes (cellulases) in the animal or human organism. So, in general, cellulose can be considered as a material with slow (if any) biodegradability in vivo. The crystallinity, swelling, and hydration of cellulose may affect the degradation rate, absorption, and response of the immune system [175]. It is known that the best biocompatibility is achieved in the case of BC due to its biosynthetic nature. This feature is very important in the case when tissue regeneration is required (e.g., artificial bone grafts), but for some other applications (e.g., artificial heart valves or menisci), biocompatible and non-biodegradable composites can be used [22]. Biomaterials, based on nanocellulose, can be used as special tissue bio-scaffolds, which provide advantageous conditions for cell attachment and proliferation. Such materials are characterized by high biocompatibility and reveal mechanical properties close to those of natural tissues [22]. Up to now, there are many nanocellulose-based biomaterials have been studied, namely composites, hydrogels, nanofibers, membranes, etc. As mentioned above, BC is a very interesting medium for cell culture due to its low cytotoxicity and high porosity [175, 207]. The details about the advantages and drawbacks of the various cellulose derivative materials and cellulose-based composites can be found in the aforementioned and some other original and review papers (see, e.g., [208–216]).
On the whole, there is also no evidence for serious influence or damage caused by nanocellulose on both cellular and genetic levels, as well as in vivo organ and animal experiments. However, further systematic studies on the possible negative effects of nanocellulose on living organisms, particularly through the agglomeration of particles in the body, are of high importance. Nevertheless, high chemical and photochemical stability, hydrogen bonding capability, and low cytotoxicity of various types of cellulose-based materials/derivatives have determined their current and potential usage in pharmaceutical applications [34, 217, 218]. These materials are components of many medicines; in particular, the cellulose ethers and esters are part of more than 10 types of drugs of various actions, in particular, Desogan, Flumadine, Flurbiprofen, Lopressor, Oxycontin, etc. [217].
Cellulose derivatives are widely used for thickening of suspensions and emulsions, in particular, those that are pharmaceutical solutions [217, 219]. These materials can also increase the viscosity of non-aqueous dispersed systems, like organic-based ones. Viscosity enhancement of drug solutions poses many advantages, such as improving consumption controllability and increasing the residence time of drugs in topical and mucosal solutions, which leads to improved bioavailability of topical, nasal, or ocular preparations. It has been revealed that viscosity enhancement, in some cases, can increase the absorption of some poorly absorbing drugs like insulin from oral dosage forms [220]. In the case of emulsions of drugs, utilizing cellulose derivatives improves resistance against mechanical and thermal shocks, increasing their shelf life. Currently, cellulose ethers of high molecular weight have been considered as the most suitable additives for increasing of viscosity of pharmaceutical solutions [220].
The other way to improve the specific localization of drug delivery to various biological objects and increase their residence time is bio-adhesives and muco-adhesives. Such systems were proposed about four decades ago and are widely used nowadays [221, 222]. Bio- and muco-adhesives are formulated to use on the skin and mucus membranes of gastrointestinal, ear, nose, eye, rectum and vagina. Smaller size and thickness, compared to tablets, of such dosage forms result in better patient compliance. Both bio- and muco-adhesives have usually been prepared in the form of polymer films, incorporated with drugs. After combining with moisture or mucus substances, these films should adhere to biological membranes, with subsequent release of the drugs. Depending on the release rate in such drag delivery systems, it is possible to change the residence time of the medicines and adjust dosing frequency [221, 222]. So, specific requirements should be met by film-formers and adhesive polymers. The bio-adhesive compositions were elaborated on the basis of synthetic (e.g., acrylic derivatives: polycarbophil and carbopol), natural (acacia, alginates, carrageenan or pectin), or semi-natural (chitosan and cellulose derivatives) polymers. Among the latter ones, the cellulose ethers are known components of bio-adhesives. They are used in various types of drug-in-polymers films, in particular, suitable for buccal, ocular, vaginal, nasal and transdermal treatment, both alone or with combination of other polymers. More recently used cellulose ethers in bio-adhesives include nonionic cellulose ethers such as ethyl cellulose, hydroxy ethyl cellulose, hydroxypropyl cellulose (HPC), methyl cellulose, carboxy methyl cellulose (CMC) or hydroxylpropylmethyl cellulose (HPMC) and anionic ether derivatives like sodium carboxymethyl cellulose (NaCMC) [223, 224]. In contrast to polyacrylate and thiolated-based polymer films, the cellulose ethers, such as NaCMC and HPC, have little dependency of adhesion time and adhesion force on the pH of the medium. The adhesion properties of cellulose derivatives can be improved by the use of additional polymers or polysaccharides.
Both cellulose ethers and esters are widely used as functional covers for solid dosage forms of medicines, e.g., pills, tablets, microcapsules, etc. These covers protect drugs against humidity and oxygen, and prevent the enzymatic and acidic degradation. In addition, the smell and taste of such medicines can also be masked. Among the advantages of using covers for solid drug forms is the possibility of controlling release in such dosage forms (e.g., delayed, extended, step-by-step release, etc.).
Another important type of medicine is based on gel-like substances incorporated in a polymer shell. It is known that gels can be formed by soluble and insoluble cellulose ethers through the absorption of water [225, 226]. Among them, HPMC and CMC, derivatives of cellulose widely used as gelling agents in drug compositions. In contrast to natural gelling agents, like sodium alginate, agar, pectin, and gelatin, the HPMC and CMC are less sensitive to microbial pollution [197, 227].
Currently, the prevailing part of commercial packaging of food and goods is related to the use of petroleum-based materials, which results in negative effects on the environment. Due to its abundance, biocompatibility, low (if any) level of toxicity, and ease of disposal in an eco-friendly way, cellulose-based materials are considered an outstanding alternative for commercial packaging films. Among the main drawbacks of cellulose films for food packaging are their low antioxidant and antimicrobial activities. Consequently, pure cellulose-based films do not succeed in food preservation performance. Last time, packaging films were intensively developed by incorporating antioxidants and antimicrobial agents such as natural extracts, natural polyphenols, nanoparticles, and microparticles into the cellulose-based films [35, 67, 202, 227, 228]. The changes in the other properties of the films, such as hydrophilicity, water evaporation rate, and mechanical properties, have to be monitored if noted additives are incorporated. One can see that the impact can be reflected in luminescent characteristics of both the cellulose matrix and additives.
Agriculture is another important field where luminescent labeling can be used as a very effective tool. The most challenging tasks in modern smart agriculture are the precise labeling and recording/reading of information about the peculiarities of the growth of the plants [229]. The Agricultural Internet of Things (IoT) concept requires the evolution of traditional agriculture into a precision one, through a significant shift in farming practices [36]. Comprehensive monitoring of various indicators of plant life is the key point for the creation of smart farms [230]. Thus, precision agriculture requires real-time monitoring, large data collection and processing abilities, accompanied by intelligent decision support in order to improve farming efficiency by variation of plant growth conditions. Consequently, the development of an intelligent plant labeling system with high reliability, simple record/read/update functions, and easy integration with available IoT platforms is of high importance for modern agriculture [36, 52, 230–234].
Cellulose materials, particularly nanocellulose, have been extensively investigated as excellent biomaterials in membrane filtration due to their exceptional properties, such as large specific surface area, anti-fouling behaviour, high aspect ratio, etc. The large surface area of nanocellulose contains a large number of free hydroxyl groups, which are easily modified and functionalized. It was shown that the modified nanocellulose can be used in filter membranes to improve their abilities in removing heavy metals, oil, or organic compounds from water solutions/suspensions [196, 235–237]. It is known that some of the noted compounds, which should be removed, are active in luminescence, so their PL characteristics can be used for labeling purposes and control of the removal process [238, 239].
It is obvious that for each type of composite and its application, the type and method of using luminescent markers/labels may or must not be the same. This fact should always be taken into account when planning studies with luminescent labeling of cellulose materials [23, 29, 36, 171, 238–240].
Cellulose in its various forms, cellulose derivatives, and cellulose-containing materials are able to reveal visible luminescence. The intensity, spectral profiles, band positions, and luminescence decay kinetics depend on various factors (e.g., origin of cellulose source, parameters of the environment, like temperature and humidity, etc.). Own/intrinsic luminescence of the cellulose is, typically, less intense compared to light emission by common luminescent agents, like ions of the rare-earth and transition elements or quantum dots. However, available scientific data indicate the possibility of using characteristics of cellulose’s own luminescence for tracking the response of cellulose-containing materials to external impacts. Such a response allows considering of own luminescence of cellulosic materials as their self-marking/labeling [241, 242].
So, it is reasonable to point out some characteristics of cellulose’s own (or intrinsic) luminescence. It is generally accepted that own luminescence in the case of solids occurs without special incorporation of any additive luminescence agents, but it can be related to constituents of the lattice or intrinsic defects of the material. The PL of various cellulose-containing materials has been studied and reported for a while [241–246]. The intensity of this luminescence is quite high, so it can be easily observed at appropriate PL excitations.
Luminescent characteristics of two types of microfibrillar, one type of nanofibrillar celluloses, and birch cellulose have been described in detail in the literature [247]. The PL spectra were measured with a time delay between the excitation pulse and the start of the detection. Such an experimental design allowed distinguishing the PL spectra of fast and slow components of the cellulose emission.
Four types of cellulose forms (MCC, MFC, NC, and BC) have been mainly used for the luminescent study in the works [27, 30, 248, 249]. The main characteristics of the MCC, MFC, NC, and BC luminescence are similar to each other and are typical of those for cellulose-based materials measured elsewhere. Three PL bands with maxima near 370, 430–470, and 505–510 nm can be distinguished, and they have been ascribed earlier to three different luminescence centers [250]. The PL bands with maxima near 420–460 and 495 nm were also reported in the literature [251, 252]. The statements above concern the luminescence of the cellulose materials made from different sources such as bleached craft and sulfite pulps, Whatman filter paper, biomedical cellulose, etc. [252, 253].
It is known that the preparation and treatment conditions have a significant effect on the crystallinity and structure of cellulose-based materials, resulting in differences in physical properties, namely spectroscopic ones. In particular, the wide complex PL band in the 325–750 nm spectral range was reported for the MCC samples when the excitation wavelength varies from λex = 300 to 532 nm [30, 248]. The peak position, band shape, and peak intensity of the PL band depend on the excitation wavelength, λex. The peak position, λmax, shows a tendency to shift to the long-wavelength side with increasing excitation wavelength (Figure 4). The blue emission component, located at 430–470 nm spectral range, dominates in the PL spectra measured under UV excitation. The PL excitation in the visible spectral range (λex = 450–530 nm) leads to the appearance of a yellow-red luminescence band covering the range 500–700 nm, and with maxima position approximately at 580–590 nm (Figure 4, curves 4, 5) [30].
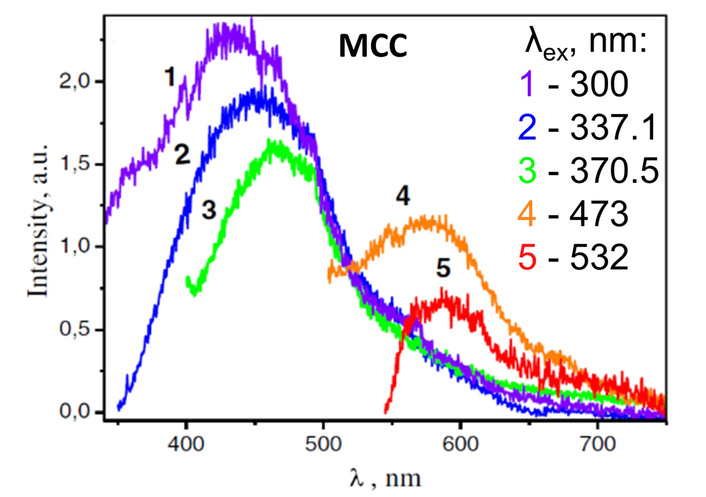
Steady state luminescent spectra of microcrystalline cellulose samples measured at excitations with λex = 300 (1), 337.1 (2), 370.5 (3), 473 (4), and 532 nm (5). Adapted from [30]. © The Author(s) 2017. Distributed under a CC-BY 4.0.
It can be assumed from the spectroscopic studies that the cellulose-based materials should have several types of luminescence centers. In particular, the presence of several emission maxima and the multi-exponential phosphorescence decay of the PL supports the assumption above. Unfortunately, the origin of these centers is still unclear, and additional studies are required.
It can be assumed from the spectroscopic studies that the cellulose-based materials should have several types of luminescence centers. In particular, the presence of several emission maxima and the multi-exponential phosphorescence decay of the PL supports the assumption above. Unfortunately, the origin of these centers is still unclear, and additional studies are required. Regarding the electronic structure of the basic elements of cellulose composition, the β-(1,4)-glycosidic linked glucose unit, it is hard to expect that it would be able to reveal any luminescence. However, glucose and cellobiose can absorb excitation light, followed by the transfer of absorbed energy to emission centers. In particular, the UV band with λmax 265 nm in the absorption spectra of “pure” cellulose was ascribed to the glycosidic –C=O bonds in molecular groups, which occur after isolation and purification of cellulose [251]. Based on the simultaneous theoretical and experimental studies, Da Silva Perez et al. [254] suggested that interaction between cellulose-related molecular groups leads to the formation of an energy state, responsible for light absorption by cellulose. Bikova and Treimanis [255] reported that monocarboxyl cellulose in NaOH solutions and oxidized lignin-free xylan reveal the absorption bands in the 190–500 nm spectral range. It is worth noting that the spectra were recorded for cellulose in alkaline media, where dissociation and ionization of carboxyl groups can be followed by isomerization of aldo- and keto-groups. The most intensive bands in absorption spectra can be ascribed to the following chromophores: 1) in the range of 200–220 nm—carboxyl groups; 2) 230–250 nm—furan-type aromatic compounds; 3) 270–290 nm—carbonyl groups; 4) 290–320 nm—pyron-type heteroaromatics; 5) 350–370 nm and 6) 430–450 nm—conjugated heteroaromatic species through charge-transfer mechanism.
The variation of intensity and maxima positions of PL bands for cellulose materials obtained from different sources (Avicel, cotton linters, sisal cellulose, sisal holocellulose, and anhydroglucose) has been reported earlier [256]. In the abovementioned study, the chemical modification of bleached hardwood papers was performed in order to increase the carboxylic content in them. The soluble samples of polymers in dichloromethane were obtained by acetylation of the cellulose in a homogeneous lithium chloride/N, N-dimethylacetamide solution (DMAc/LiCl). It was found that the presence of carboxylic groups in the anhydro-glucose units shifts the emission maxima by 10 nm to shorter wavelengths and increases their intensity. Oxidizing decreased the cellulose PL intensity by creating carbonyl groups. This effect is common for various cellulose samples regardless of their source [257]. At the same time, no correlation was found between the maxima position of the PL band (λmax) and average molecular weight (Mvis) or crystallinity index. In particular, it was reported that maxima position shifted to shorter wavelength in the sequence cotton linters–mercerized sisal cellulose–MCC; whereas Mvis increases in a row MCC–cotton linters–mercerized sisal cellulose; and PL intensity increases in a row mercerized sisal cellulose–cotton linters–MCC [257]. Based on the result of the study, it was suggested that each anhydro-glucose unit emits light as a separate chromophore, so strong interactions between these units can be excluded [257].
The main factors that lead to quenching of cellulose emission were also discussed earlier. Bateh and Winefordner [241] studied pulps of cotton linter and wood, as well as several types of paper filters, as room-temperature phosphorescent materials. It was found comparing “the best” and “the poorest” paper that the difference in their performance is considerably lower than an order of magnitude. However, later studies revealed the quenching effect of aldehyde and ketone carbonyl groups on cellulose fluorescence [256, 258].
The luminescence centers in cellulose materials can also be connected with “external” factors, like pulp processing and treatment. They can contribute to the formation of some aromatic structures at the reducing end groups of cellulose or hemicellulose [259]. It should be emphasized here that those related to quinones [253]. Most of the chromophores are ascribed to hydroxy-acetophenones, hydroxy-1,4-naphthoquinones, and hydroxy-1,4-benzoquinones. As a possible source of cellulose luminescence, the traces of the residual lignin or proteins, di-tyrosine, and coumarin acids should also be taken into account [246, 253, 257, 260, 261].
Possible contribution of transition-metal ions such as Cr, Cu, Fe, Mn, Mo, Ni, and Ti remaining after normal preparation procedures to the cellulose PL was studied under excitation of emission by power laser radiation of the cotton-derived samples of cellulose [244]. However, the PL properties of the abovementioned ions are very specific (features of emission and excitation spectra, decay kinetics). Thus, the manifestation of PL of transition metal ions can be easily seen on the background of cellulose’s own PL [246, 262], if the formers are present in cellulose materials. Analyzing the available literature data concerning cellulose luminescence, it is reasonable to assume that the impact of uncontrolled impurities of transition metal ions can be neglected in most cases.
Luminescence kinetics is a very important characteristic that allows distinguishing the specific emission centers in cellulose materials. In the case of MFC, the PL kinetics curves can be fitted by four or five independent slow decay processes, which are characterized with decay constants ranging from 1.2 to 361 ms [247].
The PL decay curves differ from each other for cellulose samples from various sources, and can be fitted by a sum of several exponential decays each. It was found that PL intensity decreases by about 30 times during 10 ns. It is worth noting that the PL decay curves at the 0–30 ns region can be distorted by a significant portion of scattered light from the light-emitting diode that was used for PL excitation. In the case of luminescence registered at longer wavelengths (500–700 nm), the PL decay became slower, which indicates that the slow component is related to the long-wavelength emission components of cellulose [247].
Many cellulose-based materials are elaborated from aqueous solutions. As mentioned above, the luminescent labeling is also often performed with the use of water solutions. Thus, the role of water molecules and their effect on the optical and dielectric properties of cellulose-containing materials has attracted significant attention (e.g., [263, 264]). A correlation of the luminescent properties with dielectric characteristics of the water solution of NaCl salt and nanocellulose had also been studied in our earlier work [265]. The dielectric properties were determined by recording the temperature dependences of the real ε/(T) and imaginary ε//(T) parts of the complex dielectric permittivity. The finding (Figure 5a, b) showed that relaxation processes occurred at these temperatures. A system modeled as an ensemble of identical relaxators was used to calculate the energy characteristics of the relaxation process. In this model:
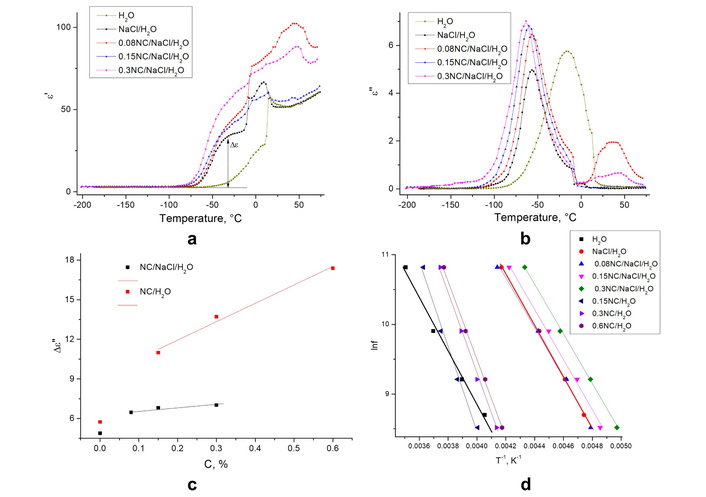
Complex dielectric permittivity behavior. Temperature dependence of the real (a) and imaginary parts (b) of the complex dielectric permittivity for H2O, NaCl/H2O, 0.08NC/NaCl/H2O, 0.15NC/NaCl/H2O, 0.3NC/NaCl/H2O; (c) height of the ε// peak (relaxation process maximum) vs. NC concentration in NC/H2O and NC/NaCl/H2O solutions; (d) Arrhenius plots, [ln(f) vs (1/T)], for NC/H2O and NC/NaCl/H2O samples, frequency of the external field is 10 kHz. Adapted with permission from [265]. © 2023 The Author(s).
Each of relaxators is described with two non-equivalent energy states, marked as 1 and 2, separated by some potential barrier [265];
the real and the imaginary components of the dielectric permittivity obey the following equations [62]:
where τ is a relaxation time, which can be estimated as:
The relaxation time τ is in relation to such energy characteristics of the dielectric relaxation as activation energy—U; and entropy of activation—ΔS:
where τ0 = 10–12 s; U—activation energy; ΔS—entropy of activation; k—Boltzmann’s constant [265].
It is easy to see that the increment of the dielectric permittivity is described by Equation 5:
N value is a concentration of relaxators in the formulas above, μ2—mean square of the difference of the relaxator dipole moments in states 1 and 2, V—the energy distance between 1 and 2 states. If to fit the ε/(T) experimental dependences in Figure 5a with Equation 5, the values of
It is obvious that the maximum on the ε//(T) dependency occurs when ωτ = 1, where ω = 2πf is the angular frequency of the external field. As a result, the next equation can be written:
Thus, ΔS and U dielectric relaxation parameters were evaluated with the use of so-called lnf (1/T) Arrhenius plots [265] (Figure 5c, d).
So, it was concluded that increasing the nanocellulose content in the suspension leads to a shift of the dielectric relaxation processes toward lower temperatures [265]. Interestingly, activation energy increases when nanocellulose is added to water, but the effect disappears when NaCl is introduced into the solution. The binding of water molecules with sodium ions was assumed to be the main factor causing a decrease in the intensity of the dielectric relaxation in the ions–water–cellulose solid solutions compared to water–cellulose ones. In fact, the binding of water molecules prevents the formation of hydrogen bonds between the molecules of water and methylol groups. As a result, the conformational motion of surface methylol groups is blocked, and the corresponding band of dielectric relaxation decreases in intensity [265].
The luminescence spectra of the nanocellulose suspensions described above are similar to those reported earlier for various cellulose forms (Figure 6).
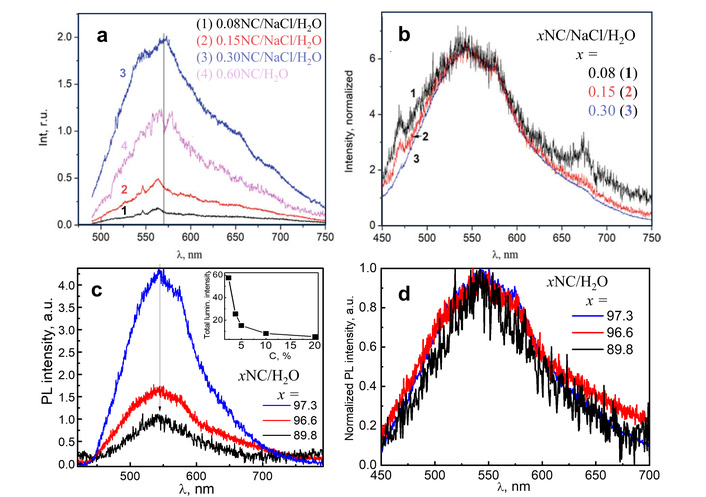
Luminescence spectra of the xNC/NaCl/H2O system. (a) The PL spectra of xNC/NaCl/H2O (1–3), and 0.6NC/H2O (4) solid solutions, λex = 473 nm; (b) normalized PL spectra from (a); (с) PL spectra of xNC/H2O samples (inset: dependence of the total PL intensity on water content); (d) normalized PL spectra from (с), λex = 405 nm, T = 290 K. (a) and (b) adapted with permission from [265]. © 2023 The Author(s), under exclusive license to Springer Nature Switzerland AG. (c) and (d) adapted with permission from [266]. © 2021 The Author(s), under exclusive license to Springer Nature Switzerland AG.
The PL of these samples is relatively weak, as water molecules surround the cellulose fibrils and, consequently, affect chromophore (fluorophore) molecules on their surface. Increasing the nanocellulose content in suspension leads to an increase in PL intensity because the content of fluorophore molecules also increases (Figure 6). It was mentioned that when dielectric properties were discussed, the sodium ions bind to water molecules, preventing access of the latter to cellulose-related molecules. As a result, the quenching of the PL by water molecules becomes less significant. So, it can be assumed that Na cations play the main role in promoting of the cellulose-related luminescence in water–cellulose–NaCl solutions (curves 3 and 4 in Figure 6a). The results obtained by luminescence spectroscopy are in accordance with dielectric studies, as they both support the assumption that the ions of NaCl salt prevent the formation of the hydration shell around the cellulose molecules [265].
As the results of using nanocellulose are determined by moisture content, it was not surprising that the impact of moisture content on the physical properties of nanocellulose has drawn significant attention [263–268]. The NC obtained by hydrolysis of the cellulose prepared by organosolv of Miscanthus x giganteus stems [268] has been used for the preparation of the set of samples [266]. The NC films with a moisture content of 10.2% (marked as 89.8 NC/H2O), 3.4% (96.6 NC/H2O), and 2.7% (97.3 NC/H2O) were prepared and studied.
These “hydrated” nanocellulose films reveal a wide complex PL band (Figure 6c and 6d), similar to that described above for solutions as well as for solid cellulose samples. The significant decrease of PL intensity was found with the increase of water content (Figure 6c and inset). The shape of this PL band also changes with variation of the water content (Figure 6d) [266].
Since the high-frequency vibrations ( ~1,800 and 3,600 cm–1) are inherent to water molecules, they are known as effective quenchers of the luminescence in various solid-state samples. In other words, the energy of the excited state of the fluorophore, in the presence of H2O molecules, may dissipate as phonons in a non-radiative way [269, 270]. The results presented in the inset in Figure 6c confirm the above-mentioned statement as the PL intensity of the nanocellulose abruptly decreases with the increase of water content from zero to 10.2 %. So, it is likely that at such water content, the number of H2O molecules is enough to interact with the prevailing part of the cellulose-related chromophores. To test this assumption, the PL experiments were performed with NC films in a weak stream of water vapor for 1 (point marked as 5%), 6 (10%), and 15 minutes (20%). It was found that with the further increase in the amount of moisture, the luminescence intensity decreases more slowly (inset in Figure 6c). This is also a change in the shape of the PL band with variation of water content (Figure 6d). So, different chromophores/fluorophores, probably, react with water molecules in different ways and, as a result, the quenching rate of their PL is not the same.
Luminescent cellulose self-labeling allowed studying the influence of alkali metal ions on some cellulose derivatives. The impact of the alkali metal ions on the HPC water solutions was discussed in our recent papers [271, 272]. Our interest in such a study was caused by the fact that the HPC is known to undergo a structural phase transformation with a so-called Lower Critical Solution Temperature (LCST). This structural transformation in aqueous solutions of HPC has been known for a while [273]. It is also known that when their physical properties, e.g., rheological and optical ones, are changed significantly in the narrow temperature range near the LCST. At the same time, the effects of the external factors on the characteristics of the phase transitions have been intensively studied up to now [274–276]. The interest in such studies is connected with technological problems of “smart materials”, whose physical and chemical properties are a function of external parameters (temperature, pressure, pH, electric and magnetic fields, etс.). Various characteristics of the HPC solutions containing Na+ and Cl– ions were studied in the temperature range 10–70°C, as the LCST point can be located near 40–45°C [272]. In fact, two points of singularity were found for the HPC:Na+,Cl– solutions (concentration of HPC was 1%, and NaCl salt in solution is 0.154 mol/L) in the noted temperature range (Figure 7).
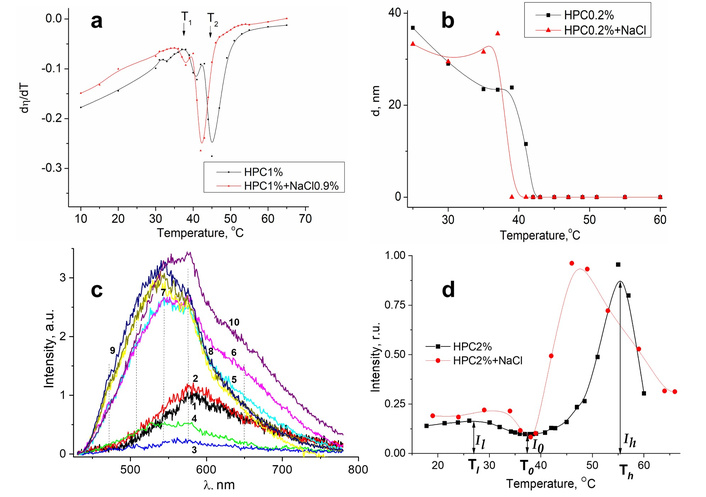
Effect of temperature on dynamic viscosity and luminescence characteristics. Temperature dependences of the change of the dynamic viscosity rate (a) and nanoparticles sizes (b); (c) the PL spectra of the NaCl-HPC solutions at different temperatures: T = 19°C (1), 34°C (2), 38°C (3), 39°C (4), 42°C (5), 46°C (6), 53°C (7), 59°C (8), 64°C (9), and 64°C (10); (d) the dependences of the PL intensity on temperature. HPC concentration is 2%; concentration of NaCl salt is 0.154 mol/L. (a) and (b) adapted with permission from [271]. © 2022, IEEE. (c) and (d) adapted with permission from [272]. © 2023 The Author(s), under exclusive license to Springer Nature Switzerland AG.
The PL spectra of HPC suspensions both with and without NaCl were obtained at certain temperatures within the noted temperature range (Figure 7c). The dependencies of the PL intensity on temperature for HPC solutions are shown in Figure 7d. It can be seen that the shape of the bands in the PL spectra changes at the LCST point, where phase transition takes place. The changes in the PL spectra with further increasing temperature are not significant. It should be emphasized that two maxima are observed in the PL intensity dependencies shown in Figure 7d. There are two subregions that can be distinguished in the low-temperature region for HPC-NaCl systems (Figure 7d, red curve): A plateau from 17°C to about 25°C, and a subregion with a maximum near 32°C. The latter region corresponds to the active formation of large particles after adding the sodium chloride to the suspension.
The observed changes in the PL properties can be ascribed to the destruction by Na+ ions of the hydrate shell of water/HPC chains, with further formation of the hydrate-solvation shell. The effect of the latter on the luminescent properties of the luminescent centers is not identical to the effect of a hydrate shell. The temperature behavior of the spectra and luminescence intensity of HPC–water–MCl (M = Li, K, Rb, and Cs) systems was found to be similar to that of NaCl-HPC. The extrema positions (T1, T0, and Th in Figure 7d) and the PL intensities at corresponding temperatures (I1, I0, and Ih in Figure 7d) have different values for the systems containing different salts. Since the mechanisms affecting the PL spectrum in low- and high-temperature ranges are different, it is convenient to use a quantity Rlum, which takes into account the luminescent characteristics of the solutions in these temperature regions and can be calculated by Equation 7:
where Il, I0, and Ih are the PL intensities at temperatures T1, T0, and Th, as was outlined above. The values of temperatures Tl, T0, and Th, as well as the Rlum values, are noted in Table 1.
Temperature points and Rlum values for the HPC–water–MCl systems.
| Temperature and Rlum | Solution | |||||
|---|---|---|---|---|---|---|
| HPC | HPC-LiCl | HPC-NaCl | HPC-KCl | HPC-RbCl | HPC-CsCl | |
| T1, °C | 27.1 | 25.9 | 31.7 | 24.8 | 27.0 | 30.2 |
| To, °C | 37.3 | 38.2 | 38.1 | 35.8 | 41.3 | 41.2 |
| Th, °C | 55.1 | 52.3 | 46.2 | 43.5 | 43.4 | 46.0 |
| Rlum | 12.8 | 3.91 | 6.32 | 4.03 | 2.26 | 4.14 |
M = Li, K, Rb, and Cs. Adapted with permission from [272]. © 2023 The Author(s), under exclusive license to Springer Nature Switzerland AG.
The data in Table 1 show that the T1 and T0 values reveal no trends or regularities in the studied homologous series of the salts. This can be expected, as various processes are involved at low temperatures. Thus, it is currently impossible to untangle the impact of each actual mechanism [272].
The value of T0 then plays a technical role: to determine the value of I0. In contrast, both of the Th and Rlum values consistently decrease for solutions with cations Li+→Na+→K+→Rb+. Clearly, this trend is due to the ionic mechanism of alkali metal ions’ impact on the structure of water in the nearest surrounding of the HPC molecules/chains [272].
It is worth mentioning that spectral profiles and intensity of the intrinsic luminescence of the HPC–water–salt suspensions are quite sensitive to the changes in the structure of the water in these solutions, which allows monitoring the thermal behavior of sol–gel phase transition in the noted systems. Through such luminescence analysis, a self-association of HPC particles with quite a large size (above 2 microns) was confirmed. The presence of alkali metal ions in the HPC solution decreases the LCST and leads to the appearance of large nanoparticles at temperatures above the LCST. Interestingly, this temperature decreases from about 55° to 43°C along the Li+→Na+→K+→Rb+ homological row [272]. The described luminescent studies confirm the importance and perspectives of the luminescent self-marking of cellulose and its derivatives.
Cellulose materials incorporated with fluorescent dyes can combine perfectly the multi-functionality of the organic dyes with well-known mechanical and optical properties of the cellulose and its derivatives [277–281]. The cellulose-based samples can be obtained by various methods, like cross-linking, co-polymerization, or self-assembly.
In particular, Yao et al. [282] reported the results of the preparation and studies of a series of cellulose-based fluorescent aggregations encapsulated with FITC with different morphologies. The maximum fluorescence intensity was observed in the case of flower-like fluorescent aggregates. Such a result was ascribed to the matching of several factors, including the hydrogen bonding, electrostatic repulsion, rigid structure of cellulose, and the larger surface area in flower-like aggregation as a result of inhibiting π-π stacking and hydrogen bonding interaction of FITC. So, cellulose-based fluorescent aggregation could be processed into fluorescent fiber, coating, and printing patterns, and it has potential applications in information storage, scene warning, and special fiber [282].
Although various types of dyes have been introduced into cellulose, few works have been devoted to studying specific mechanisms of the interactions between the dyes and the cellulose materials, as well as specific behavior (e.g., aggregation, etc.) of the marker in cellulose host. However, such interactions and self-assembling could have a significant effect on the PL intensity, spectral, and kinetic characteristics of luminescent label [283, 284].
Yen et al. [58] studied the issue when the cellulose matrix quenches the PL of the dye, in a dynamical or statistical way (Figure 8a). It was suggested that the local (microenvironmental) rigidity of cellulose may be increased by linking a dye molecule to the polymer chain (Figure 8b, c). This potentially leads to a decreased rate of nonradiative relaxations and thus the quantum yield of the fluorescein increases [285–288], but the opposite can also be observed [58].
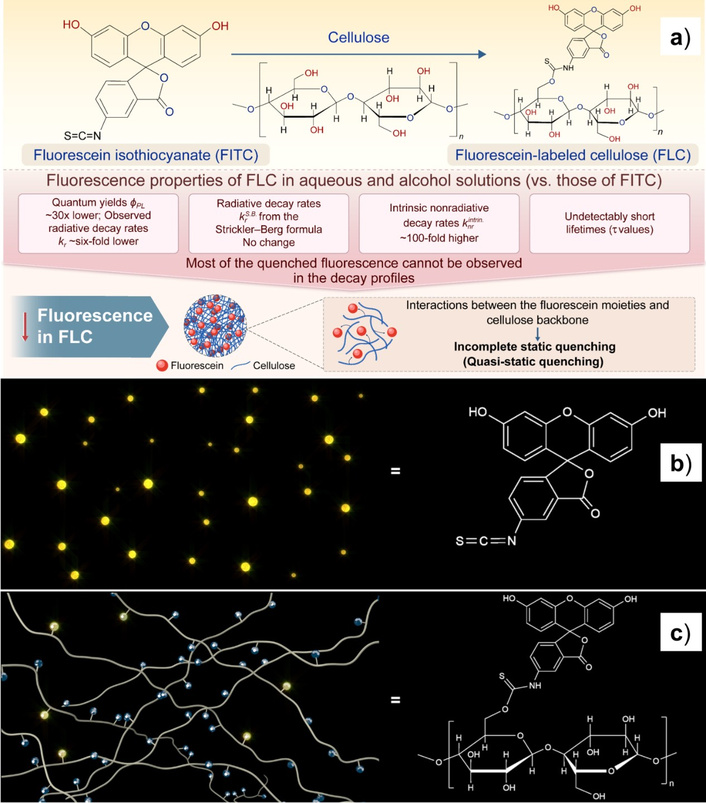
Cellulose with Fluorescein molecules. Graphical depiction of the study performed, including the chemical structures of the materials being compared and a summary of the results (a) and the PL behavior without (b) and with a cellulose network (c). The PL intensity FITC is higher and consistent (yellow dots), while the main part of the fluorescein moieties is quenched (dark blue spots) as attached to the cellulose molecules. Adapted from [58]. © 2024, The Author(s). Distributed under a CC-BY 4.0.
Despite the high popularity of the fluorescein dyes, they have typically been used with unsustainable substrates. At the same time, interactions of cellulose as a sustainable medium with fluorescein require additional studies. Although the fluorescence of a fluorescein derivative was reportedly enhanced on the cellulose backbone [289], some luminescence characteristics of the fluorescein/cellulose composites are known, but some others are poorly studied. Particularly, the luminescent properties of FITC and fluorescein-labeled cellulose (FLC), including their PL quantum yields, lifetimes τ, and rates of radiative kr and nonradiative knr decay, were determined earlier in solutions, namely water and alcohol [58]. It should be noted also that spectral profiles of emission don’t differ significantly for all the samples, when PL decay kinetics and PL efficiency vary significantly.
The dissolved FLC had about 30 times lower PLQY than FITC, six-fold lower kr, but a 10–20 times higher knr with respect to their FITC counterparts. It was suggested that the incorporation of FITC into the cellulose chains remarkably reduces its fluorescence efficiency. Presumably, this was because the cellulose backbone interacted weakly with the fluorescein moieties, suggesting a quenching mechanism that can be termed quasi-static, corresponding to static quenching between the fluorescein moieties and cellulose backbone, in addition to the fluorescence quenching caused by the intramolecular nonradiative processes of fluorescein, as observed in conventional molecules [58]. The schemes of the process above are illustrated in Figure 8b and 8c.
The results of the studies of bacterial nanocellulose samples that were obtained by the Kombucha membranes method [290, 291], incorporated with Rhodamine C, have been reported earlier [63, 292]. The concentration of dye (filler) was changed by variation of the soaking time of previously prepared BC films in a solution of Rhodamine C in alcohol (dye concentration was 10–4 mol/L).
Figure 9a and 9b show the unbleached BC film (1), the BC film bleached in 1% aqueous solution of NaOH during 24 h (denoted as BC2), sample bleached in NaOH solution during 192 h (BC3), and samples soaked in Rhodamine C during 5, 30 and 300 seconds (denoted as BC4, BC5, and BC6, respectively).
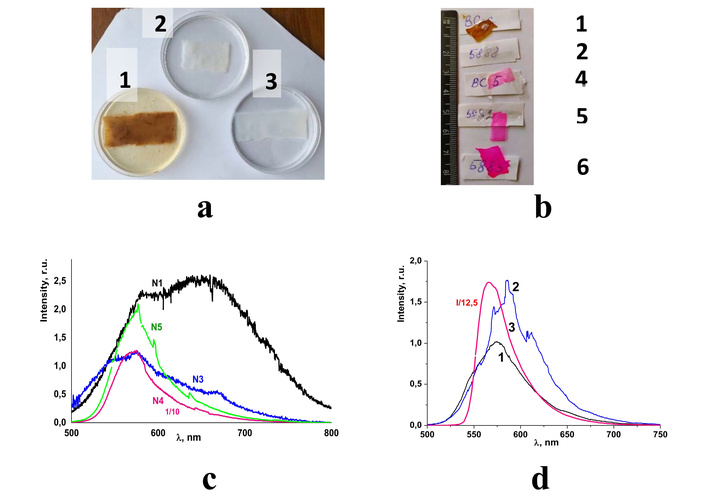
BC films with Rhodamine C. (a, b) Photo images of the prepared BC samples (see text for details); (c) PL spectra of the BC1 (curve N1), BC3 (N3), BC4 (N4), and BC5 (N5) samples. (d) PL spectra of the samples BC4 (curve 1) and BC6 (curve 2). The PL spectrum of the Rhodamine C is shown for comparison (curve 3 in Figure 9d); room temperature, λex = 473 nm [292]. Adapted from [292]. © The Author(s). Distributed under a CC BY-NC-SA 4.0.
The PL spectra of BC films measured under excitation at λex = 473 nm are shown in Figure 9b, c. The spectrum of the bleached BC film (curve N3 in Figure 9b) is typical for cellulose-based materials described earlier in this paper. Incorporation of the Rhodamine C into BC film leads to domination of the yellow component of the spectra (curves N4 and N5 in Figure 9c; 1, 2 in Figure 9d). From a comparison of these spectra with a spectrum of Rhodamine C (curve N3 in Figure 9d), it is clear that changes in the spectra are related to the contribution of the dye to the overall spectrum of the composite. Therefore, spectra N4, N5 in Figure 9c and spectra 1, 2 in Figure 9d can be considered as superimposed emission from the cellulose matrix and filler—Rhodamine C. It is obvious that the spectrum and visual appearance of the emission of “Rhodamine C”@BC composite films can be varied in a wide range, from white to red light [292].
As it was noted above, the own luminescence of the cellulose-containing materials has limited applicability due to low PL intensity and dependence of PL characteristics on various, sometimes uncontrolled, factors. In order to overcome this drawback, different techniques and methods have been applied. Photo-oxidation is one of the simplest methods applied in order to increase the content of carbonyl, carboxyl, and hydroperoxide groups, or to decrease the degree of polymerization [293]. All these changes have an influence on the luminescent properties of cellulose-based materials. Cheng et al. [294] applied this method for the formation of luminescent patterns on cellulose nanofiber papers (Figure 10a). It was shown that the samples were covert, solvent-resistant, and chemically stable.
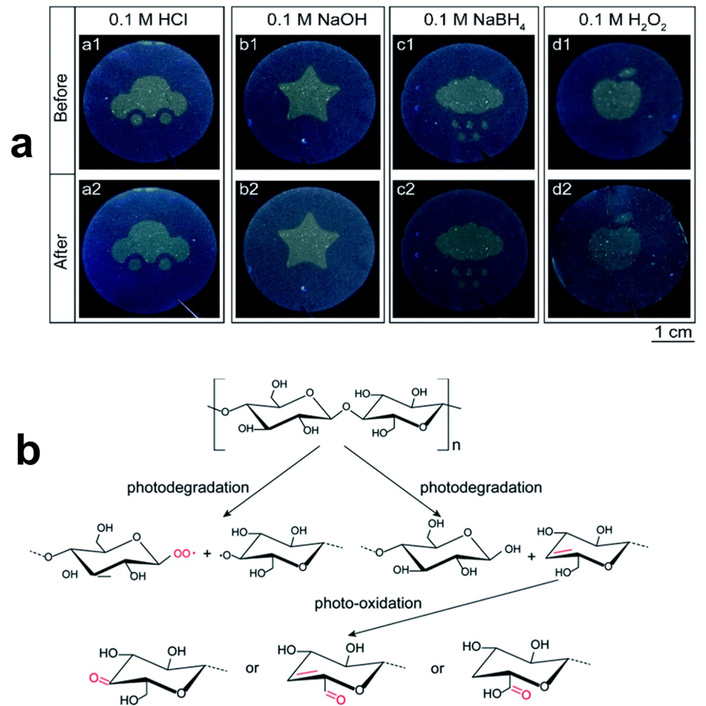
Oxidated cellulose nanofiber papers. (a) Photographs of the cellulose nanofiber paper-based security labels in various solvents: before (top row) and after (bottom row) solvent treatment; (b) scheme of the photochemical formation of fluorescent cellulose nanofiber under UV light irradiation. Adapted from [294]. © 2021 The Author(s). Distributed under a CC-BY 3.0.
It was reported earlier [294] that illumination by UV light leads to a decrease in the intensity of the band of hydroxyl-related vibration in FTIR spectra with a simultaneous increase in the intensity of the band related to stretching vibrations of the C=O groups (at 1,727 cm−1). The high-resolution XPS spectra also indicate that upon UV exposure, the hydroxyl groups were converted to C–O, CO, and O–C=O groups. These results were used to explain the shift of the position of the fluorescence emission maxima of cellulose nanofiber paper from 440 to 490 nm with increasing photo-oxidation time [294]. Since the carboxyl groups are much hydrophilic compared to hydroxyl groups, the increase in content of the former ones under UV light exposure can lead to increased hydrophilicity of the whole cellulose paper.
The scheme of the photochemical reaction describing the formation of the photo-induced fluorescent images on the cellulose nanofiber paper reported in [294] is shown in Figure 10b. The glycosidic bonds between two neighboring glucose units undergo two different degradation reactions during the photolithography, forming a pair of –C–O˙ and C–O–O˙ radicals and a pair of an unsaturated double bond and a hydroxyl group on the glucose units, respectively [295, 296]. These unsaturated bonds may play the role of recombination centers for excitons, resulting in visible luminescence of the cellulose [297] and in the shift of the absorption and emission peaks toward longer wavelengths [298]. The formation of the abovementioned peroxy radicals after UV exposure was confirmed by the increased intensity of the C 1s peak in XPS analysis.
Under sufficiently long action of the UV light on the cellulose, the aldehyde and carboxyl acid groups can be formed [299, 300] as a result of partial oxidation of the (–CH2–OH) hydroxymethyl groups. These aldehyde and carboxyl groups are π-conjugated polar groups and are electron acceptors in nature, so they can trap electrons from the unsaturated bond [297]. Production through UV-induced photolysis of the highly reactive singlet oxygen may lead to oxidation of the unsaturated C=C double bonds. As a result of such oxidation, the irreversible quenching of the fluorescence takes place in cellulose-based materials [301]. This decrease in PL intensity for the case of degraded cellulose is in accordance with literature data on luminescence studies of photo-oxidized cellulose materials [294].
From the viewpoint of application in luminescent labeling, the stability of cellulose fluorescence under the action of extreme conditions, e.g., acidity/alkalinity, reducibility/oxidability, and non-polar solvents. In the case of fluorescent paper described above, the pattern can be seen by the naked eye despite the quite low PL intensity of green emission under PL excitation by UV light. The unprocessed area, where photo-oxidation did not occur, retains its original optical/luminescence properties. So, photo-oxidation of cellulose can be used for labeling objects with pre-defined luminescent patterns [294].
To target optoelectronic applications, some luminescent additives, e.g., molecules, metal-organic complexes, dyes, luminescent particles, etc., can be embedded in the matrix of cellulose or cellulose-based materials to prepare luminescent fibers. Generally, natural polymers were employed as raw materials for the following strategies: (1) incorporating compounds with fluorescent properties into the polymer spinning solution [302]; (2) coating luminescent molecules onto the surface of fiber after its formation through physical interactions [303]; (3) grafting fluorophore molecules onto the polymer fiber through chemical bonding [304]; (4) functionalizing the polymer with luminescent molecules before preparing the spinning solution [305].
It is known that doping and coating require suitable solvents that lead to poor miscibility and weak stability of the material obtained. Chemical modification can provide good photostability and low photobleaching. Thus, this method was found to be a better way for the preparation of luminescent fibers. Usually, a chemical modification of cellulose-based 1D fluorescent materials has mainly concentrated on the grafting of luminescent dyes and molecules with aggregation-induced emission (AIE) characteristics, followed by electrospinning techniques [306, 307].
Liu et al. [286] synthesized the BC material for visualization and scaffold engineering. Such cellulose-based luminescent fibers had impressive optical properties. However, incorporation of organic dyes, e.g., fluorescein, with bright colors affects the intrinsic colorlessness of the cellulose matrix. Another problem appeared for fibers prepared by electrospinning, which were stacked disorderly and were not suitable for further processing. Moreover, the requirement of suitable solvents for dissolving AIE groups during the cellulose functionalization process results in increased production costs and imposes significant restrictions on the large-scale production and environmentally sustainable development of cellulose-based fibers.
A more effective way in the production of fluorescent cellulose fibers is using cellulose ester derivatives, such as cellulose triacetate (CTA) [308] or cellulose acetate phthalate (CAP) [309–311] as raw materials. Such photoactive nanocomposites combine the flexibility and optical transparency of the cellulose matrix with the luminescent properties of the functionalizing additives.
The CAP mixtures with cluster complex Cs2Mo6I8(OCOC2F5)6 (abbreviated as MoIP) in the form of transparent, robust films were studied in the recent work [55]. Homogeneous flexible films with 1, 10, 20, and 30 wt.% of MoIP labelled MoIPx@CAP (with x = 1, 10, 20, or 30, respectively), were prepared from mixtures of precursor solutions by a simple solvent casting method. It should be emphasized that such doping concentration in hybrid films, obtained by simple mixing and solvent casting, is already high and demonstrates the potential of weak interactions in the incorporation of inorganic compounds in organic hosts [312, 313]. The incorporation of MoIP into the CAP matrix allows the obtaining of composites with specific absorption and emission properties in the UV and visible spectral regions (Figure 11).
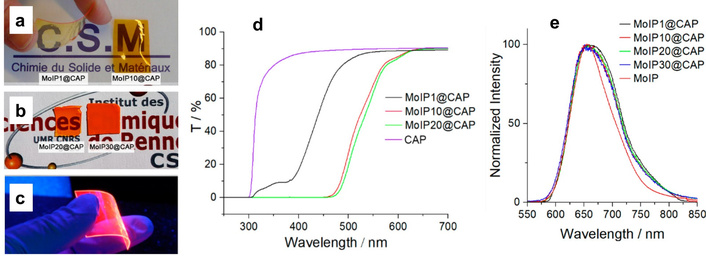
MoIP1@CAP composites and their optical characterisctics. (a) Views of the MoIP1@CAP (left) and MoIP10@CAP (right) under natural light; (b) views of the MoIP20@CAP (left) and MoIP30@CAP (right) under natural light; (c) view of MoIP1@CAP under UV-A light; (d) transmittance spectra, and (e) PL spectra of the CAP and MoIPx@CAP (with x = 1, 10, 20, or 30, respectively) films. Adapted from [55]. © 2023 by the authors. Distributed under a CC-BY 4.0.
The quantum yield measurements indicate that emission efficiency in MoIPx@CAP hybrid systems can be increased by annealing, which not only improves PL properties but also removes solvent traces and supports better packing of polymer chains. Importantly, the samples remain homogeneous even at 20 wt.% of MoIP in composite [55].
Yao et al. [314] applied carboxyl reactive groups as bridging agents to link covalently Europium (Eu)-based polyoxometalate to the raw fabric. Such an approach allows tight bonding between the polyoxometalates and the polymer matrix. Morphological and microstructural studies confirmed integration of polyoxometalates into the fabric. It was reported that composite fibers demonstrate polyoxometalate emission and typical linear luminescence from Eu3+ ions in the 550–750 nm spectral range in the case of PL excitation at λex = 243 nm.
The use of the cellulose esterification method allows for the improvement of the functionality of cellulose materials. The various types of solutions can be applied for the esterification, namely, tetrabutylammonium fluoride trihydrate (TBAF) in dimethyl sulfoxide (DMSO), DMSO/TBAF·xH2O [315, 316], LiCl/DMAc [317–319], and ionic liquids [320–322]. The application of a low-cost method with low energy and material consumption based on DMSO, 1,8-diazabicyclo[5.4.0] undec-7-ene (DBU), and CO2 was described by Lu et al. [323] and Cao et al. [324] (the scheme of the proposed procedure can be seen in Figure 12a [324]).
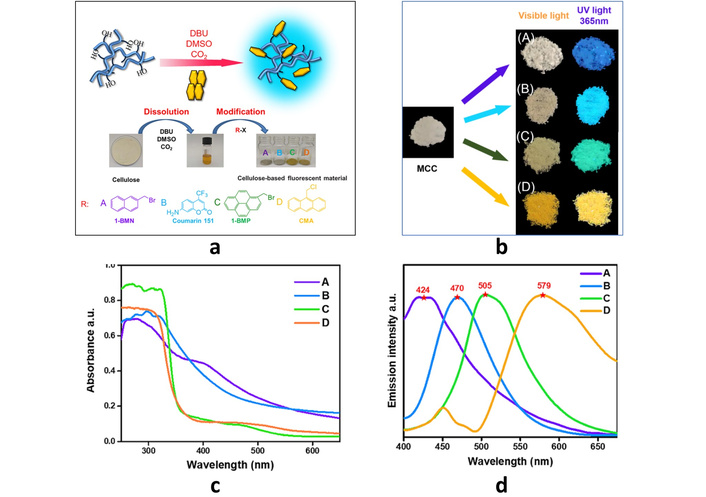
The results of cellulose esterification method application. (a) Scheme of the cellulose-based fluorescent materials synthesis; (b) color of cellulose-based fluorescent materials under visible and UV light exposure; (c) UV-Vis absorption and (d) emission spectra of the cellulose-based materials grafted with 2-(bromomethyl)naphthalene (A), Coumarin 151 (B), 1-(bromomethyl)pyrene (C) and 9-(chloromethyl) anthracene (D); λex = 365 nm. Adapted with permission from [324]. © 2021, The Author(s), under exclusive license to Springer Nature B.V.
Multifunctional fluorescent cellulose materials can be produced in a feasible way by one-pot modification through esterification and carbonation with the use of the DMSO/DBU/CO2 system [323, 324]. Accordingly, four kinds of dual-functionalized cellulose derivatives with rather good fluorescent response are obtained. After blending the synthesized dual-functionalized cellulose derivative with cellulose acetate (CA) as a functional additive in solution, a cast film with an elastic modulus, stress, and strain of 2.2 GPa, 34.1 MPa, and 5.7% is prepared. These studies showed a simple, but effective way to prepare dual-functionalized cellulose derivatives for high-quality applications in the field of pH detection [323, 324]. The developed films exhibit the ability to detect the 12–14 pH value through the change of fluorescent color with an accuracy of about 0.4 (Figure 12).
It is known that abnormal concentration of hydrogen sulfide (H2S) may be an indicator of diseases of the metabolic system, as this gas is one of the most important transmitters in living organisms. Developing a portable assay for H2S has been challenging until now, even though research about its detection is still ongoing. Recently, a novel fluorescent probe, DAC-DPD, based on dialdehyde-cellulose was elaborated by Huang et al. [325]. This probe reveals high selectivity and sensitivity to H2S with colorimetric and fluorescent “turn-on” characteristics. The limit of detection (LOD) of H2S by DAC-DPD is as low as 0.831 μM. The experimental and calculation studies confirmed that a Michael addition reaction is the main sensing mechanism of DAC-DPDs to H2S. Authors of [325] suggest that the prepared DAC-DPD embedded fluorescent membrane can be used as a reliable sensing platform for rapid detection of H2S, in particular in red wine. It provided a convenient and rapid detection material, simplifying the detection process of H2S, which is of great significance for the development of cellulose-based luminescent smart material [325]. The graphical scheme of the DAC-DPD-cellulose system usage for the detection of H2S using luminescent properties can be seen in Figure 13 below.
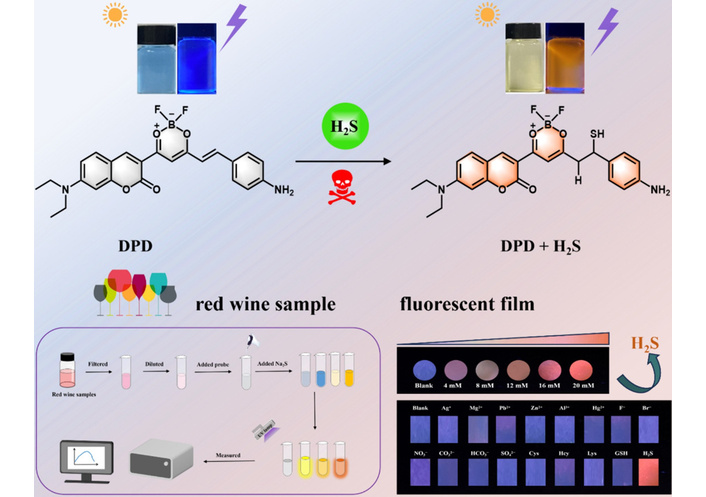
Scheme demonstrating the DAC-DPD-cellulose system opportunity to detect H2S in red wine. Reprinted with permission from [325]. © 2024 Elsevier B.V. All rights are reserved.
Kasaei et al. [326] reported the synthesis and characterization of the functionalized 6-O-[4-(9H-carbazol-9-yl)butyl]-2,3-di-O-methyl cellulose. The PL spectrum of the initial cellulose derivative film consists of sharp peaks with a well-defined vibronic structure, which indicates the weak interaction between carbazole groups. It is worth mentioning that thin films of poly(N-vinylcarbazole) reveal wide bands in their PL spectra [326]. A green strategy for the scalable fabrication of cellulose-based multifunctional fluorescent fibers was presented by Qiu et al. [327]. Specifically, based on the clustering-triggered emission (CTE) mechanism, cellulose acetoacetate (CAA) fluorescent fibers are continuously synthesized for the first time through a lab-scale pilot wet-spinning machine. Subsequent derivatization processes can be implemented in order to improve the PL properties of CAA fibers by suppressing nonradiative transition processes and promoting the radiation transition. The resulting multifunctional fibers exhibit effective antibacterial properties, hydrophobic character (contact angle of 141.9°), excellent UV-blocking performance (UPF being up to 72.04), and bright cyan-blue luminescence (PLQY is about 36.07%).
Importantly, the ordering of cellulose fibers along one direction and the introduction of acetoacetyl groups increased conformational rigidity of the material and also improved intrinsic CTE [327]. Acetoacetyl groups played the role of bridging scaffolds for further bonding of various types of functional molecules onto cellulose chains. A grafting of functional groups on the cellulose chains supports luminescence processes in the fibers, as it was confirmed by theoretical studies. In addition, the UV blocking, hydrophobicity, and other properties of the fibers can be improved through further derivatization. Importantly, some initial properties of cellulose remain almost the same after derivatization, like its color and morphology. The luminescent fibers obtained in such a way can be used in plenty of applications, e.g., functional textiles, flexible display, fluorescent handmade products, etc. [327].
Volatile amine vapors are highly toxic and may cause serious damage to the environment and human health [328, 329]. Therefore, their detection is of great importance. Elaboration of sensors on amines can be done on two known organic fluorophores—fluorescein isothiocyanate and protoporphyrin IX (PpIX). In such a system, the FITC is an indicator, and PpIX is used as an internal reference. The FITC and PpIX can be immobilized covalently onto CA by usage of reactive hydroxyl groups along cellulose chains. In general, due to the planar π-conjugation structures, they suffered from serious aggregation-caused fluorescence quenching (ACQ) phenomenon [330]. By blending green-emitting CA-FITC with red-emitting CA-PpIX with varying ratios, it is possible to obtain a series of solid fluorescent materials with dual-emission properties (Figure 14). Such materials are characterized by a linear response to ammonia in a wide range of 5.0 ppm to 2.5 × 10⁴ ppm, and also provide a color-responsive, rapid, and sensitive tool for amine detection.
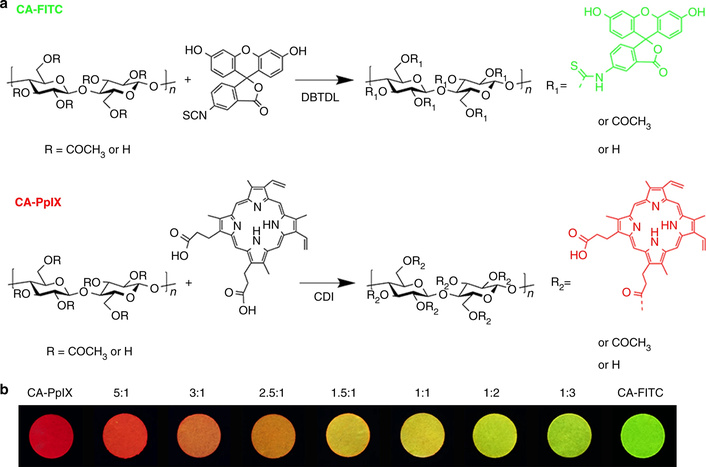
Preparation of cellulose-based ratiometric fluorescent materials. (a) Synthetic routes of CA-FITC and CA-PpIX. (b) Cellulose-based dual-emission solid fluorescent materials with different mix ratio of CA-PpIX to CA-FITC (w/w), respectively, under 365 nm UV light. Reprinted from [328]. © The Author(s) 2019. Distributed under a CC-BY 4.0.
Cellulose derivatives are characterized by good solubility and processability, so the abovementioned fluorophore@cellulose materials can be obtained in various forms, like inks for 2D and 3D printing, flexible film, and membranes. The nanofibrous membranes obtained by the electrospun technique were successfully employed as a low-cost, high-contrast, quick-responsive fluorescent trademark for visual monitoring of the freshness of various foods, particularly, of the shrimp and crabs [328].
A novel approach for a dual-mode colorimetric and ratiometric fluorescent sensing based on cellulose for detecting amines has been developed by Li et al. [329]. The sensor was made of a “positive response” indicator based on perylene tetracarboxylic acid (PTCA) and a “negative response” indicator that consists of luminol, 4,4′-methylene diphenyl diisocyanate, and cellulose acetate (Lum-MDI-CA). The blue luminescence of the “negative response” indicator quenches upon contact with amines. It was assumed that quenching takes place because of intramolecular charge transfer (ICT) in Lum-MDI-CA, where luminol molecules are attached to cellulose chains [329]. Combining positive and negative response indicators, the dual emission sensor was elaborated with the possibility to detect and classify various amines. The color of emission from such a sensor can be adjusted by incorporation of ammonia (NH3), benzylamine, diethylamine, morpholine, or triethylamine. Similarly to the sensor described above, based on FITC and PpIX fluorophores, the Lum-MDI-CA-PTCA system can also be obtained in different forms, e.g., fibers or films [329].
An important and, at the same time, interesting way of the luminescent labeling of cellulose materials is their multi-color hue. Corresponding materials were called “chameleon-like,” and the method of their production was described in the literature [279]. Such materials are able to change their appearance under the action of various factors, and are in demand for various applications. The approach to developing such materials is based on the phenomenon of resonant excitation energy transfer (RTEE). In particular, the trichrome (blue, green, red) luminescent material was made by mixing three separately manufactured components [279]. The components were obtained by covalent bonding of spiropyran, fluorescein, and pyrene onto cellulose chains. The chameleon-like mechanism was provided by dynamic tunneling RTEE from donors (blue and green) to acceptors (red). As a result, after irradiation, such a hybrid material changed the color of its luminescence over time.
There are a lot of papers devoted to the luminescence study of cellulose materials incorporated with inorganic particles, in particular oxide ones [30, 331–336]. Inorganic compounds in the noted studies were used for modifications of cellulose fibers’ properties, for identification of textile products and paper documents, for management and control of production, etc.
It is appropriate to start consideration of luminescent labeling of cellulosic materials with inorganic particles from the case of so-called heterodesmic compounds. The crystal lattice of such compounds consists of cationic and anionic sublattices with ionic interactions between them. The sites in the cationic sublattice are occupied by simple cations—ions of alkali or alkaline-earth metals, transition elements, etc. In contrast, the sites of the anionic sublattice contain molecular groups (anions), in which constituents are connected by strong covalent interactions.
The nitrites of alkali metals [M+-(NO2)–] and silver nitrate [Ag+-(NO3)–] are typical examples of heterodesmic compounds. A high level of nitrites/nitrates in living organisms may cause cancer, e.g., by cancerization of hemoglobin. Thus, it is important to have a simple method for the determination of the hazardous inorganic nitrites and nitrates in water and soil, namely in the form of traces of monovalent alkali metals (MNO2, MNO3; M = Na, K, Rb, Cs; etc.) [30, 337–339]. Such methods can be elaborated on the basis of the optical properties of nitrites, as it is known that these compounds reveal PL with a series of narrow lines in PL spectra. This PL peculiarity is very attractive for the sensing of nitrites in different materials, particularly in cellulose-based ones [338–340].
As an example of luminescent determination of nitrites/nitrates in solutions, the following procedure is worth noting. Solid composite samples, with MCC matrix incorporated with nitrite or nitrate (MNO2 or AgNO3) fillers, were prepared from solutions of the oxides and MCC mixed in distilled water, and their luminescence properties were reported earlier [248, 340]. Measured PL spectra of the composite samples with NaNO2 filler (MCC-W-NaNO2) at room temperature are similar to the PL spectra of “pure” MCC (Figure 15, curves 1 and 2). High concentrations of the CsNO3 and AgNO3 (22.8 g/L) fillers lead to noticeable deformation of the spectral profiles of PL bands. This result indicates a different effect of the nitrate/nitrite particles on the centers of intrinsic luminescence of cellulose [248, 340].

Luminescence behavior of the MCC-W-Oxide samples. (a) The PL spectra of the MCC-W-Oxide samples prepared from the water solutions containing 0.6 (1), 1.1 (2, 6), and 5 × 10⁻³ g/L (5) NaNO2; 28.8 g/L CsNO3 (3), and 22.8 g/L AgNO3 (4) at 300 K (1–4) and 77 K temperatures (5, 6); λexc = 405 nm. (b) The dependences of the PL intensity of the host (1) and NaNO2 inclusions (2) in the MCC-W-NaNO2 samples on the NaNO2 concentration (in g/L), λexc = 405 nm [341]. Adapted with permission from [341]. © The Author(s). This work is licensed under a Creative Commons Attribution-NonCommercial-NoDerivatives 4.0 International License.
The details of PL fine structure become clearly distinguished in the MCC-W-NaNO2 spectra, at the low temperature of the sample, e.g., at 77 K (Figure 15, curves 5 and 6). It is known that the luminescence of MNO2 metal nitrites is related to radiation transitions 1B1→1A from the excited singlet 1B1 level to the ground 1A1 level. The bands of this PL are located in the ~370–550 nm range. Thus, observed fine-structured details correspond to so-called zero-phonon lines (ZPL) accompanied by prolonged phonon wings [339, 341–344].
In order to improve the lowest concentration limit of the sodium nitrite determination in the water solutions, the MCC-W-NaNO2 samples were cooled to 77 K. Then, the total intensity of the NaNO2 luminescence has been determined as a part of the MCC-W-NaNO2 spectrum located above the dashed lines (e.g., near curves 5 and 6 in Figure 15a).
The dependence of the evaluated PL intensity on the NaNO2 concentration is shown in Figure 15b (curve 2). As a result, it was found that the lowest concentration, available for determination, of the NaNO2 trace in water solution is near 3.5 × 10⁻³ g/L. This is quite a good result compared with known data obtained even with more complex chemical methods [345].
The compounds containing the rare-earth ions [302, 303, 305, 346], semiconductor nanoparticles like CdSe/ZnS [347–349], CuInS2 [350], or ZnO [351] are examples of some other inorganic particles incorporated into cellulose or cellulose derivatives matrices as luminescent markers. It is worth noting that hybrid films, obtained by mixing and casting of suspensions, have a high concentration of dopants with the possibility to study the role of weak interactions in the incorporation of inorganic particles into organic matrices [55, 312, 313].
Doped with RE ions, ZrO2 (zirconia) is of large interest due to its specific luminescent characteristics [352]. The stabilized with 7 mol% of Y2O3 zirconia (denoted as 7YSZ), and doped with 0.5 mol% Eu3+ ions ZrO2:Y fillers (modifiers) were used as a luminescent marker of cellulose fibers in the earlier study [333]. The data on PL properties of raw components are in accordance with the literature data, while the characteristics of the composite system differ noticeably (Figure 16).
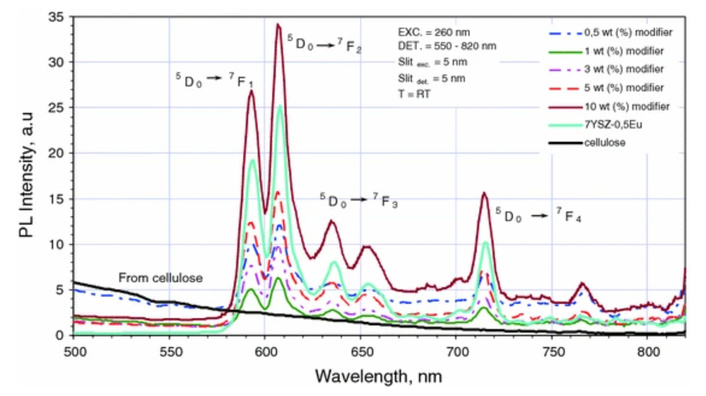
Photoluminescence spectra of pure cellulose fibers, cellulose fibers with 7YSZ-0.5Eu, and reference powder, λex = 260 nm, room temperature. Reprinted from [333]. © The Author(s) 2012. Distributed under a CC-BY 2.0.
The PL spectra of the cellulose fibers incorporated with ZrO2:Y,Eu reveal several narrow PL bands ascribed to the 5D0→7Fj electronic transitions within Eu3+ ions. Regarding the data shown in Figure 16, it can be seen that the intensity of the own luminescence of cellulose is negligible. The emission intensity of the modified fibers is highly dependent on the ZrO2:Y,Eu concentration, and on the energy of photons of PL excitation. The data reported by Kulpinski et al. [333] allow us to conclude that oxide particles are unevenly distributed within the cellulose matrix. Moreover, an increase in the concentration of filler leads to agglomeration of particles as well as the appearance of large particles on the surface of the fibers.
The fluoride/oxyfluoride-based phosphors, e.g., CeF3:Tb3+ or Gd4O3F6:Eu3+, were used as markers as they are promising for wide commercial applications due to their known intensive luminescence, high thermal and chemical stability [331, 334]. The luminescence spectra of cellulose incorporated with Gd4O3F6:Eu3+ nanopowder consist of intensive narrow bands ascribed to intrashelf f-f electronic transitions in the Eu3+ ions [334].
Doped with 15% of Tb3+ ions, CeF3 was found to be the most promising system as a modifier for cellulose fibers due to the suitable morphology of this material. The structure and morphology of the modified fibers are similar to those of fibers made by the same dry-wet spinning method but without a modifier. The thickness of the obtained cellulose fibers is less than several microns. Due to the small size of the fluoride nanoparticles, they are easily incorporated into the fibers during their synthesis. It was reported that incorporation of CeF3:Tb nanoparticles into fibers does not deteriorate the mechanical properties of the latter [331]. The composite material reveals UV luminescence bands in the 200–300 nm range, which are related to allowed f-d radiation transitions in the Ce3+ ions (Figure 17). The energy could be transferred from the CeF3 host to the Tb3+ ions, resulting in a strong green emission.
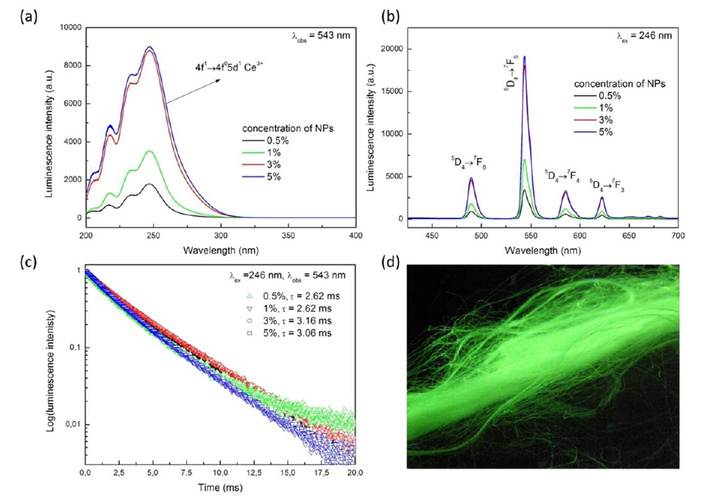
Luminescence of cellulose incorporated with crystalline oxide particles. Luminescent properties of cellulose fibers doped with Ce0.85Tb0.15F3 nanocrystals: (a) excitation spectra, (b) emission spectra, (c) luminescence decays, and (d) luminescence of fibers under UV irradiation (λexc = 254 nm). Reprinted with permission from [331]. © 2014 Society of Plastics Engineers.
The potential application of the elaborated luminescent fibers includes optical markers for anti-counterfeit protection of documents, textiles, and other products. The incorporated inorganic phosphors are extremely stable and cannot be completely removed from cellulose materials under simple treatment procedures [331–333, 335].
As it was noted in the Introduction, cellulose consists of crystalline and amorphous parts. It can be expected that the ratio between these parts, the so-called degree of crystallinity, should determine optical, in particular, luminescence properties of cellulose-based materials. It was an important task to analyze the properties of cellulose with a high crystallinity degree, that is, MCC.
It was reported earlier that composites Oxide@MCC can be prepared with so-called “dry” and “wet” procedures. Several oxide compounds have been used as luminescent fillers of the MCC matrix for luminescent marking. Chemically pure MCC [manufactured by ANCYR-B (Ukraine)], ground into fine powder, was used as starting cellulose.
Under the “dry” procedure, a weighted amount of previously synthesized and thermally treated micro/nanosized powder of specific oxide was added to the prepared portion of dispersed MCC. After the prepared mixture was dissolved in high-purity ethanol and subjected to ultrasonic treatment at a frequency f = 4.2 kHz for 20 min. The suspension stood for 30 min, and the precipitate was filtered via a paper filter. After that, the powder was dried at ambient air conditions and temperature T = 60°C. Then, the prepared powders were compressed into discs at a pressure of 1.8 × 10⁷ Pa.
During the “wet” procedure, the ground MCC powder and micro/nanosized powder of specific oxide were dissolved in distilled water. The obtained suspensions of MCC in water and oxide in water were mixed together in a magnetic stirrer for 30 min. Then, the mixture was left for 30 min, filtered, and the precipitate obtained was dried at T = 60°C for 24 hours. Dried powders were pressed into discs under the same conditions as for the case of the “dry” procedure.
The “dry” procedure was used, particularly, for the preparation of Oxide@MCC composites with ZrO2:Eu,F oxide nanocrystals. It was found earlier that doping of ZrO2:Eu with fluorine significantly increased the intensity of Eu3+ luminescence [353]. Obviously, this peculiarity should have contributed to the increased efficiency of using europium-doped zirconium for luminescent marking of cellulose. The data below can be easily compared to those described above for micro-fibrillated cellulose incorporated with ZrO2:Y,Eu particles.
The set of prepared samples includes a commercial MCC tablet (marked as MCC) without ZrO2:Eu,F marked as C0, and samples denoted as CZr(c)—are the composites where (c) is a notation of oxide concentration of 0.4, 1.1, 4.3, and 10 wt.%. It was found that pure MCC and C0 samples consist of many tightly packed plates of 2–20 μm size. There are crannies and pores between the plates, and there is a certain number of craters/caverns within the plates. Some fibrils of those samples are organized into wave-like structures. The sizes of the particles are within the 20–100 nm range. The agglomerates of such particles form large grains up to 2 m in size [353].
The PL spectra of raw materials and corresponding composites are shown in Figure 18. In the case of the initial cellulose, C0 sample, the wide complex band with maxima at 480 nm can be seen. This PL band consists of at least three PL components with peak positions near 430, 465, and 580 nm. As it was mentioned earlier, the multicomponent structure of the PL bands is usually related to several types of organic chromophores inherent to the cellulose matrix. It is seen that increasing the oxide content leads to changes in the shape of the wideband emission spectra of the composites (Figure 18a). This result indicates a difference in interaction between oxide particles and various cellulose constituents [353].
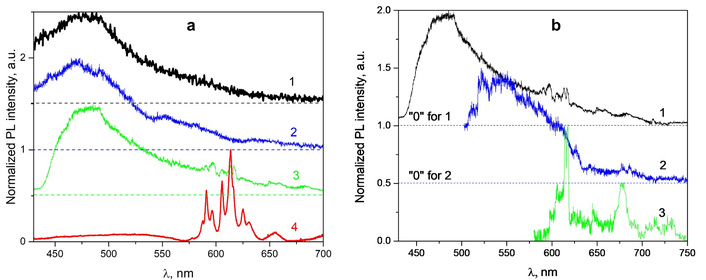
Cellulose incorporated with ZrO2:F,Eu particles. (a) PL spectra of C0 (1), CZr(0.4) (2), CZr(10) (3), and ZrO2:F,Eu (4), measured under excitation at λex = 393 nm; T = 300 K. (b) PL spectra of CZr(10) sample measured at 393 (1), 473 (2) and 532 nm (3). Adapted with permission from [353]. © 2020, IEEE.
The set of narrow lines in the PL spectra is related to 5D0→7FJ (J = 0–4) radiative electronic transitions in Eu3+ ions. Thus, an increase in oxide content leads to an increased intensity of this linear luminescence (Figure 18a, curve 3). A reliable observation of this emission can be done only at oxide content above 4 wt.% [353]. However, the registration of Eu3+-related emission can be done even for lower oxide concentrations in the composite for the case of PL excitations at longer wavelengths, where cellulose chromophores have lesser efficiency of excitation, e.g., at λex = 532 nm (Figure 18b, curve 3).
Complex oxide compounds can also be used as luminescent markers/fillers of cellulose materials. As examples of such oxides, the doped with samarium (III) or europium (III) ions (Sm3+ or Eu3+) lanthanum orthovanadate (LaVO4:Sm and LaVO4:Eu), and potassium europium phosphate-molybdate, K2Eu(PO4)(MoO4), will be discussed below.
Composites with the abovementioned complex oxides were prepared by the “dry” procedure. These oxides used could be synthesized by various procedures: solid state reaction, co-precipitation, and sol-gel [354–356]. In the cases of LaVO4:Sm and LaVO4:Eu, it was found that the average sizes of the crystalline particles were in the 1–2, 0.2–0.5 μm, and 100–200 nm range under solid-state, co-precipitation, and sol-gel synthesis of oxides, respectively. Intensity of luminescence of the sol-gel samples was usually near of 3 times higher than for the oxides made by co-precipitation and about 10 times higher than for the samples made by solid state synthesis [354]. Below we denote the samples on the weight of oxide in composites (in wt.%) together with formulae of corresponding oxide, e.g., 0.2-K2Eu(PO4)(MoO4) means 0.2 wt.% of oxide in Oxide@MCC composite.
PL of the composites can be effectively excited in the wide spectral range from UV to yellow light: 250–570 nm. The PL spectra consist of a wide band covering the 350–750 nm spectral region (Figure 19a). Besides, the sets of relatively narrow lines related to radiative transitions in Sm3+ and Eu3+ ions can be seen. The composition of the samples and wavelength of excitation light have a great impact on the relative intensities of both wide-band and narrow lines emission.
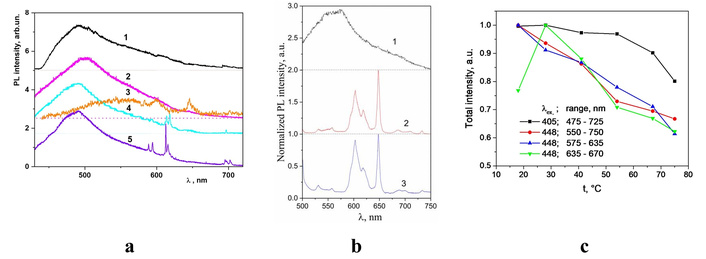
Cellulose incorporated with complex oxide luminescent particles. (a) PL spectra of MCC (1) and 2.2-La0.7Sm0.3VO4 (2), 18.2-La0.7Sm0.3VO4 (3), 2.2-La0.7Eu0.3VO4 (4), and 2.2-K2Eu(PO4)(MoO4) (5) composites; λex = 405 nm, T = 300 K. (b) Room-temperature PL spectra of the KBi0.99Pr0.01(MoO4)2@MCC composite (1, 2) and KBi0.99Pr0.01(MoO4)2 crystals (3); λex = 405 (1) and 473 nm (2, 3). (c) Dependencies of the total intensities on temperature. (a) reproduced with permission. © 2018 Springer International Publishing AG, part of Springer Nature. The figure was redrawn based on the original data from [27], and contains no unpublished data. (b) and (c) adapted with permission from [357]. © 2022, IEEE.
As the oxide amount is higher, the intensity of the narrow lines significantly increases (see curves 2 and 3, Figure 19a). No doubt, narrow lines in the PL spectra are related to absorption and radiation transitions in the fn-shells of Sm3+ or Eu3+ ions and O2–→RE3+ charge transfer transitions in the oxide component of the composites. In fact, the positions of these groups of lines, their shapes, and their intensity coincide with excitation and luminescence data for corresponding “free” powder oxides [358].
As for the samples with oxides containing Eu3+ ions, a comparison of described emission spectra with corresponding spectra of the free K2Eu(MoO4)(PO4) or La1-xEuxVO4 powders showed that the observed emission lines correspond to the 5D0→7FJ (J = 1–4) radiation transitions in the inner f-f electronic shells of the Eu3+ ions which are in the composition of oxide compounds [354, 355].
In the case of La0.7Sm0.3VO4 samples, it is clear that the narrow PL lines are related to f-f transitions in the electronic shell of the Sm3+ ions. The positions of these lines, their shapes, and distribution of their intensity coincide with absorption and emission lines of the Sm3+ ions in various crystalline [354, 355, 359], glass-like hosts [360], and liquids [361]. So, it can be stated that the observed PL groups of lines are due to radiation transitions from the excited 4G5/2 level to the lowest levels of the ground 6H state (i.e., 4G5/2→6H9/2, 6H7/2, 6H5/2).
Changes in the shape and decrease in PL intensity of the MCC host, when the content of the oxide increases, can be related to the influence of the oxide particles on the morphology and dynamics of various cellulose molecular groups. It is worth noting that the distributions of intensity of the Sm3+ and Eu3+ ions’ PL lines differ from those corresponding to “free” oxide powders. It is known that these RE3+ ions are located in the volume and on the surface of the used oxide particles [354, 362]. Positions of the lines in the PL and PL excitation spectra of the Sm3+ and Eu3+ ions, for the mentioned “at surface” and “in volume” types of ions, are different. Obviously, “the surface” ions, in the first place, have to be sensitive to the influence of the cellulose surface molecular groups. Thus, interaction between surface molecular groups of cellulose and surface molecular groups of oxide determines peculiarities of luminescence behavior of the Oxide@MCC composite materials [27].
Complex inorganic oxides that contain other rare-earth ions are also attractive for luminescent labeling of cellulose materials. Some of them demonstrate luminescence bands/lines in different spectral regions compared to emission lines of Sm3+ and Eu3+ ions, and this feature may be an important factor for marker selection. In particular, the Tb3+ ions reveal green light emission [154, 363], while Pr3+ ions attract attention due to variations in their emission color (blue↔red) related to the effect of the nearest surrounding on the position of charge-transfer levels [364, 365].
Bismuth-containing compounds have advantages as hosts for RE ions because of the same charge states and similar ionic radii of Bi3+ and RE3+ ions. Thus, they can be easily doped with RE-ions. They are transparent in almost the entire visible spectral range with intensive light absorption bands in ultraviolet and violet regions, which are related to transitions in PO43– and MoO42– groups and Bi3+ ions. In addition, such compounds are stable under the action of humidity, temperature, and high light fluxes, etc. [355, 366].
The “dry” procedure was used to prepare KBi0.99Pr0.01(MoO4)2@MCC composites. The sizes of the used oxide particles were in the range from ~20 nm up to 5 μm. As was mentioned earlier, the oxide particles smaller than 100 nm were incorporated into the cellulose matrix, while larger particles pierced through the cellulose plates. The EDX studies indicate that distributions of potassium, bismuth, molybdenum, and praseodymium are the same over the studied regions of the samples [365]. At the same time, the distribution of carbon, which is a constituent of the cellulose matrix, differs from that of the constituents of the oxide filler. Such a result indicates that the composite sample has some heterogeneity within the depth of the electron beam penetration.
The composite samples reveal quite intense visible PL under the PL excitation in the violet and blue spectral regions. In particular, a wide PL band ranging from 450 to 750 nm is observed at λex = 405 nm (Figure 19b). This PL can be ascribed to the emission of cellulose matrix [247, 250]. PL spectra change their appearance completely when KBi0.99Pr0.01(MoO4)2@MCC composite is excited at λex = 473 nm. This is the result of direct Pr3+ ions excitation occurring under absorption transitions from the ground 3H4 level to the excited 3P1 level of Pr3+ ions. The narrow lines in PL spectra are related to radiation electronic transitions in the Pr3+ ions from the excited 3P1 level. The bands near 530 nm (3P1→3H5 transition) and 684 nm (3P1→3F4 transition) are of low intensity and overlap with emission bands of transitions from the excited 3P0 level. Those intensive bands are located near 545–555 nm (3P0→3H5), 618 nm (3P0→3H6), 648 nm (3P0→3F2), 710 nm (3P0→3F3), and 733 nm (3P0→3F4) (the population of 3P0 level occurs as a result of nonradiative transitions from the higher lying 3P1 level). The most intensive PL band is at 603 nm, and it corresponds to the 1D2→3H4 radiation electronic transition. The population of this 1D2 excited level is caused by radiationless processes, either by cross-relaxation or multiphonon relaxation from higher excited levels [357].
Comparing the PL spectrum of the composite under study (Figure 19b, curve 2) to the spectrum of the KBi0.99Pr0.01(MoO4)2 powder (Figure 19b, curve 3), it can be seen that the ratios of intensities of the lines 603 and 648 nm for these two samples are different. The line at 648 nm corresponds to the so-called hypersensitive 3P0→3F2 transitions, whose characteristics are strongly dependent on the symmetry of the position occupied by Pr3+ ions and their interactions with the neighborhood. So, a higher intensity of this band can be determined by processes on the oxide/cellulose interface, e.g., by the change of rate of the multi-phonon relaxation at the interphase layers.
The temperature behaviour of luminescent characteristics of the cellulose-based materials is important when dealing with luminescent marking. So, PL spectra and PL intensity were studied in the temperature range from 18° to 75°C. The PL intensities were calculated as areas under the spectrum within the various ranges depicted in Figure 19c. The range 475–725 nm at 405 nm excitation corresponds to the PL of the cellulose host. The range 550–750 nm measured at 448 nm excitation corresponds to the PL of the oxide particles. The ranges 575–635 nm and 635–670 nm measured at 448 nm excitation correspond to different radiation transitions in Pr3+ ions. It can be seen that the cellulose-related luminescence (black curve) is more stable with temperature compared to the Pr3+-related luminescence intensity (see other curves in Figure 19c). Noted dependencies of the luminescence properties on temperature indicate a luminescent marking opportunity to manifest the interaction of the cellulose molecules with oxide particles [357].
Optical/luminescent properties of cellulose composites made on microcrystalline and nanocellulose marked with K3Tb(PO4)2 phosphor were described in the paper [195]. It is known that the K3Tb(PO4)2 green PL can be effectively excited in a wide spectral range from vacuum ultraviolet up to visible light [363, 367, 368]. The results were obtained on the samples prepared by “wet” (MCC used) and “dry” procedures (NC used). The K3Tb(PO4)2@NC composite film showed a quite uniform distribution of oxide crystallites located in cellulose environment [195]. In contrast to MCC-based composites described above and elsewhere [369], even micro-sized particles of the oxide used do not cause a significant inhomogeneity of the samples.
The PL spectra of K3Tb(PO4)2@MCC composite are shown in Figure 20. A set of Tb3+-related emission lines is only observed under excitation at 262 nm, while excitation at 300 nm causes simultaneous luminescence of cellulose oxide. Narrow intensive bands on spectra correspond to parity forbidden electronic transitions from the excited 5D4 level to lower energy levels in Tb3+ ions. Wide complex band spreading from 320 to 650 nm is similar to those reported earlier for pure MCC and can be ascribed to various chromophores of a cellulose matrix [30]. The intensity of the band of 5D4→7F3 transition is considerably weaker in the composite than in the initial phosphor. This observation may be considered as the influence of the MCC matrix on the oxide filler.
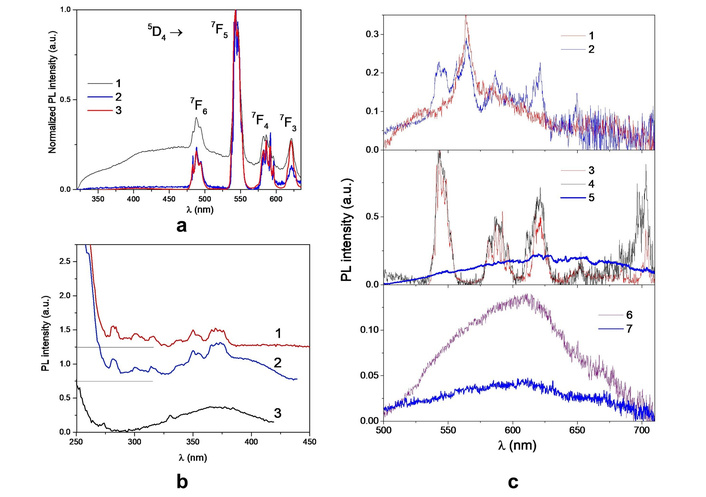
Luminescent properties of the K3Tb(PO4)2@MCC composite. (a) Normalized PL spectra of K3Tb(PO4)2@MCC composite (1, 2) and K3Tb(PO4)2 phosphor (3) excited at λex = 300 nm (1) and 262 nm (2, 3), T = 295 K; (b) PL excitation spectra of K3Tb(PO4)2@MCC composite registered at λem = 587 nm (1), 489 nm (2) and 450 nm (3), T = 295 K; (c) PL emission spectra of NC suspension (1), “NC+K3Tb(PO4)2” suspension (2), K3Tb(PO4)2 powders (3), K3Tb(PO4)2@NC composite film (4, 5) and NC films (6, 7) measured at λex = 473 nm (1–3, 5, 7), 386 nm (4) and 405 nm (6), T = 295 K. Adapted with permission from [195]. © 2023, IEEE.
The PL excitation of Tb3+ ions can be done in a wide spectral range, including a region where the own luminescence of cellulose can be excited. Therefore, by appropriate selection of excitation conditions, it is possible to obtain optimal, from the viewpoint of spectral characteristics, luminescent labeling and visualizing of cellulose materials incorporated with Tb-containing compounds. Moreover, such cellulose-based materials can be used as luminescent sensors. In particular, the characteristics of cellulose hydrogels incorporated with terbium chloride are prospective sensors for toxic nitrites [370].
PL decay kinetics is the characteristic that significantly widens the applicability of RE ions for luminescent labeling. It is known that most of the RE3+ ions are characterized by PL decay constants in the range from a few microseconds up to several milliseconds. However, these ions in the 2+ charged state can have a much longer PL decay time, up to seconds and even more. Crystalline materials with long PL decay times are known as long-lasting or persistent phosphors. The behaviour of their PL decay kinetics is determined by the complex character of the excitation and emission processes. The characteristics of the luminescence of well-known long-lasting phosphors of strontium/calcium aluminates doped with Eu2+ ions or co-doped with Eu2+/Dy3+ ions—(Sr/Ca)Al2O4:Eu,Dy (abbreviated as Sr/CAOED) can be observed in detail, e.g., in [371]. The luminescence of SAOED is associated with the capture and release of electrons and holes. There are several possible mechanisms for this capture/release have been discussed: 1) hole released from Eu2+ ion into valence band (VB)→hole captured by Dy3+ ion→hole released by Dy4+ ion→phosphorescence as a result of recombination of holes with Eu1+ ion when the latter is in excited state [372]; 2) electron released by Eu2+ ion into conduction band (CB)→electron captured by Dy3+ ion→thermally-induced release of electron from Dy2+ ion→luminescence as a result of recombination of holes with Eu3+ ion in excited state [373]; 3) luminescence of SAOED is result of photo-oxidation of Eu2+ cations under UV irradiation, and traps for electrons are relatd with oxygen vacancies, located nearly to photo-generated Eu3+ ions [374]; 4) the model that combines aforementioned models 2 and 3 [375], etc. However, many of the experimental results about luminescence behaviour of the (Sr/Ca)Al2O4:Eu,Dy phosphors are still not completely understood. There are also some contradictions between the proposed models and the details of the luminescence of these compounds [376–379].
There are several studies on the application of the inorganic compounds with long-lasting luminescence, in particular, the above-noted (Sr/Ca)Al2O4:Eu,Dy phosphors, as the luminescent labels for cellulose-based materials. The latter are the cotton fibers [380], CA nanofibrous films [381], regenerated cellulose fibers [382], and nanofibrillated cellulose films [383]. These materials were proposed for use as anti-counterfeiting materials, luminous flexible equipment, interior decoration, night indication, and portable logos or labels.
The papers [384, 385] report on luminescence and dielectric properties of cellulose paper marked with SrAl2O4:Eu,Dy phosphor. A bleached sulfate pulp from coniferous wood has been used as a fibrillar matrix for the preparation of paper samples. The final density of dried paper was 100 ± 5 g/m2. The compositions and abbreviations of all samples produced are noted in Table 2 below.
Abbreviation and composition of the cellulose-based paper embedded with SrAl2O4:Eu,Dy phosphor.
| Composition | Sample | |||||||
|---|---|---|---|---|---|---|---|---|
| P0 | PN | PN1 | PN2 | PN3 | PN5 | PN10 | PN30 | |
| Cellulose pulp, g | 1 | 1 | 1 | 1 | 1 | 1 | 1 | 1 |
| NC, mg | 0 | 5 | 5 | 5 | 5 | 5 | 5 | 5 |
| Oxide, mg | 0 | 0 | 10 | 20 | 30 | 50 | 100 | 300 |
| NC, wt.% | 0 | 0.50 | 0.49 | 0.49 | 0.48 | 0.47 | 0.45 | 0.38 |
| Oxide, wt.% | 0 | 0 | 0.99 | 1.95 | 2.90 | 4.74 | 9.05 | 22.99 |
Adapted from [385]. © 2025 The Author(s). Distributed under a CC-BY 4.0.
A general view of the composite paper strips under daylight illumination can be seen in Figure 21a. After the composite paper samples were illuminated by day or UV light, an intensive, long-lasting luminescence was observed (Figure 21b) [385].
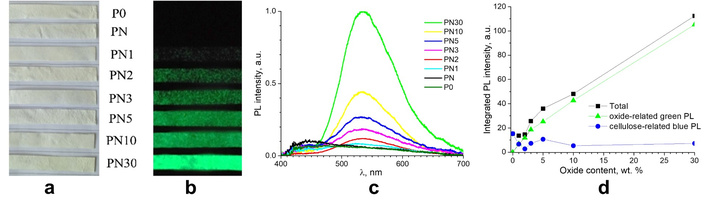
Cellulose paper incorporated with SrAl2O4:Eu,Dy phosphor. (a) Photos of the strip samples taken under daylight illumination and (b) after 10 min of daylight exposure taken in a dark room; (c) the PL spectra measured under excitation at λex = 365 nm; (d) dependencies of integrated PL intensities on oxide concentrations; T = 290 K. Adapted from [385]. © 2025 The Author(s). Distributed under a CC-BY 4.0.
The PL spectra of the studied paper samples are shown in Figure 21c. The PL spectra of undoped papers P0 and P1 consist of an asymmetric, well-known complex band with an overall maximum in the blue spectral region near 450 nm. The luminescence of these samples is long-lasting, thus it can be registered for many hours after the photoexcitation has been turned off for a long time. Significant changes in the luminescence of the papers were observed for the samples embedded with oxide filler (Figure 21c, curves PN1–PN30). Figure 21d shows that the changes noted are related to an increase in oxide PL contribution to the total PL spectrum.
Color characteristics of the composite papers, which are chromaticity (x, y) and (u', v') coordinates according to CIE 1931 and CIE 1976 standards; correlated color temperature (CCT) and color purity (CP) were described in [385]. The obtained CCT values correspond to the "cold" radiation (T > 4,500 K). Low CP values are associated with the spread of the PL band over the entire visible light range. This result indicates that the studied materials could not be applicable where high color rendering is necessary (e.g., displays), but they can be used as components of low-power lighting devices. The observed non-monotonous behaviors of CCT and CP can be related to the reabsorption of cellulose emission by oxide and vice versa.
This review considers methods of luminescent marking/labeling of cellulose in its various forms, such as fibrillated, microfibrillated, microcrystalline, nanoscale, bacterial cellulose, etc.; cellulose derivatives such as hydroxypropylcellulose, and various composite cellulose materials.
Despite the fact that cellulose-containing materials are widely used in production, science and technology, their luminescent marking is not very common.
Given this, this work thoroughly presents various types of luminescent markers used in biomedicine, pharmacology, agrotechnology, etc. Among them, there are metal-organic complexes, dyes, quantum dots, inorganic particles, etc.
The characteristics of the own/intrinsic luminescence of cellulose and its derivatives are also considered. It has been shown that the characteristics of self-luminescence are sensitive to the influence of water, alkali metal cations, etc., which allows to speak about luminescent self-labeling of cellulose materials.
Specific examples of the application of such types of marking to cellulose materials are described with the use of the results obtained in various laboratories, including many of the results obtained by the authors of this paper.
Although current research has demonstrated the extensive potential of cellulose self-labeling and luminescent materials, there are still challenges in achieving high stability, adjustable performance, and biocompatibility of the labeling agents.
The data presented in the work emphasize the possibilities of luminescent labeling and will be useful to researchers working in the field of new cellulose materials applications, particularly biomedical ones. Future research should be focused on improving luminescence performance, optimizing the stability of composite labeling systems, and expanding their applications in biomedicine, agriculture, etc.
AIE: aggregation-induced emission
BC: bacterial cellulose
CA: cellulose acetate
CAA: cellulose acetoacetate
CAP: cellulose acetate phthalate
CCT: correlated color temperature
CMC: carboxy methyl cellulose
CNCs: cellulose nanocrystals
CNFs: cellulose nanofibrils
CNMs: cellulose nanomaterials
CP: color purity
CQDs: carbon quantum dots
CTE: clustering-triggered emission
DBU: 1,8-diazabicyclo[5.4.0] undec-7-ene
DMSO: dimethyl sulfoxide
FITC: fluorescein-5-isothiocyanate
FLC: fluorescein-labeled cellulose
FWHM: full width at half maxima
GFP: green fluorescent protein
HPC: hydroxypropyl cellulose
HPMC: hydroxylpropylmethyl cellulose
IoT: Internet of Things
LCST: Lower Critical Solution Temperature
Lum-MDI-CA: luminol, 4,4′-methylene diphenyl diisocyanate, and cellulose acetate
MC: metal-ligand complexes
MCC: microcrystalline cellulose
MFC: microfibrillated cellulose
MOFs: metal-organic frameworks
NaCMC: sodium carboxymethyl cellulose
NC: nanocrystalline/nanosized cellulose
PL: photoluminescence
PpIX: protoporphyrin IX
PQDs: perovskite quantum dots
PTCA: perylene tetracarboxylic acid
RTEE: resonant excitation energy transfer
SQDs: semiconductor quantum dots
TBAF: tetrabutylammonium fluoride trihydrate
TO: thiazole orange
YO: oxazole yellow
The authors express their gratitude to Dr. of Science Valerii Barbash and Ph.D Olga Yashchenko (National Technical University of Ukraine “Igor Sikorsky Kyiv Polytechnic Institute”, Kyiv, Ukraine) for the nanocellulose suspension produced and samples based on it (which are discussed in the sections Self-labeling of luminescent cellulose materials, Luminescent markers for cellulosic materials); to Dr. of Science Kateryna Terebilenko and Ph.D. Tetiana Voitenko (Taras Shevchenko National University of Kyiv, Ukraine) for the luminescent micro/nanosized crystalline powders provided by them for luminescent labeling of cellulose materials addressed in this review.
Serhii Nedilko thanks the Polish Academy of Sciences for the possibility of the research stay and spectroscopy measurements at the Institute of Physics PAS (Warsaw, Poland), opportunities that facilitated the work discussed in this review, during this difficult time for Ukraine.
VB: Conceptualization, Writing—review & editing. VC: Conceptualization, Writing—review & editing. SN: Conceptualization, Writing—original draft. All authors read and approved the final version of the manuscript.
The authors declare that they have no conflicts of interest.
Not applicable.
Not applicable.
Not applicable.
Not applicable.
Not applicable.
© The Author(s) 2025.
Open Exploration maintains a neutral stance on jurisdictional claims in published institutional affiliations and maps. All opinions expressed in this article are the personal views of the author(s) and do not represent the stance of the editorial team or the publisher.
Copyright: © The Author(s) 2025. This is an Open Access article licensed under a Creative Commons Attribution 4.0 International License (https://creativecommons.org/licenses/by/4.0/), which permits unrestricted use, sharing, adaptation, distribution and reproduction in any medium or format, for any purpose, even commercially, as long as you give appropriate credit to the original author(s) and the source, provide a link to the Creative Commons license, and indicate if changes were made.

Aylin Kara Özenler ... Funda Tihminlioglu
Damla Arslantunali Sahin ... Vasif Hasirci
Momoko Ebisawa ... Yutaka Inoue
Athira S. Dev ... Renu Mohan
Andrew Linz ... Yannick J Bomble
