Original Article

Affiliation:
1Department of Organismal Biology, Uppsala University, S-756 32 Uppsala, Sweden
ORCID: https://orcid.org/0000-0001-5442-2303
Affiliation:
3Department of Public Health and Caring Sciences, Uppsala University, S-752 37 Uppsala, Sweden
ORCID: https://orcid.org/0000-0003-2363-0593
Affiliation:
1Department of Organismal Biology, Uppsala University, S-756 32 Uppsala, Sweden
ORCID: https://orcid.org/0000-0002-5248-505X
Affiliation:
3Department of Public Health and Caring Sciences, Uppsala University, S-752 37 Uppsala, Sweden
4Krembil Brain Institute, University Health Network, Toronto, ON M5T 2S8, Canada
5Department of Medicine and Tanz Centre for Research in Neurodegenerative Diseases, University of Toronto, Toronto, ON M5S 1A8, Canada
ORCID: https://orcid.org/0000-0001-5466-8370
Affiliation:
1Department of Organismal Biology, Uppsala University, S-756 32 Uppsala, Sweden
Email: asa.mackenzie@ebc.uu.se
ORCID: https://orcid.org/0000-0002-8713-070X
Explor Neuroprot Ther. 2023;3:299–327 DOI: https://doi.org/10.37349/ent.2023.00053
Received: May 17, 2023 Accepted: July 29, 2023 Published: October 30, 2023
Academic Editor: Abdelhamid Benazzouz, Bordeaux University, France
Aim: Parkinson’s disease (PD) is characterized by degeneration of midbrain dopamine neurons and synucleinopathy [aggregated alpha-synuclein protein (αSyn)]. The correlation between αSyn pathology and dopamine neuron degeneration remains to be fully established. Mouse models of PD are commonly used to increase knowledge of disease mechanisms. Lately, midbrain dopamine neurons have gained attention as more heterogeneous than previously recognized. With the aim to determine how the midbrain dopamine system in mice is affected in the presence of αSyn pathology, this brain system was studied in two transgenic mouse models of synucleinopathy.
Methods: Brain sections from two previously described transgenic mouse lines verified for αSyn pathology through expression of the human αSyn gene (SNCA) under control of the Thy-1 promoter [Thy1-h[A30P]αSyn and Thy1-h[wt]αSyn (L61)], were analyzed using fluorescent in situ hybridization (FISH) and compared with matching sections from wild-type control mice. Probes directed towards mouse and human αSyn mRNA, and a battery of probes towards mRNAs representative of dopamine cell identity and heterogeneity, were implemented.
Results: First, validation of αSyn-encoding mRNA was performed. Ample ectopic αSyn mRNA was observed throughout the brain of mice of each transgenic line. Next, midbrain dopamine neurons located in substantia nigra pars compacta (SNc) and ventral tegmental area (VTA) were analyzed using a battery of general and subpopulation-specific dopamine cell markers. This included tyrosine hydroxylase (Th), vesicular monoamine transporter 2 (Vmat2), dopamine transporter (Dat), aldehyde dehydrogenase 1 family member A1 (Aldh1a1), G-protein-activated inward-rectifying potassium channel type 2 (Girk2), calbindin 1 (Calb1), Calb2, gastrin-releasing peptide (Grp), and vesicular glutamate transporter 2 (Vglut2) mRNAs. No difference between transgenic and control mice was observed for any analyzed marker in either the Thy1-h[A30P]αSyn or Thy1-h[wt]αSyn transgenic mouse line.
Conclusions: This study demonstrates remarkable robustness of midbrain dopamine cell integrity in the presence of brain-wide ectopic human αSyn in two transgenic mouse models of neurodegenerative disease, motivating further study into mechanisms correlating synucleinopathy with dopamine neuron degeneration in rodent models relevant to PD.
Accumulation of misfolded alpha-synuclein protein [also known as α-synuclein, abbreviated αSyn, and encoded by the human alpha-synuclein (SNCA) gene] into pathological aggregates is a shared hallmark within a group of neurodegenerative diseases known as synucleinopathies [1–3]. Among these, Parkinson’s disease (PD), which affects about six million people worldwide, is the most common [2, 4]. PD is predominantly sporadic while 10% is hereditary, and both forms of PD result in the accumulation of pathological αSyn aggregates, also known as Lewy bodies [5–7]. A range of mutations, duplications, and triplications of the SNCA gene have been associated with inherited PD or dementia with Lewy bodies [8–11]. Additionally, certain haplotypes of the SNCA gene have been associated with sporadic PD [12, 13]. Among pathogenic SNCA point mutations in PD, the A30P mutation, in which alanine is shifted for proline at position 30, was one of the first identified [9].
While the extent of synucleinopathy varies between individual PD patients, progressive loss of dopamine (DA) neurons in substantia nigra pars compacta (SNc) is a core brain pathology of PD [14]. Since SNc DA neurons project heavily to the basal ganglia, primarily the caudate and putamen (jointly referred to as the striatum), which control voluntary movement, their degeneration causes slowness and inability to initiate intended movement, so called bradykinesia and akinesia, symptoms which together with rigidity and tremor form the key symptom domain of PD [6, 15]. Postural instability, loss of facial expression, and poor balance control are additional motor symptoms included in the diagnosis of PD [2, 6, 15]. Impairment of voluntary movement and additional motor symptoms accompanied by brain pathology, displayed as severe degeneration of SNc DA neurons and brain-wide Lewy bodies, are the main components of PD.
However, additional pathologies and symptoms are also part of PD [6, 15]. Subsequent to progressive SNc DA neuron degeneration, post-mortem analyses have identified degeneration of multiple neuronal populations, including DA neurons of the ventral tegmental area (VTA), located medial to SNc at the base of the midbrain [16, 17]. VTA DA neurons are involved in reward, emotion, and motivation [14, 18, 19]. Certain non-motor symptoms of PD, such as apathy, loss of motivation, and depression, have been suggested to be related to the loss of VTA DA neurons [20–22].
It is currently not known why VTA DA neurons show a higher resilience than SNc DA neurons in PD. Over the past two decades, several studies have aimed to identify gene expression differences that might help explain their different vulnerability to degeneration. Microarray analyses comparing gene expression in SNc with that in the VTA [23–26], followed by more recent transcriptomics-based molecular profiling on single cell or bulk material prepared from SNc and VTA [27–31] have led to the identification of several genes differentially expressed among midbrain DA neurons (for recent reviews, see e.g., Gaertner et al. [32], Poulin et al. [33]). Thus, while it is long established that all DA neurons express genes critical to the synthesis of the neurotransmitter DA, groups of DA neurons can be divided into subpopulations or subtypes, based on additional gene expression patterns. For example, tyrosine hydroxylase (TH), vesicular monoamine transporter 2 (VMAT2), and DA transporter (DAT) are proteins required to synthesize and transport DA, respectively, and their presence is commonly used to identify DA neurons in brain tissue [34, 35]. In contrast, differential expression has been identified for a number of genes that allow the definition of midbrain DA cell heterogeneity. These include: aldehyde dehydrogenase 1 family member A1 [Aldh1a1, also known as aldehyde dehydrogenase 2 (Ahd2) and retinaldehyde dehydrogenase 1 (Raldh1)], G-protein-activated inward-rectifying potassium channel type 2 (Girk2), calbindin 1 (Calb1), Calb2 (also known as calretinin). For example, Aldh1a1 mRNA is primarily detected in DA neurons located in ventral VTA and the adjacent ventro-medial aspect of SNc; Girk2 mRNA is prominent throughout SNc but is also present in dorsal VTA; Calb1 mRNA is scattered throughout SNc and VTA but prominent only in the medial-most nucleus of the VTA; Calb2 mRNA is strong in the VTA with scattered presence in SNc. These patterns of expression, and several more, help the outlining of molecularly defined subpopulations (also known as subtypes and subgroups) of midbrain DA neurons [32, 36]. Thus, together with the anatomical location, molecular identities defining multiple subpopulations within the midbrain DA neuronal population allow detailed histological analysis of midbrain DA neurons [32, 33].
The implementation of this new molecular knowledge has been high-lighted as essential in order to advance current understanding of DA neurons in PD [37]. This is a critical observation, not least in the context of animal models implemented to unravel pathological processes relevant to humans. Transgenic mouse models in which the human SNCA gene has been integrated into the mouse genome have proven useful for the study of αSyn-induced pathology. Several such animal models show motor and/or non-motor symptoms relevant to synucleinopathies, including PD. However, the impact of αSyn pathology on the integrity of the midbrain DA system remains to be uncovered [38–43]. Further, while PD patients suffer from synucleinopathy and DA cell loss, it is still debated if mouse models of synucleinopathy show DA cell pathology relevant to PD [39, 40, 42–46].
Based on the pathological consequences of DA cell degeneration and synucleinopathy in PD, recent knowledge of DA cell heterogeneity [32, 33, 37] warrants further investigation of the consequence of αSyn pathology on SNc and VTA DA neuron integrity. For this purpose, two previously published transgenic mouse lines (Thy1-h[A30P]αSyn and Thy1-h[wt]αSyn), expressing human SNCA and shown to display αSyn pathology were selected and analyzed using a battery of general and subpopulation-specific DA cell molecular markers.
All mice were housed under standard conditions under a 12 h dark/light cycle in the animal facility. Food and water were provided ad libitum.
The Thy1-h[A30P]αSyn transgenic mouse line (original publication: Kahle et al. [47] and Neumann et al. [48]) was originally generated by inserting the human SNCA gene coding sequence (CDS) carrying a point mutation in nucleotide position 88 (exchanging guanine to cysteine, causing a shift from alanine to proline at position 30 [9]) under control of the brain-specific Thy-1 promoter. Here, Thy1-h[A30P]αSyn homozygous transgenic mice on a C57BL/6J background were analyzed together with age- and sex-matched wild-type control mice of the same genetic background, as previously described [47–49]. Both male and female mice were analyzed; age span was 16–18 months. Previous studies showed no histological differences between sexes [48]. Here, no difference between male and female mice was observed at any stage of the analysis, and male and female mice were pooled to address groups by genotype and age only. n = 20 mice per genotype.
The Thy1-h[wt]αSyn transgenic mouse line [also known as line 61 (L61) and originally described in Chesselet et al. [50] and Rockenstein et al. [51]] was generated by inserting the CDS of wild-type human SNCA under control of the Thy-1 promoter. Here, heterozygous Thy1-h[wt]αSyn transgenic mice were generated by breeding heterozygous transgenic females with C57BL6/DBA2 males. Due to the transgenic insertion in the X-chromosome, only males were used in accordance with earlier publications [50, 52]. Adult mice were analyzed, aged 5 months (n = 8). Age-matched wild-type littermates for Thy1-h[wt]αSyn transgenic mice were used as controls (5 months, n = 7) in accordance with previous publications [50, 51].
To first prepare brain sections for mRNA analysis by fluorescent in situ hybridization (FISH), brains were quickly dissected from mice euthanized by cervical dislocation, snap-frozen in cold (–30℃ to –35℃) 2-methylbutane (≥ 99%, Honeywell) and kept at –80℃ until usage. Coronal serial sections were prepared on a cryostat at 16 µm thickness and placed onto SuperFrostTM glass slides in a series of 8 slides (Thermo Fisher Scientific). Slides prepared for FISH analysis were stored at –80℃ until usage.
For detection of selected mRNAs in cryosections, mRNA-directed fluorescent riboprobes were prepared from cDNA (Oramacell). Probes were synthesized by PCR from DNA template containing T3 and T7 promotor sequences using promoter-attached primers (Table S1). Digoxigenin (DIG, Roche, 11207733910) and fluorescein (Roche, 11426346910) labeled RNA probes were made by a transcriptional reaction with incorporation of DIG or fluorescein labelled nucleotides following our previously described protocol [53]. The specificity of probes was verified using NCBI blast.
Probes detecting mouse αSyn mRNA [mouse alpha-synuclein (Snca), Figure 1]: Rat Snca DNA was used for generation of two different probes. A mouse-selective Snca probe (mSnca), referred to as mSnca, was generated to recognize endogenous Snca mRNA, designed in the untranslated region (UTR) 3’ region for high homology with the mouse Snca mRNA sequence and lacking counterpart in the transgenic construct (reference rat Snca NM_019169.3: sequence 639–1,035 specific for mouse Snca mRNA) (Figure 1A–B). Another probe detecting human and mouse SNCA (Snca) CDS (high sequence homology of mouse and human) was generated to recognize both endogenous mouse Snca and transgenic human SNCA (reference rat Snca NM_019169.3: sequence 59–1,037) mRNAs. This probe is referred to as probe detecting human and mouse alpha-synuclein mRNA mouse-selective alpha-synuclein probe (m/hSnca, Figure 1A–B).
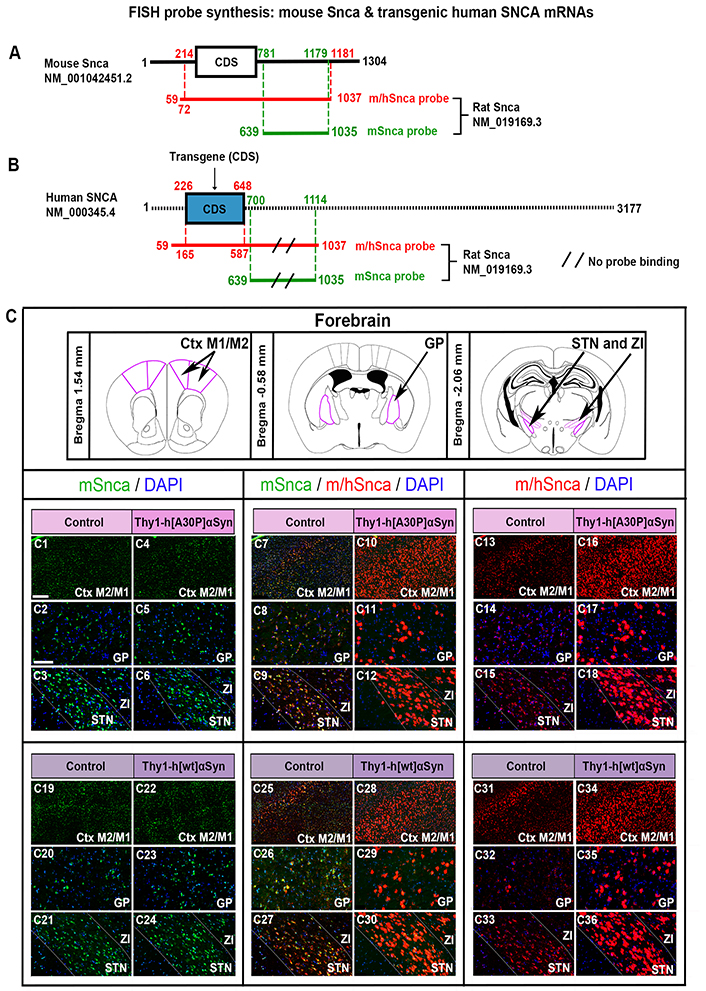
FISH analysis of Thy1-h[A30P]αSyn and Thy1-h[wt]αSyn mouse lines reveals normal distribution of endogenous Snca mRNA despite presence of transgenic SNCA mRNA. Illustration of the mSnca and m/hSnca probes and respective regions of recognition in the mouse Snca (A) and human SNCA (B) sequence. (C) Magnified images of mSnca (green) and m/hSnca (red) probe detection in different structures in coronal brain sections. Thy1-h[A30P]αSyn mouse line: mSnca in control (C1–C3) and transgenic (C4–C6) mice, mSnca/m/hSnca in control (C7–C9) and transgenic (C10–C12) mice, m/hSnca in control (C13–C15) and transgenic (C16–C18) mice. n = 5 per genotype. Thy1-h[wt]αSyn mouse line: mSnca in control (C19–C21) and transgenic (C22–C24) mice, mSnca/m/hSnca in control (C25–C27) and transgenic (C28–C30) mice, m/hSnca in control (C31–C33) and transgenic (C34–C36) mice. DAPI (blue). n = 3 mice per genotype. (C1, C4, C7, C10, C13, C16, C19, C22, C25, C28, C31, C34) sections at level +1.54 mm anteriorly from bregma, scale bar 250 µm; (C2, C5, C8, C11, C14, C17, C20, C23, C26, C29, C32, C35) sections at level –0.58 mm posteriorly from bregma, scale bar 100 µm; (C3, C6, C9, C12, C15, C18, C21, C24, C27, C30, C33, C36) at level –2.06 mm posteriorly from bregma, scale bar 100 µm. Ctx: cortex; DAPI: 4’,6-diamidino-2-phenylindole; GP: globus pallidus; M1: primary motor Ctx; M2: secondary motor Ctx; STN: subthalamic nucleus; ZI: zona incerta
Other probes were described previously, including probes detecting midbrain DA neuron markers, Aldh1a1, Girk2, Calb1, Calb2, gastrin-releasing peptide (Grp), Th, Vmat2, Dat, and vesicular glutamate transporter (Vglut2), which is also a marker of neurons with a glutamatergic phenotype [53, 54].
FISH experiments were performed following our previously described protocol [53]. To allow comparison between transgenic and control mice, each probe/probe pair was hybridized simultaneously on slides from transgene and control brain sections, and slides were treated in parallel throughout the protocol. Cryosections were air-dried, fixed in 4% paraformaldehyde (PFA, Merck Millipore, 1040051000), acetylated with 0.25% acetic anhydride (100 mmol/L, Sigma-Aldrich, A6404) in triethanolamine (pH 8, Sigma-Aldrich, T58300), hybridized in 100 µL formamide (Eurobio, GHYFOR01-01) buffer containing 1 µg/mL DIG and/or 1 µg/mL fluorescein-labeled probes at 65℃ for 18 h, followed by washes with sodium saline citrate (SSC, Invitrogen, AM9763) buffers of decreasing concentrations and maleic acid (Sigma-Aldrich, M0375) buffer, and blocked with 20% fetal bovine serum (FBS, Invitrogen, 10106-169) and 1% blocking solution. Riboprobe revelation was performed using horse-radish peroxidase (HRP) anti-fluorescein fab fragments (Sigma-Aldrich, 11426346910) diluted at 1/1,000, and biotin-labeled tyramide signal amplification (TSA) reagent (PerkinElmer, NEL749A001KT) followed by NeutravidinTM-Oregon GreenTM (InvitrogenTM, ThermoFisher, A6374), or anti-fluorescein fab fragments diluted at 1/5,000 and fluorescein-tyramide solution (ThermoFischer, 46410) diluted at 1/250. HRP-activity was stopped by incubation of sections in 0.1 mol/L glycine (Sigma-Aldrich, G7125) and 3% H2O2 (Sigma-Aldrich, 216763). DIG-epitopes were detected with HRP anti-DIG fab fragments diluted at 1/1,000 (Sigma-Aldrich, 11207733910) followed by cyanine 3 (Cy3)-labeled TSA reagent diluted at 1/150 (Akoya Biosciences, NEL744001KT) or Cy3-tyramide solution (Sigma Aldrich, GEPA13104) diluted at 1/100. DAPI (Sigma-Aldrich, D9542) was used as fluorescent nuclear counter-staining. Slides were covered and slipped using fluoromount (SouthernBiotech).
All images were acquired at 20× (0.46 µm/pixel) using a whole slide imaging digital slide scanner NanoZoomer S60 (Hamamatsu Photonics, C13210-01). Fluorescent images were acquired as multilayer images using filters for DAPI, fluorescein isothiocyanate (FITC), and tetramethylrhodamine isothiocyanate Cy3 (TRITC CY3) channels. Settings for optimized signal analysis (time exposure and gain of the camera) were set manually for each channel prior to scanning. Slides from control and transgenic mice for which the same probe/probe pair had been implemented in the FISH experiment were analyzed using the same settings under the same scanning session. Bright-field images were acquired as one-layer images. White-balance was performed prior to scanning and settings were kept throughout all scanning sessions. Slides from control and transgenic mice for which the same antibody was used in the immunohistochemical analysis were scanned in the same scanning session. The NDP.view2 software (Hamamatsu Photonics) was used for image visualization with high resolution and magnification, and analysis using multi-view function on original images with separate and simultaneous visualization of all channels (NanoZoomer Digital Pathology image set—NDPIS). Brain areas were defined using published atlas [55].
Analysis of m/hSnca and mSnca probe distribution was performed by thorough histological observations of sections from 3–5 mice per genotype (control and transgene), 6 slides per mouse, 10–19 sections per slide, between coordinates +3.56 mm and –5.52 mm from bregma. mSnca probe distribution in control and transgenic mice were considered as baseline. Elevated levels of m/hSnca probe distribution in a specific brain region of the transgenic mice were defined by increased density of labeling compared to baseline, as assessed by visual inspection.
Histological analysis of DA markers in the SNc and VTA subregions was performed by visual inspection of images from control and transgenic mice. For each probe/probe combination, 3–10 mice of each genotype were used. The distribution pattern of each DA marker in control and transgenic mice was compared to the distribution pattern of the Th probe and to reports from previous publications on the distribution pattern of the same DA markers in wild-type mice, including Th. Probe labeling was considered localized within a cell when five contiguous fluorescent puncta were present within the outline of the cell soma. Co-labeling/co-localization of two different probes/mRNAs was considered when both were detected within the same cell, as per the definition above. Cell nuclei counter-stained with DAPI were analyzed locally to control for one nucleus per cell soma.
Quantification was performed on 4 control and 4 transgenic mouse brains in the Thy1-h[A30P]αSyn transgenic mouse line in serial sections covering the SNc and VTA areas and analyzed for Alh1a1 and Th FISH-probe-positive signal (+). SNc was analyzed at three different coordinates: –3.08, –3.40, and –3.52 mm posteriorly from bregma. A total number of SNc cells was analyzed: control (2,060) and transgene (1,969). Paranigral nucleus (PN)/parainterfascicular nucleus (PIF) was analyzed at two levels –3.40 and –3.52 mm posteriorly from bregma; interfascicular nucleus (IF) was analyzed at two levels: –3.52 and –3.64 mm posteriorly from bregma. A total number of PN/PIF/IF cells was analyzed: control (1,131) and transgene (1,153). Caudal linear nucleus (CLi) was analyzed at two levels: –3.80 and –4.04 mm posteriorly from bregma. A total number of CLi cells analyzed: control (206) and transgene (201). No counting in rostral linear nucleus (RLi, as almost no Th+ cells are present in RLi). Counting was made manually using NDP.view2 and QuPath software [56]. Pie charts were generated to show the percentage of Th+/Aldh1a1+ cells vs. Th+/Aldh1a1-negative (–) cells. All Aldh1a1 cells are Th+; thus, no percentage is indicated for Th–/Aldh1a1+ cells. Quantification was made in an identical manner in Thy1-h[wt]αSyn transgenic mouse line (n = 2 of each genotype).
Two FISH probes were generated to detect Snca mRNA in brain sections of mice, a dual probe recognizing both endogenous mouse Snca mRNA and transgenic human SNCA mRNA, here referred to as the m/hSnca probe, and a second probe selectively recognizing the UTR 3’ region of mouse Snca mRNA, here referred to as the mSnca probe (Figure 1A–B, illustration of probe design). Due to high sequence homology between mouse and human CDS, it was not possible to generate a probe selectively recognizing human SNCA CDS, instead the dual m/hSnca probe was compared with the selective mSnca probe. In the brains of control mice, where no human SNCA transgene is present, the m/hSnca probe should thus only detect the endogenous Snca mRNA and show the same detection as the mSnca probe. In contrast, in the Thy1-h[A30P]αSyn and Thy1-h[wt]αSyn transgenic mice, the m/hSnca probe should detect both endogenous Snca and transgenic SNCA mRNA, and any detection beyond that of Snca is due to the transgene. This was verified using FISH analysis in coronal brain sections, which showed substantially more expression of the dual m/hSnca probe in each transgene than in respective controls, thereby validating the new probe (Figure 1C). Further, the mSnca probe appeared similar between genotypes (control vs. transgene) for both transgenic lines (Figure 1C).
To further investigate the extent of both endogenous Snca expression and that induced by the transgene, visual analysis in combination with FISH analysis in serial coronal sections throughout the brain of control and transgenic mice for both transgenic mouse lines was performed. Assessment of control mice for the Thy1-h[A30P]αSyn transgenic line showed m/hSnca probe distribution throughout the brain. Positive brain areas included the cerebral Ctx, anterior olfactory area (AO), hippocampus, amygdala, STN, ZI, dorsal raphe, pontine nucleus, median raphe nucleus, bed nucleus of the stria terminalis, ventral pallidum (VP), retrorubral field (RRF), and GP (Figure 2A–F, Table 1). In Thy1-h[A30P]αSyn transgenic mice, the m/hSnca probe was present in the same areas but with substantially stronger labeling (Figure 2G–L, Table 1). Further, in transgenic mice, m/hSnca probe labeling was also detected in additional areas not detected in control mice, such as the septal hippocampal nucleus, lateral habenula, interpeduncular nucleus, and sub-brachial nucleus (Figure 2G–L, Table 1). To selectively assess the impact of the transgene upon endogenous mouse Snca, the mSnca probe was analyzed and compared with the results of the m/hSnca probe (Figure 1C1–C18, Table 1). In both control and transgenic mice, mSnca labeling was detected throughout the same brain areas as listed above for the m/hSnca probe in control mice, thus not showing any detectable transgene-induced alterations (Figure 1C1–C18, Table 1).
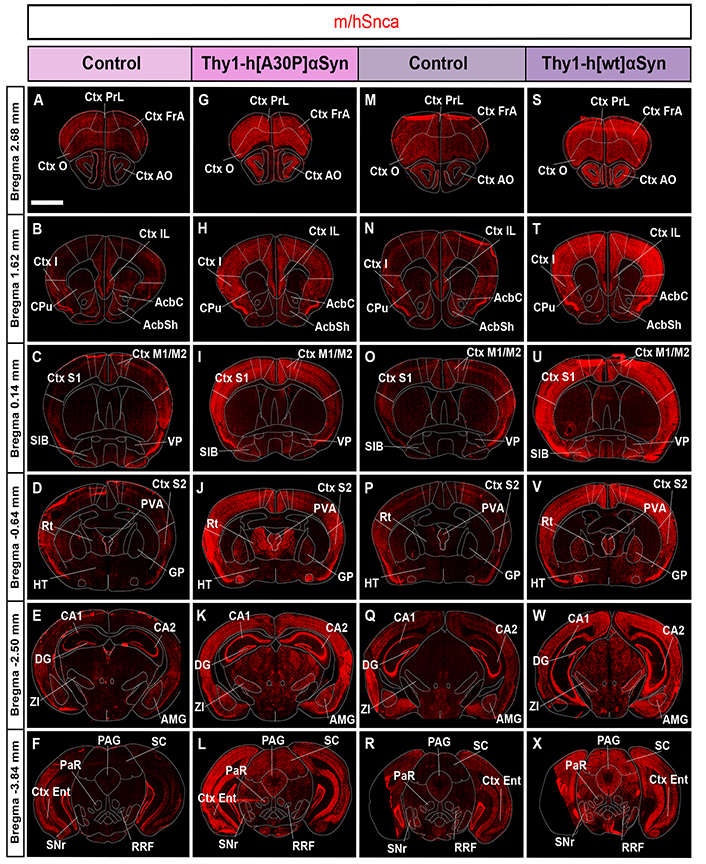
FISH analysis of Thy1-h[A30P]αSyn and Thy1-h[wt]αSyn mouse lines reveals broad expression of the gene encoding αSyn throughout the brain, with substantially more in transgenic than control mice. Detection of m/hSnca probe (red) in coronal brain sections in control (A–F) and transgenic (G–L) mice for the Thy1-h[A30P]αSyn mouse line, in control (M–R) and transgenic (S–X) mice for the Thy1-h[wt]αSyn transgenic mouse line. n = 5 mice per genotype. (A, G, M, S) level +2.68 mm anteriorly from bregma; (B, H, N, T) level +1.62 mm; (C, I, O, U) level +0.14 mm; (D, J, P, V) level –0.64 mm posteriorly from bregma; (E, K, Q, W) level –2.50 mm; (F, L, R, X) level –3.84 mm. Scale bar: 2 mm. PrL: prelimbic Ctx; FrA: frontal association Ctx; O: orbital Ctx; I: insular Ctx; CPu: caudate putamen (striatum); IL: infralimbic Ctx; AcbC: accumbens nucleus, core; AcbSh: accumbens nucleus, shell; S1: primary somatosensory Ctx; SIB: substantia inominata; Rt: reticular nucleus; PVA: paraventricular thalamic nucleus, anterior part; S2: secondary somatosensory Ctx; HT: hypothalamus; CA1: field CA1 of the hippocampus; DG: dentate gyrus; AMG: amygdala complex; CA2: field CA2 of the hippocampus; Ent: entorhinal Ctx; PAG: periaqueductal gray matter; PaR: pararubral nucleus; SC: superior colliculus; SNr: substantia nigra pars reticulata
Analysis of m/hSnca and m/Snca probe distribution in serial brain sections of Thy1-h[A30P]αSyn and Thy1-h[wt]αSyn mouse lines. Results obtained in FISH; transgenic mice compared to control mice. The mSnca probe represents endogenous, mouse-selective Snca mRNA; the m/hSnca probe represents both mouse and human Snca CDS [thus revealing both endogenous (mouse) and transgenic (human) Snca mRNA] (Figure 1 for details). By comparing the labeling results obtained in FISH analysis in which the two Snca probes were implemented in control and transgenic mice for each transgenic mouse line, the same patterns are observed with the m/hSnca probe in control mice and the mSnca probe in both control and transgenic mice, while detection beyond this, as identified using the h/mSnca probe in transgenic mice, identifies transcriptional effects induced by the transgenic construct in transgenic mice
| Regions | m/hSnca | mSnca | m/hSnca | mSnca | ||||
|---|---|---|---|---|---|---|---|---|
| Control | Thy1-h[A30P]αSyn | Control | Thy1-h[A30P]αSyn | Control | Thy1-h[wt]αSyn | Control | Thy1-h[wt]αSyn | |
| Anterior olfactory area | Yes | ↑ | Yes | Yes | Yes | ↑ | Yes | Yes |
| Granule cell layer of the olfactory bulb | Yes | Same | Yes | Yes | No | Yes | NA | NA |
| Mitral cell layer of the olfactory bulb | Yes | ↑ | Yes | Yes | Yes | ↑ | Yes | Yes |
| Glomerular layer of the olfactory bulb | No | Yes | NA | NA | Yes | Same | Yes | Yes |
| Cortex (including all its divisions) | Yes | ↑ | Yes | Yes | Yes | ↑ | Yes | Yes |
| Tenia tecta | Yes | ↑ | Yes | Yes | Yes | ↑ | Yes | Yes |
| Endopiriform claustrum | Yes | ↑ | Yes | Yes | Yes | ↑ | Yes | Yes |
| Olfactory tubercle | Yes | ↑ | Yes | Yes | Yes | ↑ | Yes | Yes |
| Ventral pallidum | Yes | ↑ | Yes | Yes | Yes | ↑ | Yes | Yes |
| Ventral striatum | Yes | ↑ | Yes | Yes | Yes | ↑ | Yes | Yes |
| Dorsal striatum | Yes | Same | Yes | Yes | Yes | ↑ | Yes | Yes |
| Septal hippocampal nucleus | No | Yes | NA | NA | Yes | ↑ | Yes | Yes |
| Lateral septum | Yes | ↑ | Yes | Yes | Yes | ↑ | Yes | Yes |
| Medium septum | Yes | ↑ | Yes | Yes | Yes | ↑ | Yes | Yes |
| Nucleus of the vertical limb of the diagonal band | Yes | ↑ | Yes | Yes | Yes | ↑ | Yes | Yes |
| Lateral preoptic area | Yes | ↑ | Yes | Yes | Yes | ↑ | Yes | Yes |
| Nucleus of the horizontal limb of the diagonal band | Yes | ↑ | Yes | Yes | Yes | ↑ | Yes | Yes |
| Medio preoptic area | Yes | ↑ | Yes | Yes | Yes | ↑ | Yes | Yes |
| Medial forebrain bundle area | Yes | ↑ | Yes | Yes | Yes | ↑ | Yes | Yes |
| Bed nucleus of the stria terminalis | Yes | ↑ | Yes | Yes | Yes | ↑ | Yes | Yes |
| Paraventricular thalamic nucleus | Yes | ↑ | Yes | Yes | Yes | ↑ | Yes | Yes |
| Globus pallidus | Yes | ↑ | Yes | Yes | Yes | ↑ | Yes | Yes |
| Thalamus (not including intermediodorsal nucleus) | Yes | ↑ | Yes | Yes | Yes | ↑ | Yes | Yes |
| Intermediodorsal thalamic nucleus | Yes | ↑ | Yes | Yes | Yes | ↑ | Yes | Yes |
| Hypothalamus (not including ventromedial nucleus) | Yes | ↑ | Yes | Yes | Yes | ↑ | Yes | Yes |
| Ventromedial hypothalamic nucleus | Yes | ↑ | Yes | Yes | Yes | ↑ | Yes | Yes |
| Amygdala | Yes | ↑ | Yes | Yes | Yes | ↑ | Yes | Yes |
| Hippocampus | Yes | ↑ | Yes | Yes | Yes | ↑ | Yes | Yes |
| Lateral habenula | No | Yes | NA | NA | Yes | ↑ | Yes | Yes |
| Medial lateral habenula | Yes | Same | Yes | Yes | Yes | Same | Yes | Yes |
| Subthalamic nucleus | Yes | ↑ | Yes | Yes | Yes | ↑ | Yes | Yes |
| Zona incerta | Yes | ↑ | Yes | Yes | Yes | ↑ | Yes | Yes |
| Mammillary nucleus | Yes | ↑ | Yes | Yes | Yes | ↑ | Yes | Yes |
| Geniculate nucleus | Yes | ↑ | Yes | Yes | Yes | ↑ | Yes | Yes |
| Red nucleus | Yes | ↑ | Yes | Yes | Yes | ↑ | Yes | Yes |
| Reticular formation | Yes | ↑ | Yes | Yes | Yes | ↑ | Yes | Yes |
| Superior colliculus | Yes | ↑ | Yes | Yes | Yes | ↑ | Yes | Yes |
| Retro-mammillary nucleus | Yes | ↑ | Yes | Yes | Yes | ↑ | Yes | Yes |
| Posterior hypothalamic area | Yes | ↑ | Yes | Yes | Yes | ↑ | Yes | Yes |
| Anterior pretectal nucleus | Yes | ↑ | Yes | Yes | Yes | ↑ | Yes | Yes |
| Interstitial nucleus of Cajal | Yes | ↑ | Yes | Yes | Yes | ↑ | Yes | Yes |
| Substantia nigra pars reticulata | Yes | ↑ | Yes | Yes | Yes | ↑ | Yes | Yes |
| Ventral tegmental area | Yes | ↑ | Yes | Yes | Yes | ↑ | Yes | Yes |
| Substantia nigra pars compacta | Yes | ↑ | Yes | Yes | Yes | ↑ | Yes | Yes |
| Periaqueductal gray | Yes | ↑ | Yes | Yes | Yes | ↑ | Yes | Yes |
| Oculomotor nucleus | Yes | ↑ | Yes | Yes | Yes | ↑ | Yes | Yes |
| Pontine nucleus | Yes | ↑ | Yes | Yes | Yes | ↑ | Yes | Yes |
| Interpeduncular nucleus | No | Yes | NA | NA | No | Yes | NA | NA |
| Sub-brachial nucleus | No | Yes | NA | NA | Yes | ↑ | Yes | Yes |
| Retro-rubral field | Yes | ↑ | Yes | Yes | Yes | ↑ | Yes | Yes |
| Median raphe nucleus | Yes | ↑ | Yes | Yes | Yes | ↑ | Yes | Yes |
| Dorsal raphe nucleus | Yes | ↑ | Yes | Yes | Yes | ↑ | Yes | Yes |
Yes: detection of labeling; ↑: increased detection as compared to control mice; Same: same detection as in control mice (i.e. no difference transgene vs. control); NA: not applicable due to lack of detection in both control and transgenic mice; No: no detection of labeling in control mice
Similar results were seen when addressing the Thy1-h[wt]αSyn transgenic mouse line. Analysis of control mice showed m/hSnca probe distribution throughout the brain, in the same areas as listed above for control mice of the Thy1-h[A30P]αSyn transgenic line, as well as in the glomerular layer of olfactory bulb, lateral habenula, and subbrachial nucleus of the midbrain (Figure 2M–R, Table 1). In Thy1-h[wt]αSyn transgenic mice, m/hSnca probe distribution was detected in the same areas as in controls. However, as seen with the Thy1-h[A30P]αSyn transgenic mice, labeling was substantially stronger in Thy1-h[wt]αSyn transgenic mice than in controls (Figure 2S–X, Table 1). As with Thy1-h[A30P]αSyn transgenic mice, also Thy1-h[wt]αSyn transgenic mice showed m/hSnca probe distribution in additional areas not identified in the control mice (Figure 2S–X, Table 1). These included the interpeduncular nucleus and the granular cell layer of the olfactory bulb (Table 1). In addition, similar results as above were obtained using the mSnca probe detecting endogenous Snca mRNA; FISH mSnca probe labeling was detected throughout the same brain areas in both control and transgenic mice as for the m/hSnca probe in control mice (Figure 1C19–C36, Table 1).
The results obtained by comparing the distribution and intensity of labeling between control and transgenic mice of both αSyn transgenic mouse lines suggest that expression seen in control mice with the dual m/hSnca probe, which is the same as seen with the mouse-selective mSnca probe in both control and transgenic mice, represents endogenous Snca. Further, expression beyond this is an effect of the SNCA transgene, which is detected as stronger and more wide-spread than the endogenous Snca in both mouse models of synucleinopathy.
Based on the verified expression of the human SNCA transgene throughout the brain, it was of interest to examine if SNc and VTA DA neurons were affected in the transgenic mice. First, m/hSnca and mSnca probes were analyzed in co-FISH analysis in combination with a Th probe. TH is the rate-limiting enzyme in DA synthesis, and TH protein as well as Th mRNA represent common general markers for midbrain DA neurons.
In control mice for the Thy1-h[A30P]αSyn transgenic mouse line, both the m/hSnca and mSnca probes co-localized almost entirely with the Th probe in both SNc and VTA, verifying expression in DA neurons (Figure 3A, A1, A1’–A1’’’, C, C’–C’’’). Notably, cells negative for Th were also negative for the m/hSnca and mSnca probes. The distribution in the Thy1-h[A30P]αSyn transgenic mice was different. Here, the distribution of the m/hSnca probe was substantially more widespread than in control mice. In fact, the m/hSnca probe labeled both Th+ and Th– neurons in SNc and VTA of transgenic mice, showing that the transgene is expressed in non-DA neurons of the SNc and VTA (Figure 3B, B1, B’–B1’’’). In contrast, distribution of the mSnca probe showed no difference between Thy1-h[A30P]αSyn transgenic mice and controls, and co-localized completely with the Th probe (Figure 3C, C’–C’’’, D, D’–D’’’). These differences suggested that detection of the m/hSnca probe in Th– neurons is due to presence of transgenic SNCA mRNA. Additionally, while an elevated level of m/hSnca probe detection was observed in SNc and VTA of Thy1-h[A30P]αSyn transgenic mice, the strength of m/hSnca probe detection in Th+ neurons did not seem increased compared to either controls or mSnca probe detection (Figure 3A1, A1’–A1’’’, B1, B1’–B1’’’, E, E’–E’’’, F, F’–F’’’). The results are in accordance with previous knowledge that the Thy-1 promoter does not drive transgenic expression strongly in the SNc and VTA [57]. Instead, the increase in labeling was due to m/hSnca probe detection in several Th– neurons. Further, in Thy1-h[A30P]αSyn transgenic mice, but not control mice, substantial m/hSnca probe distribution, but not mSnca probe distribution, was observed in additional midbrain nuclei, including the periaqueductal gray, medial accessory oculomotor nucleus, medial geniculate nucleus, red nucleus (RN), SNr, and the interpeduncular nucleus, further emphasizing the strength of the transgene in the midbrain (Figure 3, Table 1).
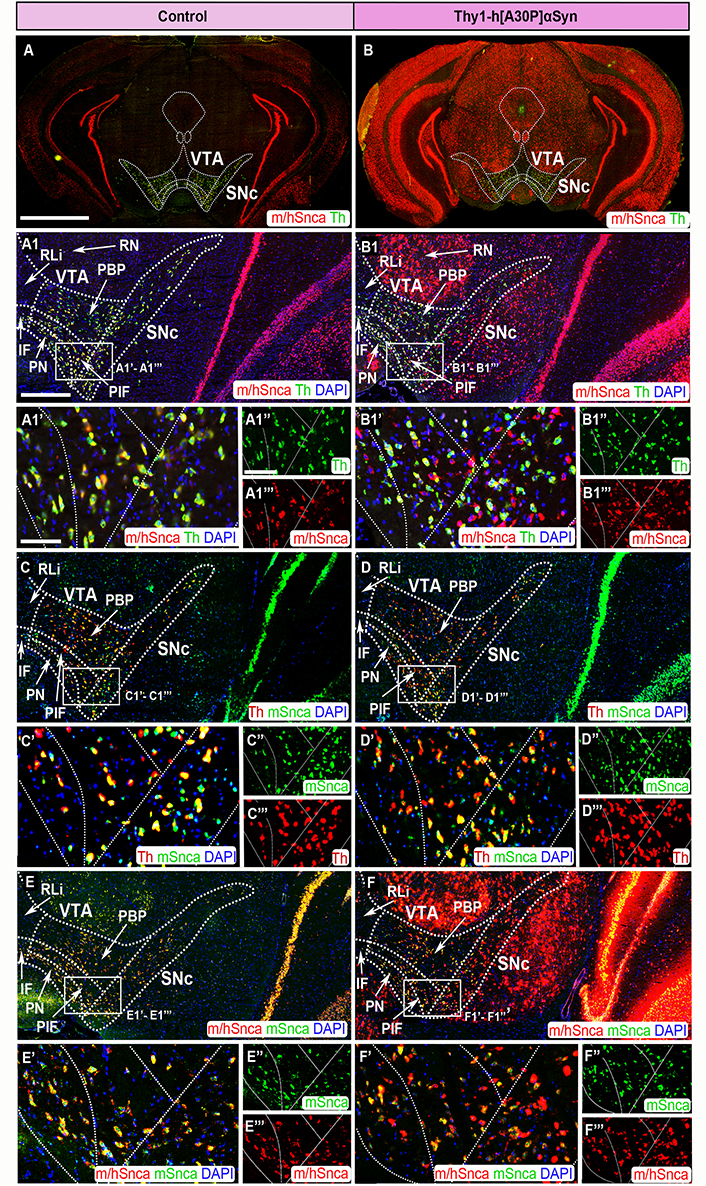
FISH analysis of Thy1-h[A30P]αSyn transgenic mice reveals abundance of transgenic SNCA mRNA throughout SNc and VTA. Co-detection of m/hSnca (red) and Th (green) probes in coronal brain section of control (A) and transgenic (B) mice. Magnification of the SNc and VTA: m/hSnca (red)/Th (green) in control (A1) and transgenic (B1) mice; Th (red)/mSnca (green) in control (C) and transgenic (D) mice; m/hSnca (red)/mSnca (green) in control (E) and transgenic (F) mice. Close up’s of positive subregions as indicated by squares: m/hSnca (red)/Th (green) in control (A1’) and transgenic (B1’) mice; Th (green) in control (A1’’) and transgenic (B1’’) mice; m/hSnca (red) in control (A1’’’) and transgenic (B1’’’) mice; Th (red)/mSnca (green) in control (C’) and transgenic (D’) mice; mSnca (green) in control (C’’) and transgenic (D’’) mice; Th (red) in control (C’’’) and transgenic (D’’’) mice; m/hSnca (red)/mSnca (green) in control (E’) and transgenic (F’) mice; mSnca (green) in control (E’’) and transgenic (F’’) mice; m/hSnca (red) in control (E’’’) and transgenic (F’’’) mice. DAPI (blue). n = 3–5 mice per genotype. Sections at level –3.00 mm posteriorly from bregma. Scale bars: (A, B) 2 mm; (A1, B1, C, D, E, F) 500 µm; (A1’, B1’, C’, D’, E’, F’) 100 µm; (A1’’, A1’’’, B1’’, B1’’’, C’’, C’’’, D’’, D’’’, E’’, E’’’, F’’, F’’’) 150 µm. Dashed lines show the boarders between structures and subregions according to published atlas [55]. PBP: parabrachial nucleus
When addressing SNc and VTA in the Thy1-h[wt]αSyn transgenic mouse line, it was found that the m/hSnca and mSnca probes were equally strong in control mice, representing endogenous Snca mRNA (Figure 4A, A1, A1’–A1’’’, C, C’–C’’’, E, E’–E’’’). Further, the mouse-selective mSnca probe was equally strong in control and transgenic mice (Figure 4C, C’–C’’, D, D’–D’’’, E, E’–E’’’, F, F’–F’’’). However, the m/hSnca and mSnca probes did not show perfect co-localization with the Th probe, instead a small number of Snca+ cells were negative for Th (Figure 4A, A1, A1’–A1’’’, C, C’–C’’’).
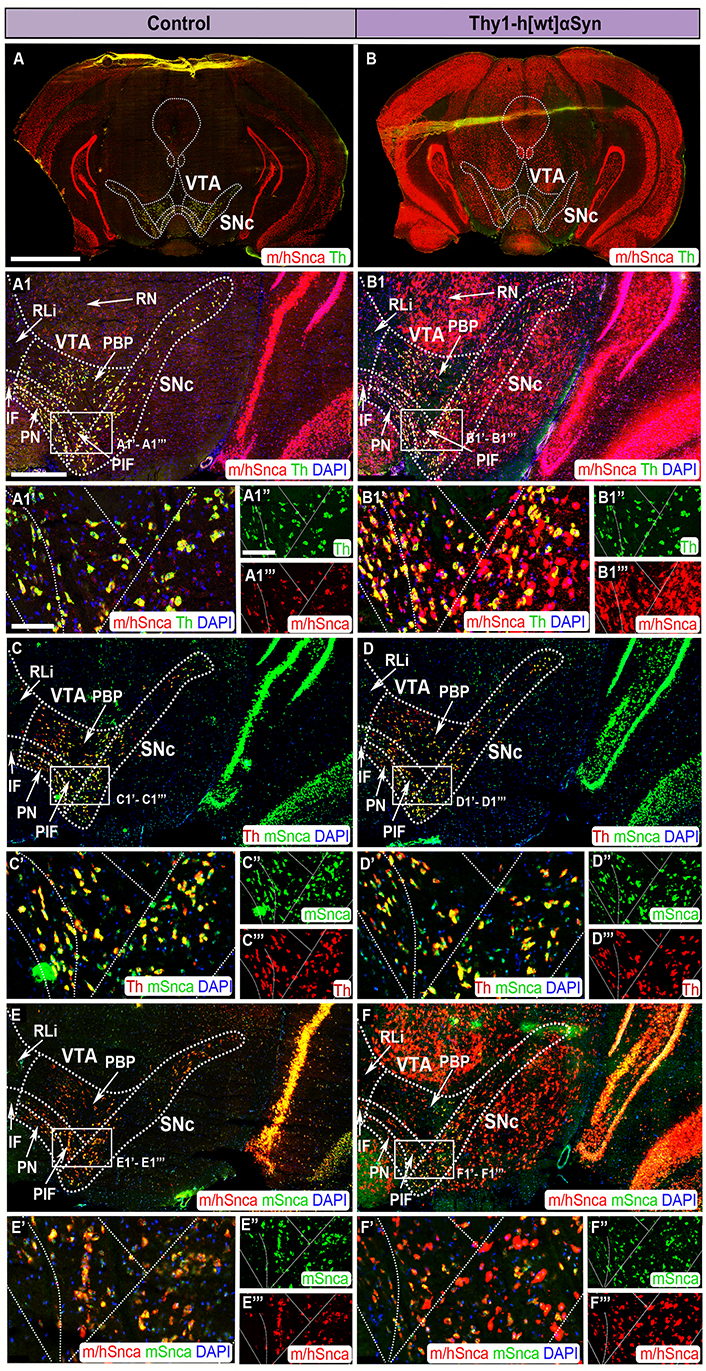
FISH analysis of Thy1-h[wt]αSyn transgenic mice reveals abundance of transgenic SNCA mRNA throughout SNc and VTA. Co-detection of m/hSnca (red) and Th (green) probes in coronal brain section of control (A) and transgenic (B) mice. Magnification of the SNc and VTA: m/hSnca (red)/Th (green) in control (A1) and transgenic (B1) mice; Th (red)/mSnca (green) in control (C) and transgenic (D) mice; m/hSnca (red)/mSnca (green) in control (E) and transgenic (F) mice. Close up’s of positive subregions as indicated by squares: m/hSnca (red)/Th (green) in control (A1’) and transgenic (B1’) mice; Th (green) in control (A1’’) and transgenic (B1’’) mice; m/hSnca (red) in control (A1’’’) and transgenic (B1’’’) mice; Th (red)/mSnca (green) in control (C’) and transgenic (D’) mice; mSnca (green) in control (C’’) and transgenic (D’’) mice; Th (red) in control (C’’’) and transgenic (D’’’) mice; m/hSnca (red)/mSnca (green) in control (E’) and transgenic (F’) mice; mSnca (green) in control (E’’) and transgenic (F’) mice; m/hSnca (red) in control (E’’’) and transgenic (F’’’) mice. DAPI (blue). n = 3–5 mice per genotype. Sections at level –3.00 mm posteriorly from bregma. Scale bars: (A, B) 2 mm; (A1, B1, C, D, E, F) 500 µm; (A1’, B1’, C’, D’, E’, F’) 100 µm; (A1’’, A1’’’, B1’’, B1’’’, C’’, C’’’, D’’, D’’’, E’’, E’’’, F’’, F’’’) 150 µm. Dashed lines show the boarders between structures and subregions according to published atlas [55]
In SNc and VTA of Thy1-h[wt]αSyn transgenic mice, distribution of the m/hSnca probe was much stronger and more widespread than in control mice, and labeling was detected in both Th+ and Th– neurons (Figure 4A, A1, A1’–A1’’’, B, B1, B1’–B1’’’). Further, Thy1-h[wt]αSyn transgenic mice showed substantial m/hSnca probe distribution in additional midbrain areas, with the same regional distribution as observed for the Thy1-h[A30P]αSyn transgenic mice (Figure 4B, B1, B1’–B1’’’, F, F’–F’’’, Table 1).
In summary, by comparing the distribution of the mSnca probe and the m/hSnca probe in the midbrain, it is evident that the m/hSnca probe showed more widespread distribution in transgenic mice than in control mice, for both αSyn transgenic mouse lines analyzed. In SNc and VTA of the Thy1-h[A30P]αSyn transgenic mouse line, no difference between control and transgenic mice was observed using the mouse-selective mSnca probe, while the m/hSnca probe showed more abundant distribution and was present in both Th+ and Th– neurons in transgenic mice, but not in control mice, thus representing transgenic expression. Few such positive cells were detected in control mice of the Thy1-h[wt]αSyn mouse line. However, by far, most m/hSnca probe labeling in Th– cells in SNc and VTA was seen in transgenic Thy1-h[wt]αSyn mice. Thus, in both mouse models of synucleinopathy, endogenous Snca is found normal (compared to controls) in SNc and VTA with detection in DA neurons. In contrast, transgenic mice of both models showed transgenic SNCA expression in Th– cells in the midbrain, without elevation in Th+ cells. Thus, non-DA neurons of SNc and VTA showed SNCA mRNA labeling, giving rise to stronger overall labeling throughout SNc and VTA without specific elevation in DA neurons.
Following the observation of an almost ubiquitous presence of transgenic SNCA mRNA in the brain of both Thy1-h[A30P]αSyn and Thy1-h[wt]αSyn transgenic mice, including SNc and VTA neurons both positive and negative for Th mRNA, the integrity of DA neurons were further analyzed using general and subpopulation-specific markers.
First, Th mRNA was analyzed in serial sections along the anterior-posterior axis in control and transgenic mice of the two mouse lines. For ease of identification of cellular locations in the anatomically heterogeneous VTA, this area was divided into subareas in accordance with published atlas [55]: PBP, RLi, IF, PN, and PIF (Figure 5). Using a probe directed towards mouse Th mRNA, DA neurons of SNc and VTA were readily detected in control mice, including all subareas of the VTA (Figure 5D–F, J–L). The highest density of Th+ cells was seen in the SNc, PBP, PN, and PIF, followed by lower levels in the IF and RLi, in accordance with the literature [58, 59]. SNc and VTA of Thy1-h[A30P]αSyn and Thy1-h[wt]αSyn transgenic mice showed the same distribution pattern of Th mRNA as control mice for each respective transgene (Figure 5G–I, M–O). Visual analysis of mRNA in 8–10 mice per genotype did not reveal any detectable differences between control and transgenic mice of either the Thy1-h[A30P]αSyn and Thy1-h[wt]αSyn mouse lines.
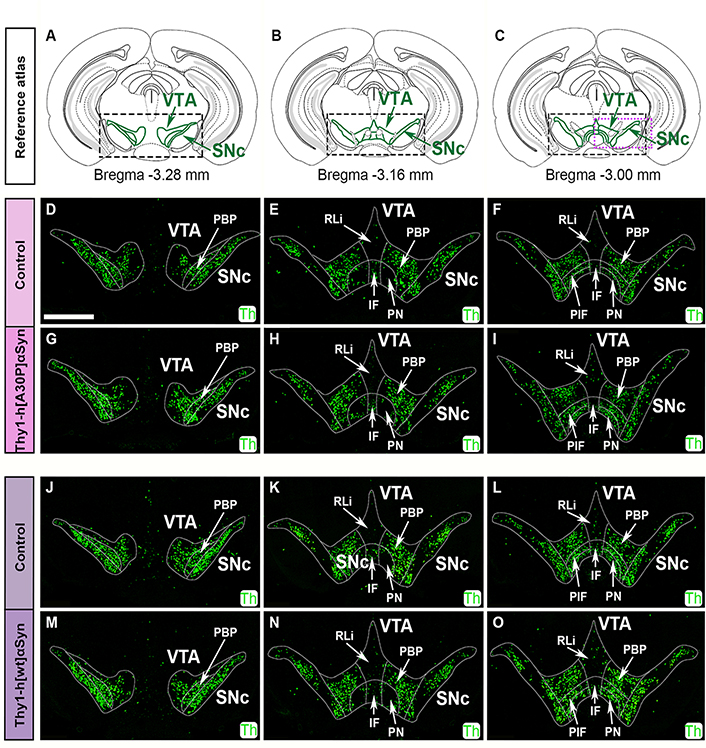
FISH analysis shows normal Th mRNA distribution in SNc and VTA of Thy1-h[A30P]αSyn and Thy1-h[wt]αSyn transgenic mice. Illustration of reference atlas modified from the published atlas [55], levels represented distance –3.28 mm posteriorly from bregma (A), –3.16 mm (B), and –3.00 mm (C), green areas in squares represent SNc and VTA. Detection of Th (green) probe in control (D–F) and transgenic (G–I) mice for the Thy1-h[A30P]αSyn mouse line, and in control (J–L) and transgenic (M–O) mice for the Thy1-h[wt]αSyn mouse line using FISH. n = 8–10 mice per genotype. Scale bar: 1 mm
This preserved pattern of Th mRNA suggests intact integrity of the distribution of DA neurons in SNc and VTA in the presence of abundant human SNCA transgene. To further validate the integrity of SNc and VTA DA neurons, heterogeneity was next analyzed by addressing subpopulation-specific markers.
Several molecular markers have been described to dissociate between subpopulations (also known as subtypes) of DA neurons within SNc and VTA [32, 33, 36]. To validate the integrity of SNc and VTA DA neurons, indicated by the finding above that Th mRNA appeared normal in transgenic compared to control mice, subpopulation-markers were next selected for analysis in co-FISH experiments on serial sections through midbrain of control and transgenic mice. Probes directed towards the following mRNAs were included in the analysis, and compared with general DA neuron markers Th, Vmat2, and/or Dat: Aldh1a1, Calb1, Calb2, Girk2, Grp, Vglut2 (Figure 6, Table S1). All probes were validated in previous studies [53, 54]. In both rodents and primates, several studies have used Girk2 and Calb2 as markers to separate and distinguish between SNc and VTA DA neurons, respectively. However, neither is distinct for SNc or VTA but is expressed at more or less high levels in both areas [26, 54, 60, 61]. Similar is true for most subpopulation markers, distribution patterns are rarely absolute but relative. For example, Aldh1a1 mRNA has been described to be mainly distributed in the ventral aspect of SNc and part of VTA, while Calb2, Vglut2, and Grp show more medial than lateral distribution within the VTA [26, 32, 33, 36].
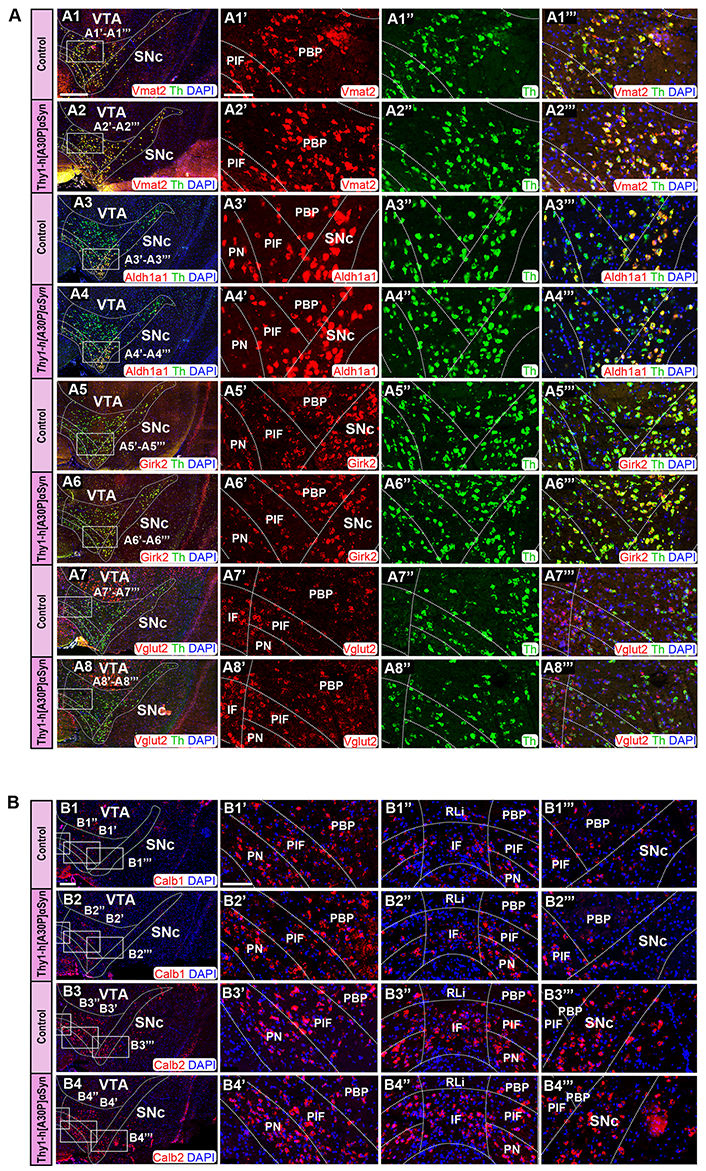
FISH analysis reveals normal distribution pattern of DA subpopulation markers in Thy1-h[A30P]αSyn transgenic mice. (A) Co-detection of Vmat2 (red), Aldh1a1 (red), Girk2 (red), and Vglut2 (red) probes with Th (green) in the SNc and VTA of control and transgenic mice: Vmat2/Th in control (A1) and transgenic (A2) mice; Aldh1a1/Th in control (A3) and transgenic (A4) mice; Girk2/Th in control (A5) and transgenic (A6) mice; Vglut2/Th in control (A7) and transgenic (A8) mice. Close up’s of positive subregions to the right as indicated by squares: Vmat2 in control (A1’) and transgenic (A2’) mice; Aldh1a1 in control (A3’) and transgenic (A4’) mice; Girk2 in control (A5’) and transgenic (A6’) mice; Vglut2 in control (A7’) and transgenic (A8’) mice; Th in control (A1’’, A3’’, A5’’, A7’’) and transgenic (A2’’, A4’’, A6’’, A8’’) mice; Vmat2/Th in control (A1’’’) and transgenic (A2’’’) mice; Aldh1a1/Th in control (A3’’’) and transgenic (A4’’’) mice; Girk2/Th in control (A5’’’) and transgenic (A6’’’) mice; Vglut2/Th in control (A7’’’) and transgenic (A8’’’) mice. (B) Detection of Calb1 (red) and Calb2 (red) in the SNc and VTA of control (B1, B3) and transgenic mice (B2, B4). Close up’s of various subregions to the right as indicated by squares: Calb1 in control (B1’–B1’’’) and transgenic (B2’–B2’’’) mice; Calb2 in control (B3’–B3’’’) and transgenic (B4’–B4’’’) mice. n = 3–5 mice per genotype. Sections level distance –3.00 mm posteriorly from bregma. Scale bars: (A1–A8, B1–B4) 500 µm; (A1’–A1’’’, A2’–A2’’’, A3’–A3’’’, A4’–A4’’’, A5’–A5’’’, A6’–A6’’’, A7’–A7’’’, A8’–A8’’’, B1’–B1’’’, B2’–B2’’’, B3’–B3’’’, B4’–B4’’’) 100 µm Dashed lines show the boarders between structures and subregions according to published atlas [55]
SNc and VTA of the Thy1-h[A30P]αSyn transgenic mouse line were analyzed using Vmat2, Aldh1a1, Girk2, and Vglut2 probes in combination with the Th probe to validate the detection of DA neurons. In accordance with the literature [62], control mice showed distribution of Vmat2 mRNA in all Th+ neurons within both the SNc and VTA (Figure 6A1, A1’–A1’’’). Aldh1a1 mRNA was most prominently detected in the ventro-medial SNc and in the ventral aspect of the VTA, in the PN and PIF areas, and weaker in the dorsal SNc and PBP while modest in the IF and excluded from the RLi (Figure 6A3, A3’, A3’’’). Girk2 mRNA was detected in the SNc but also in the lateral VTA, where it was stronger in the PBP and modest in the PN and PIF, weak in the IF and excluded from the RLi (Figure 6A5, A5’, A5’’’). Vglut2 mRNA was most prominently detected in the IF and RLi, more modest in the PBP, PN, and PIF areas, and weak in the dorsal SNc (Figure 6A7, A7’, A7’’’). Calb1 mRNA was detected in the PN, PIF, and PBP areas, modest in the IF, weak in the RLi, modest in the ventral SNc and weak in the dorsal SNc (Figure 6B1, B1’–B1’’’). Calb2 mRNA was primarily detected in the IF, PIF, and PN, and was also found in the lateral PBP and ventral SNc, while modest in the medial PBP, RLi, and dorsal SNc (Figure 6B3, B3’–B3’’’).
In Thy1-h[A30P]αSyn transgenic mice, the results were identical to those of control mice. All mRNAs showed the same distribution pattern as in the control mice: Vmat2 (Figure 6A2, A2’, A2’’’), Aldh1a1 (Figure 6A4, A4’, A4’’’), Girk2 (Figure 6A6, A6’, A6’’’), Vglut2 (Figure 6A8, A8’, A8’’’), Calb1 (Figure 6B2, B2’–B2’’’), and Calb2 (Figure 6B4, B4’–B4’’’). Further, in accordance with literature [26, 30] and in addition to Vmat2 mRNA, also Aldh1a1 and Girk2 mRNAs co-localized extensively with Th mRNA in control mice (Figure 6A1, A1’–A1’’’, A3, A3’–A3’’’, A5, A5’–A5’’’). The same was observed for the Thy1-h[A30P]αSyn transgenic mice (Figure 6A2, A2’–A2’’’, A4, A4’–A4’’’, A6, A6’–A6’’’). Thus, when comparing Thy1-h[A30P]αSyn transgenic mice with control mice, the same level of intensity and the same distribution patterns were observed for each mRNA selected to represent DA cell groups within the SNc and VTA as a whole (Th and Vmat2) or subpopulations within these (Aldh1a1, Girk2, Calb1, Vglut2, and Calb2).
Next, SNc and VTA of Thy1-h[wt]αSyn transgenic mice were analyzed in the same way and compared with control mice. Here, probes targeting Vmat2, Aldh1a1, Calb1, and Calb2 mRNA were analyzed in co-FISH analysis in combination with the Th probe. Additionally, a probe toward Grp mRNA, a marker of medial VTA was also analyzed in combination with Th [26, 63]. Further, Girk2 was addressed in co-FISH analysis in combination with the Dat probe.
Similar as described above, and in accordance with the literature [62], control mice showed distribution of Vmat2 mRNA in all Th-positive neurons within both the VTA and SNc; the same observation was done for Thy1-h[wt]αSyn transgenic mice (Figure 7A1, A1’–A1’’’, A2, A2’–A2’’’). Aldh1a1 (Figure 7A3, A3’–A3’’’, A4, A4’–A4’’’) and Girk2 (Figure 7A5, A5’–A5’’’, A6, A6’–A6’’’) were similar in control and transgenic mice, and also similar as described above for the Thy1-h[A30P]αSyn mouse line. The highest levels of Dat mRNA in control and transgenic mice were detected in the SNc, PBP, PN, and PIF, followed by lower levels in the IF (Figure 7A5, A5’–A5’’’, A6, A6’–A6’’’), while Grp mRNA was primarily detected in the ventral aspect of the VTA, PN, PIF, and IF, and was weaker in the PBP and ventral SNc, and was excluded from the RLi, dorsal PBP, and dorsal SNc (Figure 7A7, A7’–A7’’’, A8, A8’–A8’’’), in accordance with literature [26, 63]. Calb1 mRNA was detected in the PN, PIF, and PBP areas, with more modest detection in the IF and ventral SNc and weak in the RLi and dorsal SNc (Figure 7B1, B1’–B1’’’, B2, B2’–B2’’’). Calb2 was detected primarily in the IF, PIF, and PN, but also in the lateral PBP and ventral SNc, while modest in the medial PBP, RLi, and dorsal SNc (Figure 7B3, B3’–B3’’’, B4, B4’–B4’’’). Similar expression was detected in control and transgenic mice. In addition to Vmat2, also Aldh1a1 and Grp mRNAs co-localized extensively with Th mRNA in control mice (Figure 7A3, A3’–A3’’’, A7, A7’–A7’’’), as expected based on literature [26, 30, 63], and the same was seen for Thy1-h[wt]αSyn transgenic mice (Figure 7A4, A4’–A4’’’, A8, A8’–A8’’’).
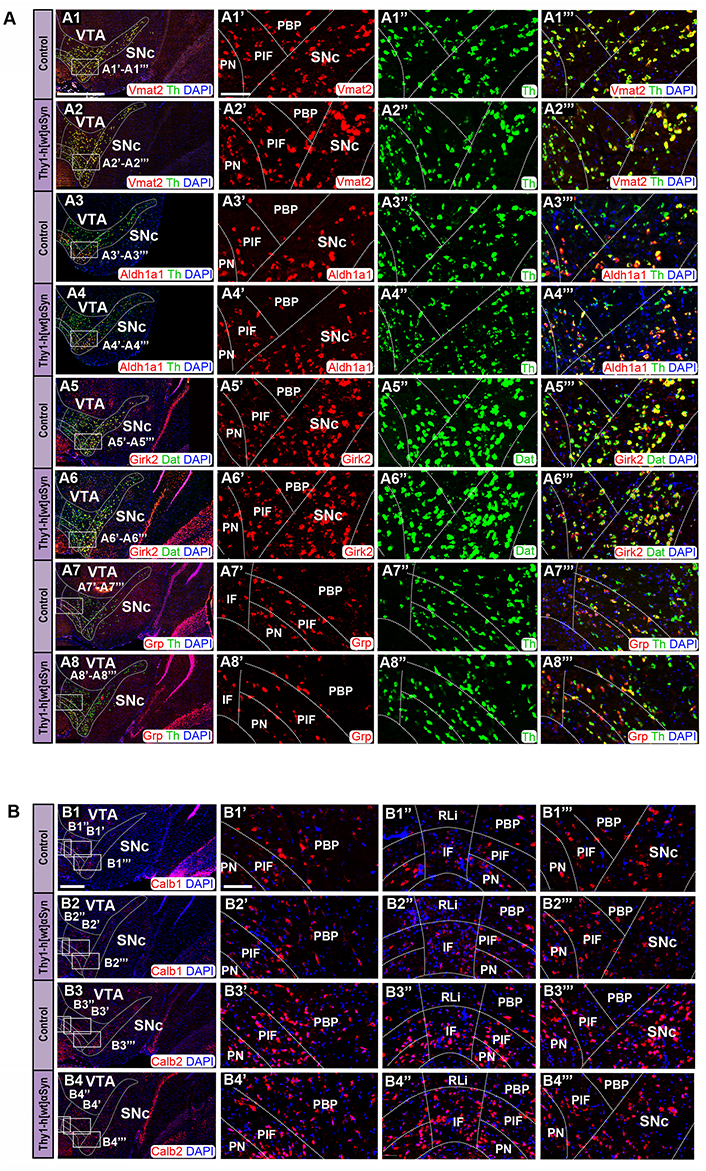
FISH analysis reveals normal distribution pattern of DA subpopulation markers in Thy1-h[wt]αSyn transgenic mice. (A) Co-detection of Vmat2 (red), Aldh1a1 (red), Girk2 (red), and Grp (red) probes with Th (green) or Dat (green) in the SNc and VTA of control and transgenic mice: Vmat2/Th in control (A1) and transgenic (A2) mice; Aldh1a1/Th in control (A3) and transgenic (A4) mice; Girk2/Dat in control (A5) and transgenic (A6) mice; Grp/Th in control (A7) and transgenic (A8) mice. Close up’s of positive subregions to the right as indicated by squares: Vmat2 in control (A1’) and transgenic (A2’) mice; Aldh1a1 in control (A3’) and transgenic (A4’) mice; Girk2 in control (A5’) and transgenic (A6’) mice; Grp in control (A7’) and transgenic (A8’) mice; Th in control (A1’’, A3’’, A7’’) and transgenic (A2’’, A4’’, A8’’) mice; Dat in control (A5’’) and transgenic (A6’’) mice; Vmat2/Th in control (A1’’’) and transgenic (A2’’’) mice; Aldh1a1/Th in control (A3’’’) and transgenic (A4’’’) mice; Girk2/Th in control (A5’’’) and transgenic (A6’’’) mice; Vglut2/Th in control (A7’’’) and transgenic (A8’’’) mice. (B) Detection of Calb1 (red) and Calb2 (red) in the SNc and VTA of control (B1, B3) and transgenic mice (B2, B4). Close up’s of various subregions to the right as indicated by squares: Calb1 in control (B1’–B1’’’) and transgenic (B2’–B2’’’) mice; Calb2 in control (B3’–B3’’’) and transgenic (B4’–B4’’’) mice. n = 3–5 mice per genotype. Sections level distance –3.00 mm posteriorly from bregma. Scale bars: (A1–A8, B1–B4) 500 µm, (A1’–A1’’’, A2’–A2’’’, A3’–A3’’’, A4’–A4’’’, A5’–A5’’’, A6’–A6’’’, A7’–A7’’’, A8’–A8’’’, B1’–B1’’’, B2’–B2’’’, B3’–B3’’’, B4’–B4’’’) 100 µm. Dashed lines show the boarders between structures and subregions according to published atlas [55]
To further verify the findings, Aldh1a1 mRNA was selected for quantification, by counting cells positive for Aldh1a1 and Th, and their comparison. For this analysis, serial sections at the same levels posteriorly from bregma (–2.92, –3.28, –3.40, –3.64, –3.80, and –4.04 mm) covering the entire SNc and VTA region in an anterior-posterior manner from Thy1-h[A30P]αSyn transgenic mice and matching control mice were implemented which allowed careful quantitative assessment throughout SNc and VTA (PBP, IF, and PN/PIF) and also including CLi and RRF in four mice of each genotype. Th+/Aldh1a1+ cells (Figure 8A–L) and Aldh1a1+ cells (Figure 8A’–L’) were analyzed and quantified. The counts revealed that control and transgenic mice contained the same number of labeled cells (Th+/Aldh1a1+ and Th+/Aldh1a1–), further confirming the visual inspection above (Th+/Aldh1a1+, control vs. transgene: SNc, 65% vs. 67%; IF/PN/PIF, 63% vs. 61%; PBP, 78% vs. 78%; CLi, 76% vs. 75%. Th+/Aldh1a1–, control vs. transgene: SNc, 35% vs. 33%; IF/PN/PIF, 37% vs. 39%; PBP, 22% vs. 22%; CLi, 24% vs. 25%, Figure 8M).
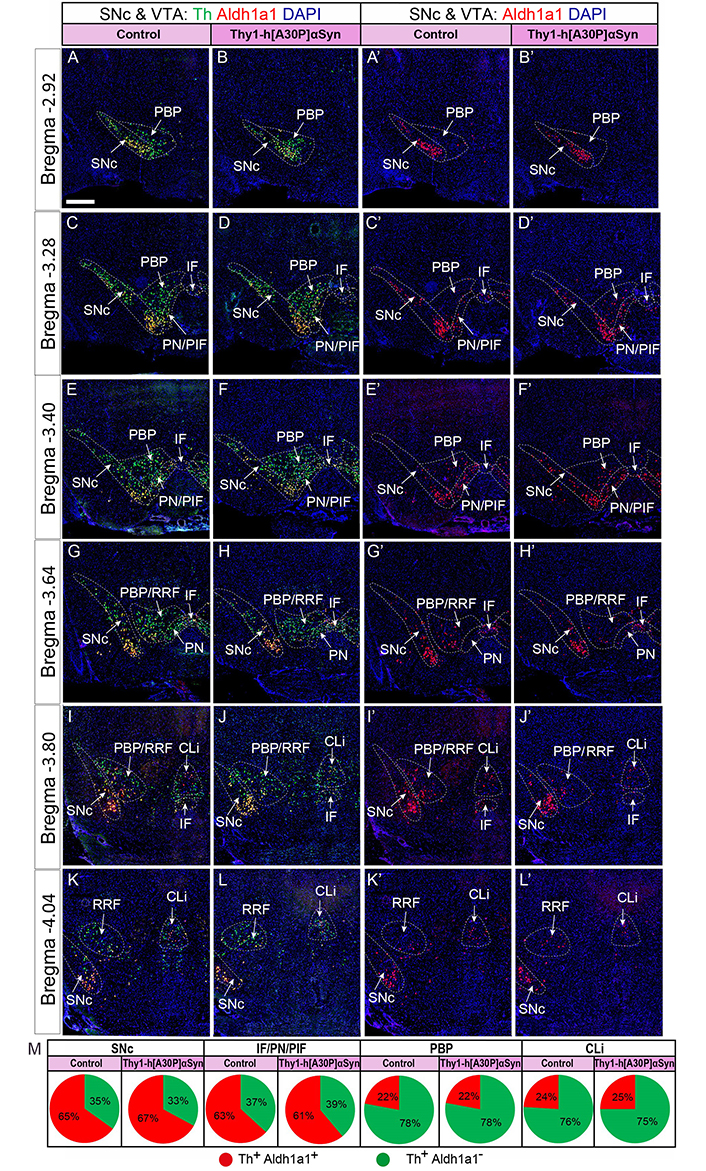
Quantification along the anterior-posterior axis confirms normal levels of Aldh1a1 and Th FISH signal in Thy1-h[A30P]αSyn transgenic mice. (A–L) Aldh1a1/Th/DAPI; (A’–L’) Aldh1a1/DAPI, serial sections through entire SNc/VTA area, distinct coordinates matching control and Thy1-h[A30P]αSyn transgenic mice. (M) Quantification of positive cells per subarea visualized as percentage of total counts in pie charts at the bottom (n = 4 mice per genotype; serial sections); Th+/Aldh1a1+, control vs. transgene: SNc, 65% vs. 67%; IF/PN/PIF, 63% vs. 61%; PBP, 78% vs. 78%; CLi 76% vs. 75%. Th+/Aldh1a1–, control vs. transgene: SNc, 35% vs. 33%; IF/PN/PIF, 37% vs. 39%; PBP, 22% vs. 22%; CLi, 24% vs. 25%. Scale bar: 150 µm
A similar method of quantification was performed in Thy1-h[wt]αSyn mice and matching control mice, albeit in fewer mice, precluding relevant analysis. The results revealed a similar amount of Th+/Aldh1a1+ and Th+/Aldh1a1– number of positive cells as listed above for Thy1-h[A30P]αSyn control vs. transgenic mice.
In summary, no differences between control mice and transgenic mice were observed for any of the mRNAs assessed, either for the Thy1-h[A30P]αSyn transgenic mouse line or the Thy1-h[wt]αSyn transgenic mouse line. In fact, all patterns of mRNAs analyzed were identical between control and transgenic mice of both mouse lines (summarized in Figure 9).
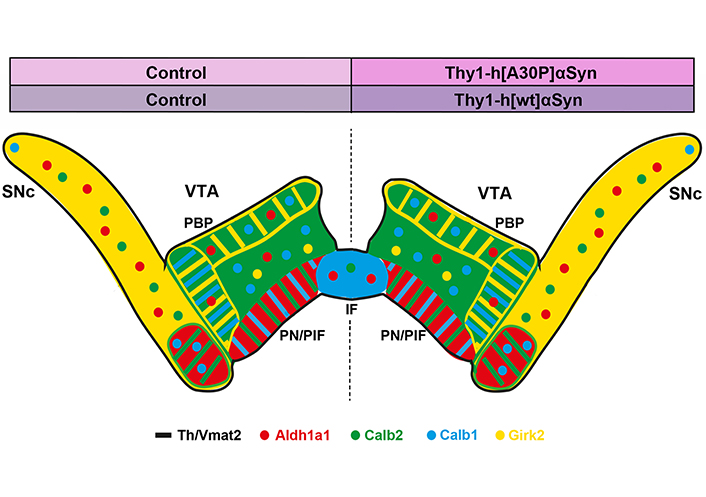
Preserved distribution pattern of several DA cell heterogeneity markers across SNc and VTA in two transgenic mouse models of synucleinopathy. Summary of data obtained in the present study visualized in illustration of a coronal brain section of the mouse midbrain with mRNAs detected by FISH displayed in color. Left half of brain, control; right half of brain, transgene
Over the past couple of decades, transgenic methodology has been used to model human synucleinopathy in mice by driving expression of the human SNCA gene, encoding the αSyn protein, in the mouse brain under control of different promoters. While beneficial to improving knowledge in many ways, one key question which remains to fully answer is to what extent such induced synucleinopathy affects the midbrain DA system in mice [39, 40, 44, 45, 52]. In parallel lines of research, at large built from transcriptional data over several years but empowered recently by single cell transcriptomics methodology, subtypes of midbrain DA neurons can now be distinguished by their molecular identity [33]. This new knowledge impacts greatly on the current understanding of the DA system PD [37]. In the current study, histological analysis was implemented on brain sections derived from two mouse models of αSyn pathology to determine if the molecular heterogeneity of SNc and VTA DA neurons has been disturbed by the induced synucleinopathy. For this analysis, two previously published transgenic mouse lines, Thy1-h[A30P]αSyn and Thy1-h[wt]αSyn, were selected. Both models have been shown to develop progressive motor and non-motor impairments relevant to PD [47, 48, 51, 64–69].
The current study concludes that a number of DA cell markers, general as well as subpopulation-specific, remain normal as compared to controls in both mouse lines when analyzed on mRNA level. In addition, endogenous Snca mRNA, encoding the αSyn protein in mice, remains normal in the presence of human SNCA in the transgenic mice. The same result was obtained for Thy1-h[A30P]αSyn mice, which express the A30P SNCA mutation, and Thy1-h[wt]αSyn mice, that express wild-type SNCA. The findings indicate a remarkable robustness of the midbrain DA system in mice in the presence of synucleinopathy. This should be taken into consideration when interpreting functional data obtained from these transgenic mouse lines. Clearly, it should be worthwhile to consider if behavioral and mechanistic phenotypes are consequences of disturbances in the midbrain DA system, or should be sought elsewhere in the brain of these transgenic mice. Further, while Thy1-h[A30P]αSyn and Thy1-h[wt]αSyn transgenic mouse lines were purposefully selected for analysis here, other animal models of synucleinopathy might be worth investigating in light of the new knowledge of DA cell heterogeneity, taking advantage of this molecular understanding of DA cell subtypes in the context of rodent models of neurodegenerative disease.
Several studies have described phenotypes in the midbrain DA system in αSyn transgenic mouse models of synucleinopathy using a range of molecular, biochemical, and behavioral methods [39, 40, 42–46, 49, 50, 64, 70–73]. However, the heterogeneity within SNc and VTA DA neurons, which has been increasingly revealed in the era of single cell transcriptomics, remains to be fully elucidated in mouse models of synucleinopathy. The Thy1-h[A30P]αSyn and Thy1-h[wt]αSyn transgenic mice have previously been shown to display DA neuron-related phenotypes, however, there have been some discrepancies between different studies. Electrophysiological analysis has identified a decrease in DA and TH content in the striatum of Thy1-h[wt]αSyn transgenic mice [50, 72], while no decrease in DA content was found in the striatum of Thy1-h[A30P]αSyn transgenic mice [48]. Further, decreased levels of TH protein, the rate limiting enzyme in DA synthesis, have been described for the Thy1-h[A30P]αSyn transgenic mouse line [49]. However, another more recent study showed that there are no significant differences between Thy1-h[A30P]αSyn transgenic mice and controls [74]. Analysis of TH protein levels in the striatum and SNc in Thy1-h[wt]αSyn transgenic mice aged between 2–8 months previously showed no significant differences compared to controls [64, 73], while decreased TH levels were observed in the striatum of 14 months old Thy1-h[wt]αSyn transgenic mice [72]. Also, it has been shown that DA neurons show transcriptional dysregulation at 3 months of age while increased levels of human αSyn in the SNc have been observed at 6 months with accumulation in DA neurons at 12 months in the Thy1-h[wt]αSyn transgenic mouse line [51, 73, 75]. Thus, concerning the midbrain DA system, the phenotype has remained elusive. There might be several reasons for discrepancy between studies, including genetic background, sex, age of mice analyzed, and different laboratory protocols and contexts, which may have led to different results. Now, in light of DA cell heterogeneity markers, the lack of detectable deficiency in the transgenic mice described in the present data set should motivate further study into mechanisms of action downstream of synucleinopathy.
The aspect of age and its relevance for the appearance of phenotypes in transgenic mouse models of PD have been discussed in literature and should be of interest to analyze further. Both mouse lines analyzed here have been carefully studied in previous work by several laboratories. The age-factor is of particular relevance in progressive neurodegenerative disorder as individual patients show different times of onset of symptoms. Analysis of even older mice than analyzed here might present a different phenotype in terms of mRNA patterns. In addition to age, also the sex of the mice might be an important factor. In human patients, men are slightly over-represented over women in PD [2]. For the Thy1-h[A30P]αSyn transgenic mouse line, both females and males were analyzed without any differences observed between sexes, in accordance with previous analysis stating a lack of sex-based differences in this mouse line [48, 49, 74]. Sex-based comparative analysis was not possible for the Thy1-h[wt]αSyn transgenic mouse line as only males were addressed (motivated in methods).
Several different animal models have been used for investigating pathological and mechanistic aspects of PD with varying degrees of similarity to PD and representing a varying range of symptom domains. In literature, some, but not all, mice models aiming to mimic αSyn-induced pathology give rise to PD-like symptoms [40, 42, 46, 71, 76]. The two transgenic mouse lines addressed here have been verified to show αSyn pathology. SNCA mutations, such as A30P, in humans lead to an aggressive form of PD [9, 77], while in the mouse model, the PD-like phenotype is not as aggressive and varies depending on the promotor used [40, 42, 76]. Studies on the Thy1-h[wt]αSyn mouse line has a tendency to describe it as a pre-manifest/slowly progressive model of PD [50, 72, 78–80]. Thus, the nature of the two transgenic models of synucleinopathy selected here is substantially different [52]. This is one of the reasons why these models would be particularly interesting to analyze in the context of DA cell heterogeneity. The Thy1-h[A30P]αSyn transgenic mice express the human SNCA gene carrying the A30P mutation under control of the Thy-1 promoter [47], while Thy1-h[wt]αSyn transgenic mice express the wild-type human SNCA gene under control of the Thy-1 promotor [51]. Previous studies have shown that both Thy1-h[A30P]αSyn and Thy1-h[wt]αSyn transgenic mouse lines develop motor impairments relevant to PD as early as 2–3 months of age, a phenotype that is progressive in both transgenic lines [49, 52, 64, 65, 70, 81–83]. Additionally, Thy1-h[wt]αSyn transgenic mice show sensorimotor impairments from 6 months of age [64, 70, 82]. Moreover, both transgenic mouse lines present behavioral phenotypes related to dysfunction in the cognitive and limbic systems. The Thy1-h[A30P]αSyn transgenic mice show impairment of spatial learning and memory as well as decreased fear conditioning [65, 84], while Thy1-h[wt]αSyn transgenic mice show cognitive impairments [79]. Thus, Thy1-h[A30P]αSyn and Thy1-h[wt]αSyn transgenic mouse lines show a broad range of neurochemical and behavioral phenotypes relevant to PD as well as other neurological and neuropsychiatric disorders.
The original publications describing the Thy1-h[A30P]αSyn and Thy1-h[wt]αSyn transgenic mouse lines, respectively, could verify transgene expression of human SNCA by biochemical analysis, mainly through immunohistochemistry and western blot analysis [47, 48, 51, 65–69]. Further, the presence of human SNCA in the Thy1-h[A30P]αSyn transgenic mouse line has been confirmed using northern blot and enzyme-linked immunosorbent assay (ELISA), while in the Thy1-h[wt]αSyn transgenic mouse line the presence of human SNCA has been confirmed using ribonuclease protection assay, quantitative PCR, and radioactive in situ hybridization analysis [47, 48, 51, 65–69, 73, 74]. Both transgenic mouse lines were shown to contain pathological forms of αSyn, including insoluble fibrils and oligomers, as well as protein accumulation in several different brain areas [48, 49, 51, 65, 85, 86] in and VTA [50, 51, 74]. Here, it was of interest assessing if detailed histological analysis of the recently described heterogeneity of DA neurons would reveal any transgene-induced alterations that could help advance current understanding of the relationship between αSyn pathology and degeneration of DA neurons, which in PD patient’s first occurs in the SNc, followed by the VTA. Using several markers representing cellular heterogeneity in SNc and VTA, this study cannot provide evidence of any alterations in mRNA level induced by transgenic human αSyn across the mouse brain. Instead, the patterns of distribution of DA neuron subpopulations, as defined by several mRNAs described in literature, were here demonstrated as robustly intact in both assessed mouse models of synucleinopathy.
In contrast to lack of mRNA alterations of dopaminergic markers, this study can confirm that both transgenic constructs are functional; high levels of human SNCA mRNA were identified throughout the brains of both models of synucleinopathy. This has indeed been validated previously in original publications of each mouse line using different types of analysis [47, 48, 51, 70]. In the current study, detailed histological analysis of the two mouse models also provided additional insight into Snca mRNA distribution patterns in brain anatomy. This information should be useful for further analysis of the DA system, but also far beyond. Here, a dual approach to detect Snca mRNA was implemented. Two different probes were generated, one designed to target both transgenic human SNCA and endogenous Snca mRNA (m/hSnca), and one designed to target only the endogenous Snca mRNA, a mSnca. The reason for not generating a human-selective probe was the lack of non-homogenous mRNA sequences allowing the synthesis of a probe that recognized the human SNCA CDS of the transgenic construct without recognizing the corresponding mouse CDS. Instead, by comparing the results from the two probes (human + mouse and mouse-only) in the same tissue of both control and transgenic mice, it was possible to visualize the differences in expression pattern and levels of distribution between endogenous Snca and transgenic SNCA. Comparing control and transgenic mice using the mouse-selective probe was important to also ascertain that transgenic expression of human SNCA did not alter the expression levels of endogenous Snca. Using only the m/hSnca probe, this would not have been possible. The m/hSnca probe only allows the detection of difference between control and transgenic mice, while not revealing if any effect represents the human SNCA or the mouse Snca. This provides an incentive to the generation of the two probes and explains how their comparison in controls and transgenes enabled conclusions as to the nature of mRNAs detected. Optimally, a human-selective probe would have been the most direct way of analysis. The current approach led to the conclusion that: i) The human SNCA transgene is expressed throughout the brain, ii) the endogenous Snca mRNA is not affected by the brain-wide distribution of transgenic human SNCA mRNA.
In the brain of control mice, endogenous Snca mRNA distribution was found throughout the AO, Ctx, hippocampus, and amygdala, in accordance with earlier analysis of αSyn protein distribution [87]. The method applied here detected endogenous Snca mRNA in both SNc and VTA, co-localizing almost entirely with Th mRNA. This was in accordance with previous data from C57BL6 mice, demonstrating the appearance of Snca mRNA at embryonic day 14.5 [53]. Further, the analysis showed endogenous Snca mRNA also in other areas of relevance to PD, such as the STN and pallidum, while no detection was observed in the SNr and GP. When addressing DA neurons of the SNc and VTA in Thy1-h[A30P]αSyn and Thy1-h[wt]αSyn transgenic mice, the results showed that endogenous Snca mRNA co-localized with Th to the same degree as in control mice. Further, it was not possible to detect an increase in m/hSnca probe labeling within Th+ neurons (a possible limitation of the method), or a decrease in the number of neurons in which the m/hSnca probe co-localized with Th. Thus, while the Thy-1 promoter strongly drives SNCA transgene expression throughout the brain, no apparent increase in Snca/SNCA mRNA is observed within DA neurons. This observation is in accordance with the described absence of activity of this promoter in SNc and VTA [57]. Indeed, while αSyn aggregates within DA neurons are a common feature of PD patients, the corresponding accumulation of αSyn aggregates in DA neurons of transgenic mouse models has been more challenging to model. Often, the presence of transgenic αSyn has either not been confirmed for some transgenic mouse lines or is not present [40, 42, 76]. Low levels of αSyn within DA neurons, while abundance in many other parts of the brain in Thy-1-driven transgenic mice, is in accordance with the activity of this promoter, and has already been discussed for the current two mouse lines [42, 52, 71, 88]. In this context, it is particularly interesting to note that several Th– neurons, presumably non-dopaminergic (per definition), were positive for m/hSnca probe labeling within SNc and VTA. Thus, ample neuronal populations throughout the brain, even in neurons directly neighboring DA neurons, are positive for the SNCA transgene, and thus putatively susceptible to synucleinopathy in these two mouse models.
In summary, the current study identified an abundance of SNCA mRNA distributed across the brain of mice of two transgenic models representing synucleinopathy but found no evidence of alterations in either endogenous Snca mRNA or several general and subpopulation-specific mRNA markers for SNc and VTA DA neurons.
Aldh1a1: aldehyde dehydrogenase 1 family member A1
Aldh1a1–: aldehyde dehydrogenase 1 family member A1-negative cells
Aldh1a1+: aldehyde dehydrogenase 1 family member A1-positive cells
AO: anterior olfactory area
Calb1: calbindin 1
CDS: coding sequence
CLi: caudal linear nucleus
Ctx: cortex
Cy3: cyanine 3
DA: dopamine
DAPI: 4’,6-diamidino-2-phenylindole
Dat: dopamine transporter
DIG: digoxigenin
FISH: fluorescent in situ hybridization
Girk2: G-protein-activated inward-rectifying potassium channel type 2
GP: globus pallidus
Grp: gastrin-releasing peptide
IF: interfascicular nucleus
m/hSnca: probe detecting human and mouse alpha-synuclein mRNA mouse-selective alpha-synuclein probe
mSnca: mouse-selective Snca probe
PBP: parabrachial nucleus
PD: Parkinson’s disease
PIF: parainterfascicular nucleus
PN: paranigral nucleus
RLi: rostral linear nucleus
RN: red nucleus
RRF: retrorubral field
SNc: substantia nigra pars compacta
SNCA: human alpha-synuclein
Snca: mouse alpha-synuclein
SNr: substantia nigra pars reticulata
STN: subthalamic nucleus
Th: tyrosine hydroxylase
Th–: tyrosine hydroxylase-negative cells
Th+: tyrosine hydroxylase-positive cells
Vglut2: vesicular glutamate transporter 2
Vmat2: vesicular monoamine transporter 2
VP: ventral pallidum
VTA: ventral tegmental area
ZI: zona incerta
αSyn: alpha-synuclein protein
The supplementary material for this article is available at: https://www.explorationpub.com/uploads/Article/file/100453_sup_1.pdf.
We thank Professor Philipp J. Kahle, Hertie Institute for Clinical Brain Research, and Professor Eliezer Masliah, National Institute of Aging, for generously providing the Thy1-h[A30P]αSyn and Thy1-h[wt]αSyn transgenic mouse lines, respectively.
BV: Formal Analysis, Investigation, Visualization, Validation, Writing—original draft, Writing—review & editing. SD: Formal Analysis, Investigation, Visualization, Validation. SEL and ER: Investigation. MI: Investigation, Writing—review & editing. ÅWM: Conceptualization, Formal Analysis, Investigation, Visualization, Writing—original draft, Writing—review & editing, Project administration, Resources, Supervision.
SD is the owner of Oramacell, Paris, France. All other authors declare no conflict of interest.
This study “Aldh1a1 and additional markers of dopamine cell heterogeneity in substantia nigra and ventral tegmental area identified as preserved in two transgenic α-synuclein mouse models of neurodegenerative disease” was approved by the local Uppsala Animal Ethical Committee. Ethical approval number: 5.8.18-08038/2018; 2018-06-21; Head investigator: Martin Ingelsson (Title: “Utveckling av nya behandlingsstrategier för Parkinsons sjukdom/Lewykroppsdemens och Alzheimers sjukdom”). All procedures were in accordance with Swedish regulations and European Union legislation.
Not applicable.
Not applicable.
Protocols for this study are published and included here, while data is shared by authors upon request. No specific material is relevant to this study; all can be purchased.
This work was supported by grants to ÅWM from the
© The Author(s) 2023.
Copyright: © The Author(s) 2023. This is an Open Access article licensed under a Creative Commons Attribution 4.0 International License (https://creativecommons.org/licenses/by/4.0/), which permits unrestricted use, sharing, adaptation, distribution and reproduction in any medium or format, for any purpose, even commercially, as long as you give appropriate credit to the original author(s) and the source, provide a link to the Creative Commons license, and indicate if changes were made.