Original Article

Affiliation:
1Division of Neuroscience and Experimental Psychology, Wolfson Molecular Imaging Centre, University of Manchester, M20 3LJ Manchester, UK
2Departments of Geriatric Medicine and Nuclear Medicine, Center for Translational Neuro- and Behavioral Sciences, University Hospital Essen, D-45147 Essen, Germany
Email: alex.gerhard@manchester.ac.uk
ORCID: https://orcid.org/0000-0002-8071-6062
Affiliation:
3Memory Assessment and Research Centre, Southern Health Foundation Trust, SO40 2RZ Southampton, UK
Affiliation:
1Division of Neuroscience and Experimental Psychology, Wolfson Molecular Imaging Centre, University of Manchester, M20 3LJ Manchester, UK
2Departments of Geriatric Medicine and Nuclear Medicine, Center for Translational Neuro- and Behavioral Sciences, University Hospital Essen, D-45147 Essen, Germany
4Department of Neurology, Center for Translational Neuro- and Behavioral Sciences, University Hospital Essen, D-45147 Essen, Germany
Affiliation:
1Division of Neuroscience and Experimental Psychology, Wolfson Molecular Imaging Centre, University of Manchester, M20 3LJ Manchester, UK
Affiliation:
1Division of Neuroscience and Experimental Psychology, Wolfson Molecular Imaging Centre, University of Manchester, M20 3LJ Manchester, UK
Affiliation:
1Division of Neuroscience and Experimental Psychology, Wolfson Molecular Imaging Centre, University of Manchester, M20 3LJ Manchester, UK
ORCID: https://orcid.org/0000-0002-7808-9207
Affiliation:
5Department of Neuroimaging, Institute of Psychiatry, Psychology & Neuroscience, King’s College London, WC2R 2LS London, UK
Affiliation:
6Clinical Neurosciences, Clinical and Experimental Sciences Academic Unit, Faculty of Medicine, University of Southampton, SO17 1BJ Southampton, UK
Affiliation:
1Division of Neuroscience and Experimental Psychology, Wolfson Molecular Imaging Centre, University of Manchester, M20 3LJ Manchester, UK
ORCID: https://orcid.org/0000-0002-8658-0151
Affiliation:
7EIMI, Westfälische Wilhelms University Münster, D-48149 Münster, Germany
8Department of Geriatric Medicine, Johanniter Krankenhaus, 53111 Bonn, Germany
Affiliation:
3Memory Assessment and Research Centre, Southern Health Foundation Trust, SO40 2RZ Southampton, UK
6Clinical Neurosciences, Clinical and Experimental Sciences Academic Unit, Faculty of Medicine, University of Southampton, SO17 1BJ Southampton, UK
Explor Neurosci. 2023;2:52–66 DOI: https://doi.org/10.37349/en.2023.00012
Received: May 29, 2022 Accepted: September 16, 2022 Published: March 26, 2023
Academic Editor: Aurel Popa-Wagner, University of Medicine and Pharmacy Craiova, Romania
Aim: Microglial activation is increasingly recognised as a factor in the progression of Alzheimer’s disease (AD) and may be modified by systemic inflammatory signals including serum tumour necrosis factor (TNF)-α. The aim was to investigate whether blockade of peripheral TNF-α with peripheral inhibitors such as etanercept reduces microglial activation in prodromal AD.
Methods: A one-year, multi-centre, phase 2, double-blind randomised placebo-controlled trial (RPCT) was performed, to assess the effect of weekly 50 mg s.c. etanercept in amyloid positive mild cognitive impaired participants on the change in microglial activation as measured by [11C](R)-PK11195 positron emission tomography (PET). Secondary objectives were to ascertain the change in cortical amyloid load on PET and the change in the Montreal Cognitive Assessment (MoCA).
Results: Forty-four subjects consented to the study. Twenty-eight subjects failed screening including six subjects who were amyloid negative on visual read of the AmyvidTM PET scans. Thirteen of sixteen subjects with mild cognitive impairment (MCI) due to AD completed the baseline [11C](R)-PK11195 PET scan and were randomised to either placebo or etanercept. Three patients who consented were not able to complete screening due to early termination of the study following delays in study commencement. [11C](R)-PK11195 binding potential (BP) at baseline showed an almost global increase in MCI patients as compared to age-matched controls. Compliance to medication was high over the twelve-month trial period with etanercept being well tolerated. The study did not achieve statistical power to show a significant effect of etanercept over 52 weeks in the limited number of patients with MCI on microglial activation as measured by [11C](R)-PK11195 PET. Overall uptake of florbetapir in the follow up (FU) scans remained stable. The study was not powered to show statistical differences in psychometric ratings between groups.
Conclusions: This study did not show evidence that treatment with etanercept over one year would modulate microglial activation in amyloid positive MCI patients (EudraCT identifier: 2015-002145-63, https://www.clinicaltrialsregister.eu; International Standard Randomised Controlled Trial Number identifier: ISRCTN12472821, https://www.isrctn.com).
Microglial activation and neuroinflammatory changes are increasingly recognised as an important part of the pathophysiology of Alzheimer’s disease (AD) [1]. Normally microglia are quiescent cells with ramifications monitoring the environment and represent the resident immuno-competent cells of the central nervous system [2]. They respond to a variety of pathological stimuli by swelling and developing phagocytic properties, and express cytokines and other immunologically relevant molecules [3]. Since these cells react before any signs of tissue damage are apparent, they can provide an early marker of active disease. This process is often described as “microglial activation” or “reactive microgliosis” and has been shown to be present in neurodegenerative disorders including AD, where increased microglial activation has been found especially in the hippocampus and temporal cortex [4].
One of the molecules selectively expressed by activated microglia is the mitochondrial translocator protein 18kDa (TSPO) [formerly called mitochondrial peripheral benzodiazepine binding site (PBBS)] [5]. In lesions with an intact blood-brain barrier preventing invasion of blood-borne cells, activated microglia are the primary source of TSPO expression. (R)-PK11195 [1-(2-chlorophenyl)-N-methyl-N-(1-methylpropyl)-3-isoquinoline carboxamide] is a selective ligand for TSPO and, when labelled with [11C], can be used as a positron emission tomography (PET) tracer [6]. Although PET has some methodological challenges, it offers unique opportunities to measure the effects of potential disease modifying agents on a range of AD neuropathologies including microglial activation [7, 8]. The majority of these PET studies have shown a relatively widespread increase of microglial activation in amyloid positive mild cognitive impairment (MCI) patients with the cingulate gyrus, temporal, parietal, and frontal cortical regions being targeted [9, 10].
There is uncertainty as to what extent microglial activation is a reaction to amyloid and tau deposition or whether it might be a primary cause of neurodegeneration in AD.
Another open question in this context is the contribution of peripheral inflammation towards microglial activation and disease progression [8]. In humans, low levels of chronic systemic inflammation seem to be associated with microglial activation as measured with [11C](R)-PK11195 PET [11]. Additionally, we have shown that in patients with AD, modestly increased serum tumour necrosis factor (TNF)-α levels were associated with an increased rate of cognitive decline [12]. Subsequently in a randomised, placebo-controlled, double-blind, phase 2 trial, we have been able to demonstrate that the TNF-α inhibitor etanercept is well tolerated in patients with AD [13]. On the basis of these findings, we hypothesised that in MCI due to AD, elevated systemic levels of TNF-α cause partially activated or primed microglial cells to become fully activated, and that this process might be modulated by the administration of a peripheral TNF-α inhibitor, etanercept. We therefore conducted a clinical trial aiming to investigate whether etanercept can influence microglial activation and potentially the clinical time course in early AD.
Specifically, our primary objective was to ascertain the change in microglial activation on [11C](R)-PK11195 PET scans from baseline to the final imaging visit in the treatment group (etanercept) compared to a placebo group. Our secondary objectives were to ascertain the change in cortical amyloid load on AmyvidTM PET scans from baseline to the final imaging visit in the treatment group compared to the placebo group and to ascertain the change in a primary cognitive outcome measure, the Montreal Cognitive Assessment (MoCA), from baseline to final treatment visit in the treatment group compared to the placebo group.
This was an investigator-initiated, one-year, multi-centre, phase 2, double-blind randomised placebo-controlled trial (RPCT) to assess the effect of weekly 50 mg s.c. etanercept in amyloid positive MCI participants on the change in microglial activation as measured by [11C](R)-PK11195 PET scans.
At screening, eligible participants had to be aged 50 years to 90 years, fulfil the National Institute on Aging-Alzheimer’s Association (NIA-AA) criteria for the diagnosis of MCI due to AD [14], have a modified Hachinski Scale score of less than 4 points [15], have a study partner spending at least 8 h a month with the subject, and be capable of giving informed consent. Participants had to have been on a stable medication regime for more than 3 months prior to screening. Patients with prior exposure to amyloid vaccines, monoclonal antibodies, or i.v. immunoglobulins for the treatment of AD were excluded. Participants with rheumatoid arthritis, psoriasis, psoriatic arthritis, or ankylosing spondylitis, or those taking anti-TNF-α agents, or immunosuppressive agents were excluded. Participants with known contraindications (active infections) or cautions [previous exposure to tuberculosis, heart failure (New York Heart Association, grades 3 and 4), pre-malignant conditions, and active malignancy within the past 5 years] to the use of etanercept were excluded. Participants with significant cortical or basal ganglia infarct on magnetic resonance imaging (MRI) scanning or a negative amyloid PET scan were also excluded.
Healthy control subjects who were examined as a comparator group for the [11C](R)-PK11195 PET did not have a history of severe systemic illness like kidney, liver, or heart failure; and did not take drugs that might interfere with PK11195 binding (e.g., benzodiazepines) or that are known to suppress microglial activation (e.g., minocycline) or possibly suppress microglial activation (e.g., anti-inflammatory drugs). They did not suffer from severe neurological illness, depression, psychosis, or substance abuse. They all had a physical and neurological clinical exam without any significant findings.
ACE Pharmaceuticals BV (Zeewolde, the Netherlands) manufactured the placebo and packaged both the study medication and placebo to ensure blinding. A computer was used to generate a simple random allocation sequence (1:1), stratified in blocks of 4. The investigators had no knowledge of the allocation sequence, which remained concealed throughout the study. ACE Pharmaceuticals loaded etanercept or placebo vials into serially numbered containers according to the allocation sequence. The loaded containers and the interventions inside them were identical in appearance and consistency to ensure concealment of the allocation sequence from the investigators. After successful screening, participants were assigned the container with the next available serial number in strict chronological order. Study drug was administered by weekly s.c. injection at home or in the clinic by study team health professionals who were blinded to treatment allocation.
Following consent, participants underwent a screening period including initial tuberculosis and infectious disease screen (i.e. a chest radiograph, a QuantiFERON-TB Gold assay, a hepatitis B surface antigen test, and a mid-stream urine test).
Imaging took place one week prior to the baseline clinic visit (i.e. before randomisation) and one week before the week 52 clinic visit (i.e. before drug withdrawal). Imaging procedures were conducted in line with the study protocol and previously established imaging protocols. Participants underwent a T1-weighted and inversion-recovery structural, volumetric MRI scan for grey-white matter segmentation, intra-individual co-registration with the PET scans and volumetric studies on the 1.5T MRI scanner. Additionally, a T2-weighted sequence for assessment of potential confounding pathology was performed.
Florbetapir F 18 (AmyvidTM) PET imaging was performed in a high resolution research scanner (Siemens HRRT; Siemens, Munich, Germany) in accordance with a slightly modified previously established protocol for this procedure at the Wolfson Molecular Imaging Centre (WMIC) of the University of Manchester [16] and a target dose of 370 megabecquerel (MBq). Emission data over 60 min were acquired in list mode. After reconstruction of the image, the amyloid scan was visually assessed by a trained reader [17]. Visually amyloid positive individuals proceeded to [11C](R)-PK11195 PET imaging. Additional semiquantitative analysis was performed by calculating target-to-cerebellar ratios from the decay corrected summed images 50–60 min post injection using SPM12 for grey/white matter segmentation and a probabilistic atlas for region of interest definition [16, 18].
[11C](R)-PK11195 PET imaging was performed using the high resolution research scanner in accordance with a previously approved protocol for this procedure at the WMIC (ARSAC 595/3586/24989). Approx. 7 min after the start of the emission scan, 740 MBq [11C](R)-PK11195 were injected as a single bolus within 30 s followed by an infusion line flush with 15–20 mL of saline. Emission data over 60 min were acquired in list mode. Reconstruction of images followed established methods with binding potential (BP) values and further quantitative analysis was performed using a simplified reference tissue model and supervised cluster analysis as previously described [19]. Parametric BP images were co-registered to the patients’ MRIs (Figure 1). Volumes of interest (VOIs) were outlined on the MRI using the probabilistic atlas and applied to the corresponding BP maps using Analyze software [20]. BP maps were further interrogated and baseline and follow up (FU) scans were compared using a region of interest approach.
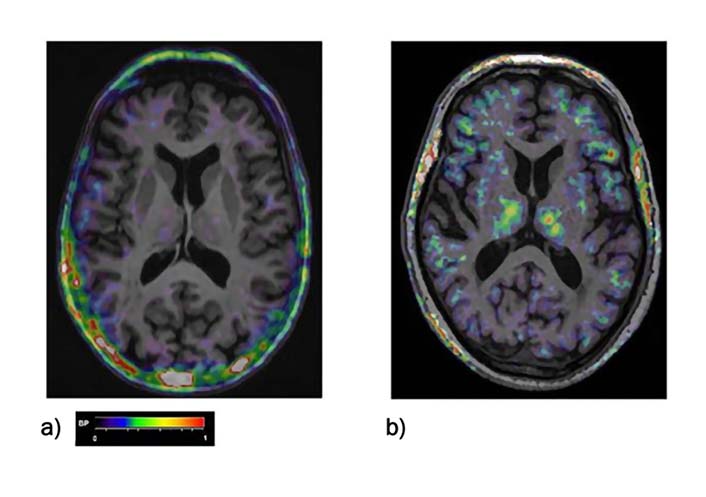
[11C](R)-PK-11195 PET BP maps co-registered to the individual MRI scan of a) a healthy control, b) of a MCI patient. BP increases can be seen fronto-temporal areas as well as in the thalamus. The color bar denotes BP values from 0 to 1
Participants fulfilling all the inclusion and exclusion criteria received etanercept 50 mg or placebo subcutaneously once per week for 52 weeks. This was followed by a 4-week wash-out period. Clinic visits took place at screening, baseline, week 4, week 13, week 26, week 39, week 52, and 4 weeks after the last study drug injection (week 56). During all visits psychometric evaluation, adverse event monitoring, blood and urine collection took place. The principal psychometric measure was the MoCA [21], but additional psychometric measures included the Free and Cued Selective Reminding Test (FCSRT) [22], the Repeatable Battery for the Assessment of Neuropsychological Status (RBANS) [23], and the Alzheimer’s Disease Cooperative Study Activities of Daily Living (ADCS-ADL) Inventory. Adverse events were recorded as definitely related, probably related, possibly related, unlikely to be related, or unrelated to the blinded study intervention. Participants experiencing a serious adverse event or recurrent infections were withdrawn from treatment but had FU PET and MRI scans wherever possible. Bloods were taken for routine laboratory assessments and serum inflammatory markers. Serum samples for inflammatory markers were immediately placed on ice and stored within 2 h at –80°C. Samples were analyzed blind to the treatment allocation using a V-PLEX assay [Meso Scale Discovery (MSD), Rockville, US]. A protocol provided by MSD for custom assays was used with no major modifications. Eight serum inflammatory markers were measured: interferon (IFN)-γ; interleukin (IL)-10, IL-12, IL-6, IL-8; TNF-α; transforming growth factor (TGF)-β and C-reactive protein (CRP). Urine was tested for infection.
Patients who withdrew from the study before scheduled visits were seen within one week of withdrawal for an early termination visit.
The primary outcome measure was microglial activation as measured by [11C](R)-PK11195 PET scan. The null hypothesis was that participants taking etanercept would not demonstrate a 50% reduction in microglial activation as measured on a [11C](R)-PK11195 PET scan, after one year of treatment. Thirty-four to thirty-eight participants completing the study gave 80–90% power; 5% specificity to determine a 50% change in microglial binding between the control and treatment group based on [11C](R)-PK-11195 PET data [24]. Allowing for 15–20% dropout required the recruitment of 46 participants satisfying the core clinical criteria for randomisation. We anticipated that 60% of subjects would be positive for cortical amyloid based on AmyvidTM PET evidence thus requiring 75 subjects to be consented into the study after successful screening.
For changes in [11C](R)-PK11195 PET non-parametric Kruskal-Wallis tests were used for comparison of regional BP values and their changes from baseline to FU between treatment groups. Spearman rank correlation was used to check their relationship with clinical parameters [age, disease duration, disease severity, and Mini Mental State Test (MMST)]. Mixed models with individuals as random variable and group, time, and region as fixed variables were used to check potential interactions between regional changes and treatment. Calculations were performed using R-Studio (The R Foundation for Statistical Computing, R version 3.5.1, 2018).
The study was not powered to allow determination of change in amyloid binding or cognitive change which were secondary outcomes and considered exploratory. Amyloid binding change was determined using the same statistical methods used for analysis of changes in [11C](R)-PK11195 PET. Exploratory clinical psychometric efficacy analyses were performed on observed cases, defined as all participants who received at least one dose of study medication, and who provided data at baseline, week 13, week 26, week 39, and week 52, and on intention to treat last observation carried forward (ITT-LOCF) cases, defined as all participants who received at least one dose of study medication, and had at least one post-randomisation assessment. Study demographics, efficacy measure outcomes, and serum inflammatory proteins were assessed for normality using quantile-quantile (Q-Q) plots. Changes in psychometric measures and serum inflammatory protein levels between the 2 intervention groups were measured by unpaired t test and linear regression for parametric variables or Mann-Whitney U test (MWU) for non-parametric variables. Clinical psychometric outcomes were adjusted for baseline age, sex, and baseline psychometric score.
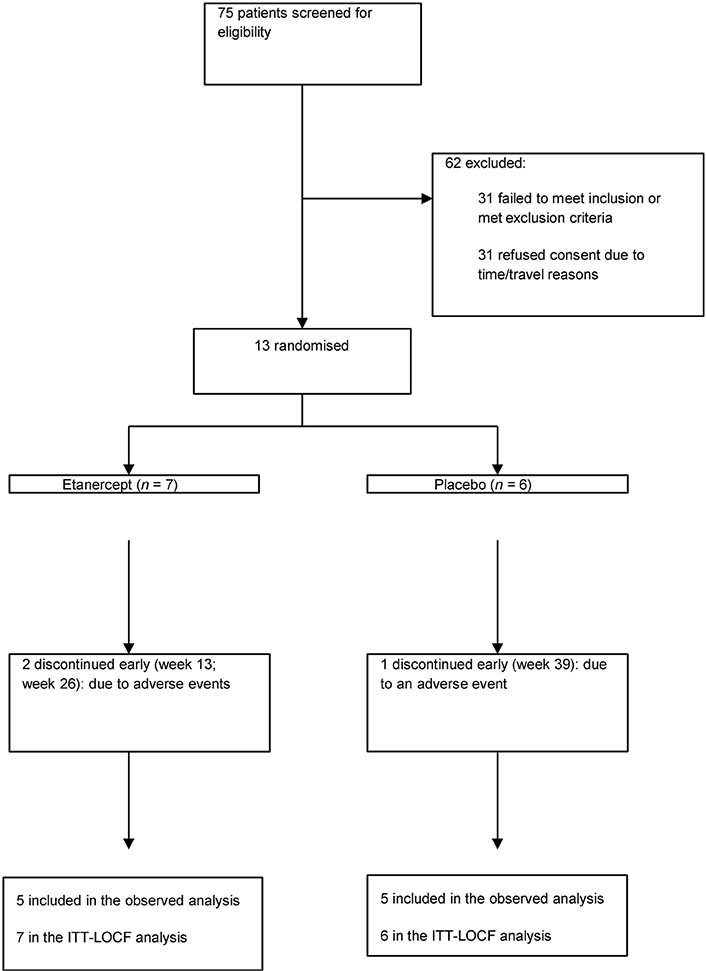
Participant disposition is detailed in Figure 2. Between Nov 2015 and Feb 2017, a total of 75 patients with amnestic MCI were screened at the Memory Assessment and Research Centre, Southampton, UK, and the Institute of Brain, Behaviour and Mental Health, University of Manchester, Manchester, UK of whom 31 subjects declined to take part after interview due to the time commitment/overnight stay requirement of the study; 44 subjects consented to the study and underwent full screening. Twenty-eight subjects failed screening procedures. Reasons for screen failure included MoCA screen failure (n = 5), prior exposure to tuberculosis or latent tuberculosis (n = 4), abnormal chest X-ray (CXR) unspecified (n = 1); diagnosed with dementia with Lewy bodies (DLB, n = 1); previously undiagnosed malignancy (n = 2), psychiatric disease (n = 2), skin disease (n = 1), cardiac disorder (n = 1); low platelet count (n = 1); low B12 (n = 1); active infection (n = 1). A total of 19 patients proceeded to the first MRI and Florbetapir F 18 (AmyvidTM) PET imaging after clinical screening. Neuroimaging took place at the WMIC, University of Manchester, Manchester, UK. Six patients were found to be amyloid negative while the others were amyloid positive on visual read of the PET scans [17]. Three patients who consented were not able to complete screening due to early termination of the study. All 13 patients completed the baseline [11C](R)-PK11195 PET scan without complications. Mean injected activity was 679.31 MBq ± 123.82 MBq [standard deviation (SD)].
A total of 13 patients with a clinical diagnosis of MCI due to AD received either placebo or 50 mg of etanercept (weekly s.c. injection) over one year. The mean age of the participants entering the study was 74.1 (SD 6.4) years, with the majority [9 (69%)] being men. Randomisation of patients at baseline led to two treatment groups that were similar with respect to demographic details and psychometric test scores (P values in all cases > 0.1 except FCSRT P = 0.05, Table 1).
Characteristics of patients entering the randomisation phase
| Characteristics | Etanercept 50 mg (n = 7) | Placebo (n = 6) | Mean difference (95% CI) or χ2 P value |
|---|---|---|---|
| Mean age, years (SE) | 73.4 (2.3) | 74.8 (2.9) | 1.4 (−6.7 to 9.5) yrs P = 0.7 |
| Men, n (%) | 5 (71) | 4 (66) | χ2 0.03 P = 0.9 |
| Disease duration, years (SE) | 3.4 (1.2) | 5.3 (1.1) | 1.9 (−1.8 to 5.6) yrs P = 0.3 |
| MoCA pts (SE) | 21.1 (1.6) | 24.7 (1.0) | 3.5 (−0.6 to 7.6) pts P = 0.09 |
| FCSRT pts (SE) | 36.4 (4.3) | 46.8 (1.0) | 10.4 (−0.03 to 20.8) pts P = 0.051 |
| RBANS pts (SE) | 82.0 (2.9) | 88.3 (4.6) | 6.3 (−0.5 to 18.0) pts P = 0.3 |
| ADCS-ADL MCI pts (SE) | 38.9 (2.9) | 43.5 | 4.6 (−3.1 to 12.4) pts P = 0.2 |
CI: confidence interval; pts: patients; se: standard error; yrs: years
Compliance with medication was high over the twelve-month trial period (overall median 94%). There was no significant difference in the median compliance frequency between treatment groups {etanercept 94% [interquartile range (IQR) 56–96%] vs. placebo 94% (IQR 88–98%); MWU P = 0.5}. A total of 105 adverse events occurred during the 52-week randomisation phase of the study. Adverse events grouped by system are summarised in Table 2. There were 38 (36%) adverse events in 7 participants in the etanercept group and 67 (64%) in 6 participants in the placebo group. There were six serious adverse events in five participants. In the treatment arm two participants had a diagnosis of squamous cell carcinoma, in one participant study drug was stopped at 26 weeks and in the other study drug was stopped at 52 weeks. Both participants completed final imaging. In the placebo arm one participant developed a severe urinary tract infection and back pain, study drug was stopped at 39 weeks and back pain prevented final imaging. One participant in the placebo arm had a transient ischaemic attack thought unlikely to be related to treatment; study drug was continued and patient proceeded to final scanning. One participant in the placebo arm had a lower respiratory tract infection, study drug was withheld briefly and the patient proceeded to final scanning.
Incidence of adverse events by disease or event category
| Disorders | Adverse events [number of events (number of participants)] | |
|---|---|---|
| Etanercept (n = 7) | Placebo (n = 6) | |
| All disorders | 38 events | 67 events |
| Blood and lymphatic disorders [bruising of arm, bruising (2)] | 0 (0) | 3 (1) |
| Cardiac disorders (chest tightness, bundle branch block right) | 0 (0) | 2 (1) |
| Congenital, familial, and genetic disorders | 0 (0) | 0 (0) |
| Ear and labyrinth disorders | 0 (0) | 0 (0) |
| Endocrine disorders | 0 (0) | 0 (0) |
| Eye disorders (retinal tear, vision disorder) | 2 (2) | 0 (0) |
| Gastrointestinal disorders (dyspepsia, diarrhoea, constipation) | 6 (4) | 1 (1) |
| General disorders and administration site injections [pain (3), hay fever (2), feeling cold, blister, injection site discomfort, injection site bruising, giddiness, haematoma] | 5 (3) | 10 (4) |
| Hepatobiliary disorders (hypertension) | 1 (1) | 0 (0) |
| Immune system disorders | 0 (0) | 0 (0) |
| Infections and infestations [cellulitis, skin bacterial infection (2)] | 2 (2) | 1 (1) |
| Injury, poisoning, and procedural complications [falls (5), skin abrasion, corneal abrasion, vitreous detachment, injury, tooth fracture] | 4 (3) | 6 (4) |
| Investigations (itching, irregular pulse, irritable mood) | 1 (1) | 2 (2) |
| Metabolism and nutrition disorders (mouth ulcer, muscle pain) | 0 (0) | 2 (1) |
| Musculoskeletal and connective tissue disorders [neck pain, back pain (4), musculoskeletal stiffness] | 1(1) | 6 (3) |
| Neoplasms, benign, and malignant [squamous cell carcinoma (2)] | 2 (2) | 0 (0) |
| Nervous system disorders [insomnia (2), headache (3), migraine, diplopia, numbness localised, dizziness (2), anxiety, transient cerebrovascular event] | 5 (4) | 7 (5) |
| Pregnancy, puerperium, and perinatal conditions | 0 (0) | 0 (0) |
| Psychiatric disorders [Alzheimer’s dementia (2), low mood, Raynaud’s disease] | 2 (2) | 2 (2) |
| Renal and urinary disorders [urinary tract infection (5), nocturia] | 1 (1) | 5 (3) |
| Reproductive system and breast disorders | 0 (0) | 0 (0) |
| Respiratory, thoracic, and mediastinal disorders [viral upper respiratory tract infection (6), upper respiratory tract infection (2), lower respiratory tract infection, coughing, and associated symptoms (3), shortness of breath)] | 3 (1) | 10 (5) |
| Skin and s.c. tissue disorders [herpes simplex (2), rash papular, rash erythematous, acne, dry skin, skin tear] | 2 (2) | 5 (3) |
| Social circumstances | 0 (0) | 0 (0) |
| Surgical and medical procedures (eye laser surgery, carpal tunnel syndrome surgery, tooth pain, tooth extraction, toe surgery) | 1 (1) | 5 (3) |
| Vascular disorders | 0 (0) | 0 (0) |
Adverse events include definitely, probably, possibly, unlikely, and not thought to be related to the study intervention. Participants could report multiple events in any category. Adverse drug reactions are coded by the Medical Dictionary for Regulatory Activities (MedDRA) preferred term (MedDRA 15.0)
Of the 13 patients randomised 3 participants did not have final image data analysis. As previously stated one patient in the placebo arm did not return for scanning due to a serious adverse event (back pain). In addition, one patient in the placebo arm was found to have a baseline [11C](R)-PK11195 PET scan that was technically faulty and another in the active arm had a positive visual read amyloid scan but which was found to be a false positive on quantitative analysis. Of the 10 participants who completed baseline and final imaging, six were taking active treatment and four were taking placebo.
The region of interest analysis of the [11C](R)-PK11195 BP at baseline showed an almost global increase in MCI patients as compared to age-matched controls. The increases were however only borderline significant (Figure 1 and Table 3).
Regional and global PK11195 BP values for the treatment and placebo group at baseline and FU as well as for healthy controls
| Treatment | Placebo | Healthy control values | ||||||||||||||||
|---|---|---|---|---|---|---|---|---|---|---|---|---|---|---|---|---|---|---|
| Baseline PK-11195 BP | Participant No. | 1 | 3 | 6 | 8 | 9 | 10 | Participant No. | 2 | 4 | 5 | 7 | ||||||
| Regions | Mean | SD | Regions | Mean | SD | Mean | SD | |||||||||||
| Frontal lobe | 0.0985 | 0.0968 | −0.0996 | 0.1184 | 0.1046 | 0.0226 | 0.0569 | 0.0837 | Frontal lobe | 0.0310 | 0.0064 | 0.1226 | 0.0850 | 0.0613 | 0.0524 | 0.0394 | 0.0487 | |
| Parietal lobe | 0.0752 | 0.0800 | −0.1212 | 0.0792 | 0.0627 | 0.0124 | 0.0314 | 0.0790 | Parietal lobe | −0.0693 | −0.0276 | 0.0732 | 0.0216 | −0.0005 | 0.0616 | 0.0192 | 0.0420 | |
| Temporal lobe | −0.0888 | −0.0201 | −0.1089 | 0.0659 | 0.0579 | 0.0034 | −0.0162 | −0.0725 | Temporal lobe | −0.0013 | −0.0069 | 0.0235 | 0.0442 | 0.0149 | 0.0236 | −0.0602 | 0.0429 | |
| Occipital lobe | −0.0361 | 0.0397 | −0.0879 | 0.0668 | 0.0584 | 0.0572 | 0.0164 | 0.0635 | Occipital lobe | 0.0262 | 0.0011 | 0.0804 | 0.0522 | 0.0400 | 0.0341 | −0.0030 | 0.0589 | |
| Insula | −0.0033 | 0.1431 | −0.1148 | 0.0960 | 0.1180 | 0.0576 | 0.0302 | 0.1045 | Insula | −0.0924 | −0.0263 | 0.1132 | 0.1187 | 0.0283 | 0.1048 | −0.0409 | 0.0461 | |
| Anterior cingulate | 0.1137 | 0.0753 | −0.1054 | 0.0758 | 0.1409 | 0.0167 | 0.0528 | 0.0881 | Anterior cingulate | 0.0400 | 0.0234 | 0.1431 | 0.1476 | 0.0885 | 0.0660 | 0.0086 | 0.0435 | |
| Posterior cingulate | 0.1142 | 0.1112 | −0.1398 | 0.1435 | 0.1565 | 0.0736 | 0.0765 | 0.1098 | Posterior cingulate | −0.0614 | 0.0640 | 0.1786 | 0.1193 | 0.0751 | 0.1023 | 0.0074 | 0.0348 | |
| Thalamus | 0.0468 | 0.2685 | −0.0055 | 0.2671 | 0.1891 | 0.0879 | 0.1423 | 0.1163 | Thalamus | 0.0715 | 0.1326 | 0.2627 | 0.2468 | 0.1784 | 0.0919 | 0.0814 | 0.0533 | |
| Cerebellum | −0.0391 | 0.0397 | −0.0964 | 0.0532 | −0.0139 | −0.0610 | −0.0196 | 0.0580 | Cerebellum | 0.0034 | −0.0094 | 0.0438 | 0.0173 | 0.0138 | 0.0228 | −0.0308 | 0.0272 | |
| Brainstem | −0.0174 | 0.0859 | −0.0272 | 0.1674 | 0.1482 | 0.0679 | 0.0708 | 0.0812 | Brainstem | 0.1731 | 0.1178 | 0.1750 | 0.1952 | 0.1653 | 0.0332 | 0.0321 | 0.0264 | |
| Global mean | 0.0234 | 0.0646 | −0.1025 | 0.0896 | 0.0722 | 0.0100 | 0.0262 | 0.0699 | Global mean | 0.0015 | −0.0010 | 0.0858 | 0.0600 | 0.0366 | 0.0433 | 0.024 | 0.038 | |
| FU PK-11195 BP | Participant No. | 1 | 3 | 6 | 8 | 9 | 10 | Participant No. | 2 | 4 | 5 | 7 | ||||||
| Regions | Mean | SD | Regions | Mean | SD | |||||||||||||
| Frontal lobe | 0.0672 | 0.0990 | −0.0548 | 0.1372 | 0.1108 | −0.0514 | 0.0513 | 0.0840 | Frontal lobe | 0.0588 | 0.0167 | 0.0791 | −0.0149 | 0.0349 | 0.0422 | |||
| Parietal lobe | 0.0422 | 0.0760 | −0.0979 | 0.1056 | 0.0651 | −0.0572 | 0.0223 | 0.0810 | Parietal lobe | 0.0618 | −0.0186 | 0.0450 | −0.0543 | 0.0085 | 0.0543 | |||
| Temporal lobe | −0.1016 | −0.0157 | −0.0538 | 0.0985 | 0.0597 | −0.0507 | −0.0106 | 0.0757 | Temporal lobe | −0.0178 | −0.0293 | −0.0106 | −0.0668 | −0.0311 | 0.0250 | |||
| Occipital lobe | −0.0664 | 0.0348 | 0.0108 | 0.1189 | 0.0845 | −0.0108 | 0.0286 | 0.0667 | Occipital lobe | 0.0794 | −0.0634 | 0.0150 | −0.0535 | −0.0056 | 0.0665 | |||
| Insula | −0.0306 | 0.0741 | −0.0504 | 0.1137 | 0.1236 | −0.1063 | 0.0207 | 0.0958 | Insula | 0.0652 | −0.0445 | 0.0525 | −0.0195 | 0.0134 | 0.0537 | |||
| Anterior cingulate | 0.0920 | 0.0360 | −0.0878 | 0.0821 | 0.1500 | −0.0702 | 0.0337 | 0.0947 | Anterior cingulate | 0.0279 | 0.0420 | 0.1234 | 0.0285 | 0.0555 | 0.0458 | |||
| Posterior cingulate | 0.0974 | 0.0712 | −0.0684 | 0.1865 | 0.1669 | −0.0151 | 0.0731 | 0.1001 | Posterior cingulate | 0.1174 | 0.0263 | 0.1364 | −0.0175 | 0.0657 | 0.0734 | |||
| Thalamus | 0.0216 | 0.1851 | 0.1608 | 0.2551 | 0.1889 | 0.0544 | 0.1443 | 0.0887 | Thalamus | 0.2287 | 0.1225 | 0.1861 | 0.1495 | 0.1717 | 0.0461 | |||
| Cerebellum | −0.0843 | −0.0402 | −0.0119 | 0.1223 | 0.0089 | −0.0695 | −0.0125 | 0.0746 | Cerebellum | 0.0251 | −0.0422 | 0.0588 | −0.0525 | −0.0027 | 0.0535 | |||
| Brainstem | −0.0178 | 0.0893 | 0.1294 | 0.2731 | 0.1447 | 0.0080 | 0.1045 | 0.1050 | Brainstem | 0.0948 | 0.0697 | 0.2253 | 0.0702 | 0.1150 | 0.0745 | |||
| Global mean | 0.0046 | 0.0517 | 0.0456 | 0.1236 | 0.0810 | −0.0489 | 0.0277 | 0.0698 | Global mean | 0.0480 | −0.0127 | 0.0529 | −0.0363 | 0.0130 | 0.0444 | |||
When comparing the regional and global PK11195 for these 10 patients at baseline and FU after one year, there were no significant differences (Figure 3, Table 3) and microglial activation remained stable overall in the placebo as well as in the treatment group. Global average BP was 0.0262 (SD 0.0699) before and 0.0277 (SD 0.0698) after treatment, and 0.0366 (SD 0.0433) before and 0.0130 (SD 0.0444) after placebo. Neither group differences (baseline, FU, or change) were significant. There were no significant interactions between treatment groups (treatment and placebo), time (baseline and FU), and brain regions.
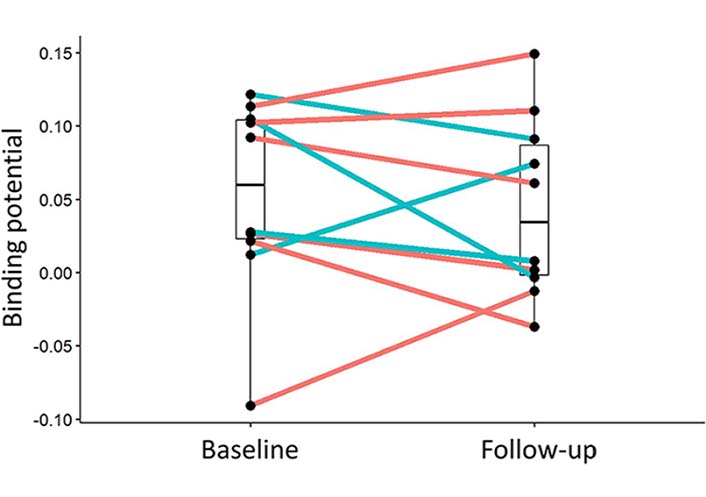
Change of PK11195 BP between baseline and FU (after one year) for the individual participants. In blue active drug etanercept, in red placebo. Overall the signal remained stable in both groups. Median and quartile limits are depicted
The quantitative analysis of amyloid retention confirmed a higher global florbetapir uptake in the patients that were rated visually as “amyloid positive” (median 1.574, range 1.385 to 1.918) compared to the ones that were visually rated as “amyloid negative” (median 1.170, range 0.963 to 1.359, P = 0.0002). This increase was not distributed equally throughout the cortical regions and showed the highest uptake in frontal lobe and cingulate gyrus. Overall uptake values of florbetapir in the FU scans remained stable and did not show significant differences between the treatment and control groups (Table 4).
Regional AmyvidTM binding ratios (with cerebellum as reference region) at baseline and FU for the treatment and placebo group
| Treatment | Placebo | |||||||||||||||
|---|---|---|---|---|---|---|---|---|---|---|---|---|---|---|---|---|
| Baseline AmyvidTM | Participant No. | 1 | 3 | 6 | 8 | 9 | 10 | Participant No. | 2 | 4 | 5 | 7 | ||||
| Regions | Mean | SD | Regions | Mean | SD | |||||||||||
| Frontal lobe | 1.794 | 2.316 | 1.832 | 2.146 | 1.778 | 2.057 | 1.987 | 0.221 | Frontal lobe | 1.623 | 2.056 | 1.759 | 1.810 | 1.812 | 0.181 | |
| Parietal lobe | 1.822 | 2.300 | 1.703 | 2.015 | 1.756 | 2.080 | 1.946 | 0.227 | Parietal lobe | 1.503 | 1.938 | 1.810 | 1.735 | 1.747 | 0.183 | |
| Temporal lobe | 1.444 | 1.970 | 1.679 | 1.644 | 1.551 | 1.737 | 1.671 | 0.179 | Temporal lobe | 1.373 | 1.630 | 1.527 | 1.562 | 1.523 | 0.109 | |
| Occipital lobe | 1.291 | 1.869 | 1.885 | 1.445 | 1.511 | 1.510 | 1.585 | 0.240 | Occipital lobe | 1.252 | 1.536 | 1.546 | 1.531 | 1.466 | 0.143 | |
| Insula | 1.585 | 2.091 | 1.751 | 1.855 | 1.679 | 1.751 | 1.785 | 0.174 | Insula | 1.414 | 1.785 | 1.551 | 1.724 | 1.619 | 0.169 | |
| Anterior cingulate | 1.828 | 2.539 | 1.961 | 2.190 | 1.906 | 2.224 | 2.108 | 0.263 | Anterior cingulate | 1.774 | 2.299 | 2.019 | 2.053 | 2.036 | 0.215 | |
| Posterior cingulate | 2.008 | 2.667 | 1.863 | 2.262 | 2.133 | 2.327 | 2.210 | 0.280 | Posterior cingulate | 1.654 | 2.207 | 2.185 | 2.041 | 2.022 | 0.256 | |
| Thalamus | 1.031 | 1.701 | 0.921 | 1.357 | 1.368 | 1.317 | 1.282 | 0.277 | Thalamus | 1.132 | 1.335 | 1.251 | 1.236 | 1.238 | 0.083 | |
| Cerebellum | 1.000 | 1.000 | 1.000 | 1.000 | 1.000 | 1.000 | 1.000 | 0.000 | Cerebellum | 1.000 | 1.000 | 1.000 | 1.000 | 1.000 | 0.000 | |
| Brainstem | 1.225 | 1.516 | 1.107 | 1.380 | 1.298 | 1.212 | 1.290 | 0.144 | Brainstem | 1.093 | 1.342 | 1.250 | 1.418 | 1.276 | 0.140 | |
| Global mean | 1.517 | 1.918 | 1.614 | 1.701 | 1.548 | 1.714 | 1.669 | 0.145 | Global mean | 1.385 | 1.667 | 1.558 | 1.575 | 1.546 | 0.118 | |
| FU AmyvidTM | Participant No. | 1 | 3 | 6 | 8 | 9 | 10 | Participant No. | 2 | 4 | 5 | 7 | ||||
| Regions | Mean | SD | Regions | Mean | SD | |||||||||||
| Frontal lobe | no FU | 2.374 | 1.638 | 2.009 | 1.961 | 1.973 | 1.991 | 0.261 | Frontal lobe | 1.713 | 2.024 | 1.851 | 1.592 | 1.795 | 0.186 | |
| Parietal lobe | no FU | 2.309 | 1.590 | 1.916 | 1.909 | 1.947 | 1.934 | 0.255 | Parietal lobe | 1.580 | 1.913 | 1.913 | 1.515 | 1.730 | 0.212 | |
| Temporal lobe | no FU | 1.907 | 1.558 | 1.547 | 1.691 | 1.644 | 1.670 | 0.146 | Temporal lobe | 1.419 | 1.571 | 1.589 | 1.372 | 1.488 | 0.109 | |
| Occipital lobe | no FU | 1.819 | 1.760 | 1.402 | 1.641 | 1.455 | 1.615 | 0.183 | Occipital lobe | 1.282 | 1.479 | 1.545 | 1.329 | 1.409 | 0.124 | |
| Insula | no FU | 2.056 | 1.582 | 1.729 | 1.853 | 1.656 | 1.775 | 0.186 | Insula | 1.514 | 1.720 | 1.669 | 1.425 | 1.582 | 0.136 | |
| Anterior cingulate | no FU | 2.509 | 1.756 | 2.105 | 2.081 | 2.127 | 2.116 | 0.267 | Anterior cingulate | 1.824 | 2.134 | 2.036 | 1.781 | 1.944 | 0.169 | |
| Posterior cingulate | no FU | 2.649 | 1.798 | 2.150 | 2.329 | 2.010 | 2.187 | 0.323 | Posterior cingulate | 1.700 | 2.097 | 2.373 | 1.686 | 1.964 | 0.333 | |
| Thalamus | no FU | 1.393 | 0.885 | 1.320 | 1.517 | 1.228 | 1.269 | 0.239 | Thalamus | 1.189 | 1.243 | 1.352 | 1.123 | 1.227 | 0.097 | |
| Cerebellum | no FU | 1.000 | 1.000 | 1.000 | 1.000 | 1.000 | 1.000 | 0.000 | Cerebellum | 1.000 | 1.000 | 1.000 | 1.000 | 1.000 | 0.000 | |
| Brainstem | no FU | 1.417 | 1.118 | 1.322 | 1.353 | 1.098 | 1.261 | 0.145 | Brainstem | 1.122 | 1.375 | 1.408 | 1.217 | 1.280 | 0.135 | |
| Global mean | 1.911 | 1.496 | 1.618 | 1.675 | 1.630 | 1.666 | 0.152 | Global mean | 1.440 | 1.625 | 1.616 | 1.396 | 1.519 | 0.118 | ||
Changes in psychometric scores for observed cases and ITT-LOCF at 52 weeks following randomisation are shown in Table 5. Decreases in psychometric scores from baseline indicate a worsening in all outcomes. None of the clinical outcomes were statistically significant between treatment groups.
Changes in psychometric scores at 52 weeks for observed cases and ITT-LOCF after randomisation compared with baseline
| Observed cases | ITT-LOCF | |||||||
|---|---|---|---|---|---|---|---|---|
| Etanercept n = 6 | Placebo n = 4 | Mean difference (95%) CI | P value | Etanercept n = 7 | Placebo n = 6 | Mean difference (95%) CI | P value | |
| MoCA (SE) pts | 0.8 (1.1) | −1.5 (1.6) | 2.3 (6.5 to −1.9) | 0.2 | 0.7 (0.9) | −0.5 (1.2) | 1.2 (4.4 to −2.0) | 0.4 |
| 0.2 (5.5 to −3.1) | 0.5 | −0.2 (3.8 to −4.2) | 0.9 | |||||
| FCSRT (SE) pts | −1.0 (1.7) | −0.8 (1.1) | −0.2 (4.9 to −5.4) | 0.9 | −0.7 (1.4) | −0.8 (0.7) | 0.1 (3.9 to −3.6) | 0.9 |
| 0.2 (10.9 to −8.0) | 0.7 | 2.2 (7.3 to −3.0) | 0.4 | |||||
| RBANS (SE) pts | −5.7 (1.2) | −6.3 (2.3) | 0.6 (6.0 to −4.8) | 0.8 | −5.6 (1.0) | −5.4 (2.9) | −0.2 (6.1 to −6.6) | 0.9 |
| −0.3 (3.5 to −8.1) | 0.4 | 0.6 (8.0 to −6.8) | 0.8 | |||||
| ADCS-ADL MCI (SE) pts | 3.5 (2.4) | 1.0 (1.5) | 2.5 (10.0 to −5.0) | 0.5 | 3.3 (2.1) | 1.0 (2.0) | 2.3 (8.7 to −4.1) | 0.5 |
| 3.4 (14.2 to −7.7) | 0.5 | 0.5 (8.0 to −7.1) | 0.9 | |||||
corrected for baseline age, gender, and baseline psychometric score
The Table 6 shows the levels of serum inflammatory markers throughout the course of the study. No significant differences were found in serum levels of IFN-γ; IL-10, IL-12, IL-6, IL-8; TNF-α; TGF-β or CRP by treatment group allocation at baseline. Following randomisation, serum TNF-α was higher in the treatment compared with the placebo group at all time points {week 13 placebo 2.0 [standard error (SE) 0.2] pg/mL compared with etanercept 26.9 (SE 3.1) pg/mL; mean difference 24.9 (18.0 to 31.7) pg/mL, P < 0.0001}; [week 26 placebo 2.1 (SE 0.2) pg/mL c.f. etanercept 24.5 (SE 1.8) pg/mL; mean difference 22.3 (18.1 to 26.6) pg/mL, P < 0.0001]; [week 39 placebo 2.3 (se 0.2) pg/mL c.f. etanercept 21.6 (SE 4.0) pg/mL; mean difference 19.3 (8.6 to 30.0) pg/mL, P = 0.004]; [week 52 placebo 2.3 (SE 0.3) pg/mL c.f. etanercept 27.4 (SE 6.9) pg/mL; mean difference 25.1 (5.7 to 44.5) pg/mL, P = 0.04]. There were no significant differences between other serum inflammatory markers between the treatment and placebo groups at weeks 13, 26, 39, or 52.
Serum inflammatory markers throughout the course of the study
| Serum inflammatory markers | Randomised drug | Baseline | Week 13 | Week 26 | Week 39 | Week 52 |
|---|---|---|---|---|---|---|
| TNF-α pg/mL mean (SE) | Etanercept | 1.73 (0.18) | 26.89 (3.07) | 24.46 (1.82) | 21.62 (3.99) | 27.41 (6.96) |
| Placebo | 2.02 (0.15) | 2.01 (0.17) | 2.08 (0.18) | 2.28 (0.16) | 2.29 (0.30) | |
| IFN-γ pg/mL mean (SE) | Etanercept | 4.11 (1.81) | 7.47 (3.10) | 3.92 (1.21) | 12.39 (4.88) | 5.73 (2.56) |
| Placebo | 2.72 (0.70) | 2.16 (0.66) | 1.94 (0.89) | 2.57 (1.48) | 3.68 (1.48) | |
| IL-10 pg/mL mean (SE) | Etanercept | 0.23 (0.07) | 0.24 (0.07) | 0.17 (0.07) | 0.41 (0.26) | 0.14 (0.03) |
| Placebo | 0.21 (0.06) | 0.19 (0.05) | 0.22 (0.05) | 0.23 (0.06) | 0.25 (0.07) | |
| IL-12 pg/mL mean (SE) | Etanercept | 0.72 (0.69) | 0.75 (0.64) | 0.90 (0.75) | 1.16 (1.00) | 0.24 (0.11) |
| Placebo | 0.05 (0.01) | 0.06 (0.01) | 0.04 (0.02) | 0.06 (0.03) | 0.07 (0.04) | |
| IL-6 pg/mL mean (SE) | Etanercept | 0.69 (0.16) | 0.67 (0.16) | 0.67 (0.15) | 1.37 (0.40) | 0.65 (0.17) |
| Placebo | 0.49 (0.07) | 0.37 (0.02) | 0.39 (0.03) | 0.36 (0.05) | 0.32 (0.06) | |
| IL-8 pg/mL mean (SE) | Etanercept | 8.03 (1.23) | 9.26 (1.54) | 9.00 (1.67) | 7.16 (1.32) | 9.95 (2.14) |
| Placebo | 8.36 (1.21) | 8.12 (1.42) | 7.42 (0.81) | 7.75 (1.11) | 10.00 (2.16) | |
| TGF-ß ng/mL mean (SE) | Etanercept | 86.93 (16.66) | 111.12 (23.81) | 118.86 (26.22) | 96.18 (24.46) | 113.94 (24.13) |
| Placebo | 87.90 (18.38) | 149.30 (78.58) | 137.57 (49.28) | 116.60 (68.43) | 188.80 (120.76) | |
| CRP mg/L mean (SE) | Etanercept | 9.08 (2.41) | 9.20 (4.08) | 5.68 (2.69) | 23.40 (15.38) | 37.77 (27.78) |
| Placebo | 7.89 (2.05) | 4.63 (1.48) | 9.08 (2.68) | 6.86 (1.82) | 18.19 (11.86) |
This study did not show a significant effect of s.c. treatment with 50 mg of etanercept (weekly s.c. injection) over 52 weeks in a limited number of patients with MCI due to Alzheimer’s pathology on microglial activation as measured by [11C](R)-PK11195 PET. The study did not achieve the planned recruitment numbers (full study protocol can be accessed under https://www.clinicaltrialsregister.eu/, EudraCT number: 2015-002145-63) largely due to a delay in the start of the study and a no-cost extension not being granted by the study sponsor and instead of the originally projected 46 participants only 10 had fully analyzable datasets. Thus, the study had limited statistical power. Although our originally proposed research questions cannot be answered conclusively, we feel that nevertheless this exploratory trial has provided important information that is of interest for the design of therapeutic studies aiming to modify microglial activation in patients with MCI in the future.
An important limitation of the use of TSPO PET in MCI due to AD patients as a measure of therapeutic change is the relatively low baseline signal compared to other neurodegenerative disorders with high levels of microglial activation like multiple system atrophy (MSA) [25]. While test-retest variability of [11C](R)-PK11195 PET is about 10% in patients with AD [26] variation is substantial compared with the low baseline BP values in MCI, which leaves little space for measuring changes.
Levels of microglial activation in the active group and the placebo arm remained stable overall during the one year and we were unable, in our restricted dataset, to replicate the findings of Hamelin and colleagues [27] who postulated distinct profiles of microglial activation in patients with AD with patients having high levels of microglial activation progressing more slowly than those at lower levels.
We performed Amyvid™ PET alongside [11C](R)-PK11195 PET to ascertain the change in cortical amyloid load on scans from baseline to the final imaging visit in the treatment group compared to the placebo group. A positive amyloid PET scan on visual read was an inclusion criterion in order to include only MCI patients with a high likelihood of having AD pathology. In our group areas of increased retention colocalized with areas of increased microglial activation and overall amyloid retention remained stable in the placebo and the treatment group. Although our series suffers from low statistical power it seems unlikely that treatment with etanercept in MCI patients influences amyloid deposition.
Etanercept was generally well tolerated in this population with completion rates and adverse events being similar in both arms of the study. Adverse events were in keeping with the known side effect profile of these drugs in the rheumatological community. The study was not powered to show statistical differences in psychometric ratings between groups and none were shown. A larger study would be needed to see if any trends seen were clinically relevant but is not currently planned.
AD: Alzheimer’s disease
ADCS-ADL: Alzheimer’s Disease Cooperative Study Activities of Daily Living
BP: binding potential
CRP: C-reactive protein
FCSRT: Free and Cued Selective Reminding Test
IFN: interferon
IL: interleukin
ITT-LOCF: intention to treat last observation carried forward
MBq: megabecquerel
MCI: mild cognitive impairment
MoCA: Montreal Cognitive Assessment
MRI: magnetic resonance imaging
PET: positron emission tomography
RBANS: Repeatable Battery for the Assessment of Neuropsychological Status
SD: standard deviation
SE: standard error
TGF: transforming growth factor
TNF: tumour necrosis factor
TSPO: translocator protein 18kDa
WMIC: Wolfson Molecular Imaging Centre
The authors thank study personnel at the Memory Assessment and Research Centre, Southampton, the Institute of Brain, Behaviour and Mental Health, and the Wolfson Molecular Imaging Centre, University of Manchester who were involved in administration, drug delivery, venesection, sample preparation, and imaging procedures. The authors also thank all patients and carers who took part in the study.
AG, AHJ, KH and CH: Conceptualization, Funding acquisition. AG, CH, RS, TG, KM, EV and IL: Investigation, Data curation, Formal Analysis. CH and FT: Formal Analysis. AG and CH: Writing—original draft. All authors: Writing—review & editing.
The authors report no conflict of interest.
The protocol and consent forms were approved by a multi-centre research ethics committee (South Central-Hampshire A Research Ethics Committee), reference number 15/SC/0435. The study was performed in accordance with the Declaration of Helsinki and principles of Good Practice. An independent data and safety monitoring board monitored adverse events.
Informed consent to participate in the study was obtained from all participants.
Not applicable.
The data that support the findings of this study are available from the corresponding author upon reasonable request.
The study was funded by the Alzheimer’s Society UK, Alzheimer’s Drug Discovery Foundation and the European Union Seventh Framework Programme [FP7/2007-13] INMIND. Grant agreement number 278850. The funders had no role in study design, data collection and analysis, decision to publish, or preparation of the manuscript.
© The Author(s) 2023.
Copyright: © The Author(s) 2023. This is an Open Access article licensed under a Creative Commons Attribution 4.0 International License (https://creativecommons.org/licenses/by/4.0/), which permits unrestricted use, sharing, adaptation, distribution and reproduction in any medium or format, for any purpose, even commercially, as long as you give appropriate credit to the original author(s) and the source, provide a link to the Creative Commons license, and indicate if changes were made.