 Original Article

Affiliation:
1Department of Kinesiology, McMaster University, Hamilton, ON L8S 4K1, Canada
Affiliation:
1Department of Kinesiology, McMaster University, Hamilton, ON L8S 4K1, Canada
2School of Kinesiology & Health Science, York University, Toronto, ON M3J 1P3, Canada
Affiliation:
1Department of Kinesiology, McMaster University, Hamilton, ON L8S 4K1, Canada
Email: pjkeir@mcmaster.ca
ORCID: https://orcid.org/0000-0002-9811-1547
Explor Musculoskeletal Dis. 2026;4:1007125 DOI: https://doi.org/10.37349/emd.2026.1007125
Received: January 14, 2026 Accepted: May 05, 2026 Published: June 22, 2026
Academic Editor: Philippe Gorce, University of Toulon, France
The article belongs to the special issue Prevalence and Risk Factors of Work-related Musculoskeletal Disorders
Aim: With technological advancements and altered work environments, it has been thought that the risk of low back injuries would decrease while the risk for upper extremity injuries would increase. This construct has not been investigated, with little information available on possible trade-offs in injury rates across body parts over recent decades. The objective of our work was to perform a time series analysis on low back and upper extremity workplace musculoskeletal disorders through the injury compensation claim system across Canadian provinces from 2000 to 2019.
Methods: Injury claim data across all Canadian provinces from 2000–2019 were analyzed by grouping injuries based on the nature of injury, body part, and normalized to number of workers in each province.
Results: Normalized injury claims for both low back and upper extremity injuries have decreased from 2000 to 2015 across Canada (p < 0.001), with faster declines in low back injuries (p < 0.001 to p = 0.0295 depending on nature of injury). Some Canadian provinces have seen a stagnation or slight increase in injuries since 2015. Sprains and strain injuries had the most claims for both the low back (84.8% of all claims) and upper extremity (55.6% of all claims). Tendinitis was the most common specific upper extremity injury (18.2%), followed by epicondylitis (5.3%), carpal tunnel syndrome (3.3%), and rotator cuff injury (3.1%) across all of Canada with the order varying by province.
Conclusions: This study provides a comprehensive and updated look of the most prevalent musculoskeletal disorders as revealed by compensation data affecting Canadian workers over the last two decades.
Workplace injuries are pervasive and costly. In 2010, over 313 million non-fatal occupational accidents were reported worldwide, or approximately 860,000 workers injured every day [1]. The costs associated with workplace injuries result in a financial burden of up to 4% of the global gross domestic product [2]. Musculoskeletal disorders (MSDs) are the most common workplace injuries in North America [3]. MSDs affect muscles, tendons, ligaments, nerves, and blood vessels, and typically develop over time due to cumulative physical workplace exposure (e.g., high force, sustained duration, repetitive motion, awkward postures) as well as individual risk factors (e.g., age, sex, work experience) [4]. Canadian worker compensation boards report an annual average of slightly less than one million occupational injuries [5]. According to data within Ontario (ON), Canada’s most populated province, “sprains and strains” injuries comprise the majority of these claims, accounting for greater than one-third of injury claims [6]. Accounting for both direct (e.g., wages, medical treatment) and indirect (e.g., replacement workers, training costs, administrative fees, productivity losses) costs, the total cost of MSDs to the Canadian economy is estimated to be as high as $26 billion annually [3]. Tracking injury incidence over time is needed to understand MSD etiology, monitor the effectiveness of workplace safety guidelines, and ultimately, reduce the health and economic burden of MSDs.
Examining workplace lost-time injury claim data allows comparisons of MSD incidence across jurisdictions, as well as tracking injury trends over time due to new policies, interventions, and/or shifting workforce demographics. Previous analyses of Canadian workers’ compensation claims have examined how accepted injury claim rates are affected by population demographics (age, socioeconomic status, and gender) [7–10], nature (or type) of injury and workplace characteristics [11–13], and geographic location [14, 15]. However, most analyses of Canadian workers are outdated (early 2000s) and have focused on a specific occupation and/or province (or grouped nationally), with few comparisons between provinces. An updated analysis is needed to identify relevant trends in injury prevalence between provinces.
Workplace injuries are most common in the low back and upper extremity. For example, large-scale European epidemiological studies and systematic reviews find low back and upper extremity injuries combine for more than 50% of all lost time claim injuries [16, 17]. Epidemiological studies tracking workplace injuries have traditionally focused on either low back or upper extremity injuries alone [18, 19]. In 2001, a panel of leading experts convened by the National Research Council and Institute of Medicine suggested that future working patterns and activities might lead to a shift in the risk profile of MSDs [20]. Specifically, they predicted a reduced risk of back injuries due to decreased manual lifting resulting from greater workplace automation but noted a potential trade-off with an increased risk of upper extremity MSDs. The increased risk of upper extremity injuries was hypothesized to be due to greater job diversity and more computer-based tasks which require repetitive hand movements [20]. To our knowledge, there has been no comprehensive evaluation of whether this prediction has materialized. We were interested in whether Canadian compensation data supports this prediction, particularly to ascertain how rapid changes in the work environment across the last two decades may have manifested in trade-offs in injury risk between body parts so that we can better determine the consequences of work in the future. The purpose of this study was to use Canadian workers’ compensation claim data to investigate changes in low back and upper extremity workplace MSDs from 2000–2019 in Canadian provinces.
This was a retrospective population-based time-series analysis of accepted lost-time compensation claims. Data sampling included all accepted lost-time claims reported to provincial compensation boards between 2000–2019, with no subsampling applied. The Association of Workers’ Compensation Boards of Canada (AWCBC) National Work Injury/Disease Statistics Program (NWISP) consolidates accepted lost-time injury claim data from all provincial and territorial compensation boards in Canada. A lost-time claim is defined as compensation for lost wages following work-related injury or disease, or compensation for a permanent disability with or without any time lost in employment. The NWISP framework consolidates total lost-time injury claims with respect to demographic (e.g., age, gender, province/territory), injury (e.g., nature of injury, part of body, and event of injury), and workplace (e.g., industry, occupation) variables. We examined lost time claims data for the following independent variables: (1) year (2000–2019), (2) nature of injury, (3) body part injured, and (4) province/territory. Nature of injury refers to the primary physical characteristics of the injury, disease, or syndrome. Only the nature of injury categories representative of MSDs were included [21] (Table S1). Data from all provinces were included: Alberta (AB), British Columbia (BC), Manitoba (MB), New Brunswick (NB), Newfoundland and Labrador (NL), Nova Scotia (NS), ON, Prince Edward Island (PE), Quebec (QC), and Saskatchewan (SK). The territories (Northwest Territories, Nunavut, and Yukon) were not included due to small numbers of workers and claims. No ethics review was sought as data were available upon request and did not contain personal identifying information.
To protect anonymity, compensation boards report categories with 1–3 claims with an “X”; these data were imputed as “2” for our analyses. Injury claims were aggregated across body parts based on afflicting either (i) the low back or (ii) the upper extremity. Low back claims were defined as affecting the “back including the spine and spinal cord” based on the body part coding category. Injuries to other trunk or abdominal areas coded as the “unspecified (uns.) trunk”, “trunk locations that are not elsewhere coded (nec.)”, “multiple trunk locations”, “abdomen”, “pelvic region”, “hip”, and “chest” were not included as low back injuries. Upper extremity claims were defined as from the shoulder to the fingers, including these categories: “shoulder, including clavicle, scapula and trapezius muscle if shoulder is mentioned”, “arm(s)”, “wrist(s)”, “hands, except finger(s)”, “finger(s), fingernail(s)”, “multiple upper extremities locations” and “upper extremities that are nec.”. Discrepant and unlikely combinations of nature of injuries and body part were removed from further analysis as guided by general assumptions of the most injured area for a specific nature of injury and workplace injury studies. Finally, for both low back and upper extremity injuries, claims were grouped into one of three injury types based on the nature of injury: (1) traumatic injuries, (2) non-traumatic injuries, and (3) sprains and strains. Thus, for each Canadian province, total lost time injury claims were grouped by two levels of body part (low back, upper extremity) and three levels of injury type (traumatic, non-traumatic, sprains and strains) for each year from 2000 to 2019 (Table S1).
To allow for provincial and yearly comparisons, injury claims were standardized to the estimated at-risk, insured population using Canadian labour force survey data [22]. Based on “public-use microdata file” published monthly by Statistics Canada [23], we estimated the total hours worked per week of the Canadian labour force, excluding self-employed and unpaid family workers who are unlikely to be insured by their provincial workers’ compensation board. Injury claims for each province were normalized to 100,000 full-time equivalents (FTEs) derived from labour force survey data to account for differences in workforce size and exposure across provinces and over time [10]. FTE estimates were based on reported weekly hours worked and extrapolated to represent annual labour exposure, excluding self-employed and unpaid workers who are typically not covered by provincial compensation systems. Workers were defined as paid employees (full- and part-time) across civilian economic sectors covered by provincial workers’ compensation systems, excluding self-employed, unpaid workers, and military personnel. Injury claims normalized to FTEs will be referred to as normalized injury claims.
To evaluate how work-related MSDs have changed differentially across the low back and upper extremity across years, we used linear mixed-effects models to investigate the change in normalized injury claims (dependent variable) over time and body part. Year (2000–2019) and body part (low back, upper extremity) were modelled as fixed effects, while province was modelled as a random effect. The low back was used as the reference category; thus, a positive estimate of body part indicates a greater upper extremity normalized injury claims than low back. A year × body part interaction was included. Four separate statistical models were generated, one each for the following types of injuries: (1) traumatic injuries only, (2) non-traumatic injuries only, (3) sprains and strains injuries only, and (4) all injuries combined. Based on visual inspection, normalized injury claims were square root transformed to meet model assumptions. No non-linear terms were included in the model for parsimony. An alpha value of 0.05 was set for all statistical tests. Analyses were performed in R (version 3.5.1).
There were a total of 2,119,854 low back and upper extremity accepted lost time injury claims across all Canadian provinces from 2000–2019. Claims were highest in the year 2000 (147,487) and lowest in 2015 (80,614) (Figure 1). There were a total of 1,361,962 low back injury claims and 757,892 upper extremity injury claims from 2000–2019. The 65 nature of injury categories were grouped into common injury types (32 groups; Table S2). The ten most prevalent nature of (grouped) injuries were summed from 2000–2019 for each province and across Canada for both the low back (Figure 2) and upper extremity (Figure 3). For all provinces, “sprains and strains” injuries (including sprains and strains qualifiers categories: “uns.”, “not elsewhere classified”, “sprains or strains and bruises”, and “repetitive”) accounted for the greatest proportion of both low back and upper extremity injury claims. “Back pain, hurt back” was the second most frequently reported occupational low back injury for all provinces except QC, where lumbago and “back pain, hurt back” were the second and third most frequently occurring injuries. Compiling data from all provinces, the three most common low back injuries in descending order of prevalence were (i) “sprains and strains” (1,155,012, 84.8% of all low back claims), (ii) “back pain, hurt back” (112,434, 8.3%), and (iii) herniated discs (21,448, 1.6%) (Figure 2, right-hand column). For the upper extremity, tendinitis was the second most frequently reported injury for most provinces (BC, AB, MB, ON, QC, NB, PE), with other provinces reporting “soreness, pain, hurt, except the back” (SK, NL) or other non-specific injuries (NS). Summing all provinces, the three most common upper extremity injuries were (i) “sprains and strains” (421,189 claims, 55.6% of all upper extremity injury claims), (ii) tendinitis (138,224, 18.2%), and (iii) epicondylitis (39,940, 5.3%). Carpal tunnel syndrome was the fifth most common upper extremity injury in Canada with 25,088 claims (3.3% of all upper extremity injury claims).
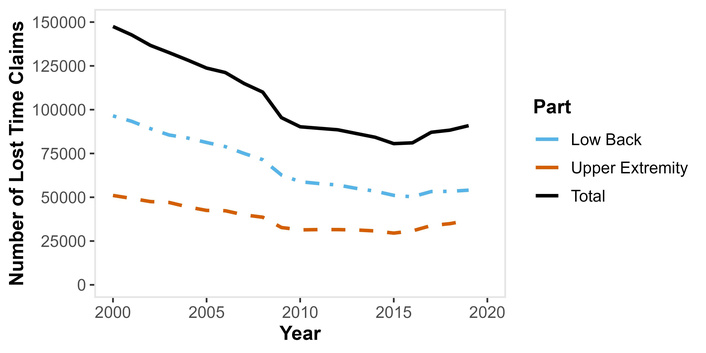
Overall number of low back, upper extremity, and total lost time injury claims in Canadian provinces from 2000–2019.
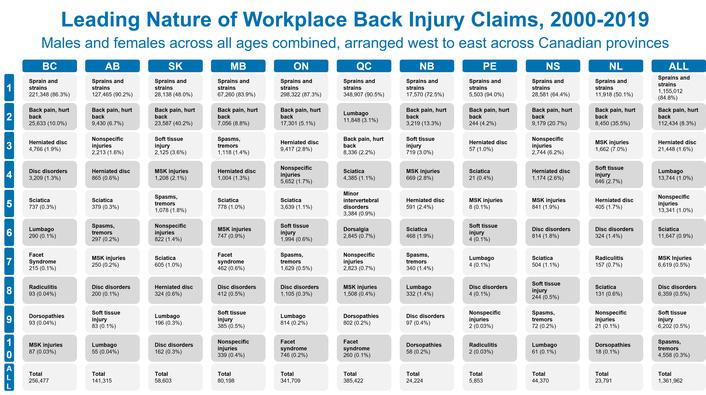
The ten most common nature of injuries for specific low back injuries ranked from 1 to 10 (count and %) and total claim count for each province and Canada (ALL). Note that the nature of injury codes were grouped, including combining traumatic and non-traumatic injury counterparts (Table S2). AB: Alberta; BC: British Columbia; MB: Manitoba; NB: New Brunswick; NL: Newfoundland and Labrador; NS: Nova Scotia; ON: Ontario; PE: Prince Edward Island; QC: Quebec; SK: Saskatchewan.
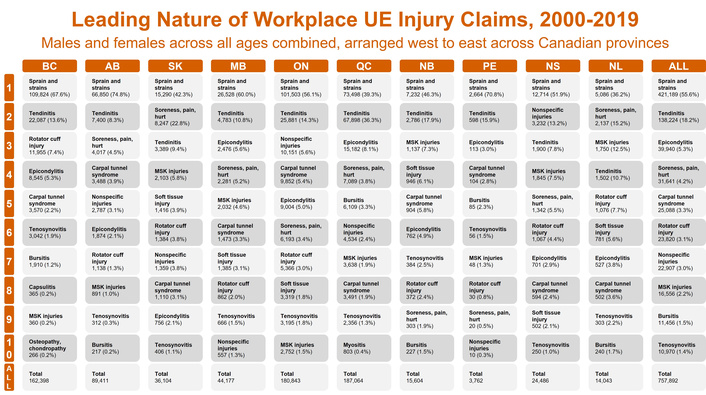
The ten most common nature of injuries both for specific upper extremity (UE) injuries ranked from 1 to 10 (count and %) and total claim count for each province and Canada (ALL). Note that the nature of injury codes were grouped, including combining traumatic and non-traumatic injury counterparts (Table S2). AB: Alberta; BC: British Columbia; MB: Manitoba; NB: New Brunswick; NL: Newfoundland and Labrador; NS: Nova Scotia; ON: Ontario; PE: Prince Edward Island; QC: Quebec; SK: Saskatchewan.
A summary of the statistical models analyzing the main effects of year, body part, and interaction effect between year and body part on normalized injury claims is provided in Table 1. A significant interaction between year and body part was found for sprain and strain injuries, total injuries (both p < 0.001), and traumatic injuries (p = 0.0295), where upper extremity claims decreased to a lesser extent than low back claims over time. In contrast, the opposite interaction effect was found for non-traumatic injuries with a larger decrease in upper extremity claims than low back claims (p = 0.0136). A main effect of year found a significant decrease in normalized injury claims (p < 0.001) for all injury categories (non-traumatic injuries, sprains and strain injuries, traumatic injuries, and total injuries). A main effect of body part found sprains and strain injuries as well as total injuries (p < 0.001) to be greater for low back than upper extremity. For non-traumatic injuries, upper extremity injury claims were greater than low back injury claims (main effect of body part, p < 0.001). Traumatic injury claims did not differ significantly between body parts (p = 0.1625). Differences in normalized injury claims between body parts were found across provinces (Table S3). MB and QC had the largest difference between low back and upper extremity injuries, while NB and AB had the smallest. When using average normalized claims per year, MB (972.8 claims per 100,000 FTE on average per year), BC (912.6), and SK (877.4) had the greatest proportion of low back injury claims across all of Canada while BC (574.2), SK (536.0), and MB (533.3) had the greatest proportion of upper extremity claims. Figures 4 and 5 illustrate provincial differences in the number of claims and normalized injury claims.
Summary of statistical models.
| Model | Fixed effects | Estimate | SE | t | p |
|---|---|---|---|---|---|
| Non-traumatic injuriesLog likelihood = –624.1 | Intercept | 7.56 | 0.59 | 12.79 | < 0.001* |
| Year | –0.27 | 0.01 | –19.22 | < 0.001* | |
| UE | 3.81 | 0.63 | 6.06 | < 0.001* | |
| Year × UE | –0.05 | 0.02 | –2.48 | 0.0136* | |
| Sprains and strainsLog likelihood = –841.9 | Intercept | 27.04 | 1.27 | 21.29 | < 0.001* |
| Year | –0.52 | 0.02 | –20.97 | < 0.001* | |
| UE | –11.6 | 0.9 | –12.96 | < 0.001* | |
| Year × UE | 0.4 | 0.03 | 11.57 | < 0.001* | |
| Traumatic injuriesLog likelihood = –876.5 | Intercept | 12.58 | 1.84 | 6.85 | < 0.001* |
| Year | –0.25 | 0.03 | –9.22 | < 0.001* | |
| UE | –1.31 | 0.89 | –1.48 | 0.1625 | |
| Year × UE | 0.08 | 0.04 | 2.19 | 0.0295* | |
| Total injuriesLog likelihood = –762.7 | Intercept | 31.52 | 1.25 | 25.3 | < 0.001* |
| Year | –0.61 | 0.02 | –29.8 | < 0.001* | |
| UE | –8.7 | 0.52 | –16.79 | < 0.001* | |
| Year × UE | 0.28 | 0.03 | 9.77 | < 0.001* |
Fixed effects, estimates, standard errors (SE), t-statistics, and p-values from all mixed-effects models analyzing the main effect of year, body part [low back versus upper extremity (UE)], and interaction effect of year and body part on normalized injury claims for each injury grouping (non-traumatic injuries, sprains and strains, traumatic injuries, and total injuries). Significant p-values (p < 0.05) are denoted by an asterisk (*). Please note that the fixed effects estimates are based on square root transformed data.
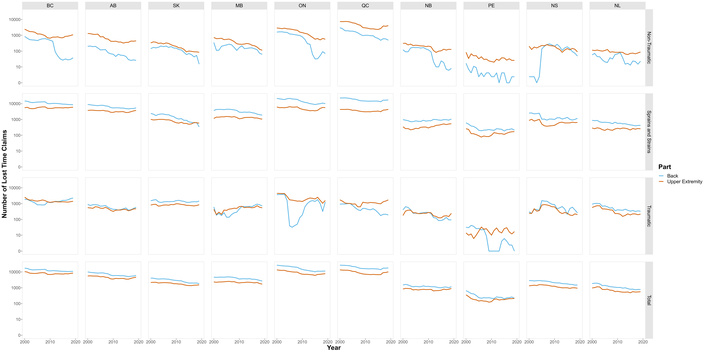
Total number of accepted lost time injury claims from 2000–2019 for all Canadian provinces. Injuries are grouped by affected body part (low back in blue; upper extremity in orange) and categorized by the type of injury: non-traumatic (first row), sprains and strains (second row), traumatic (third row), and all injuries combined (fourth row). Each column is a Canadian province, arranged from west (left) to east (right). Note: y axis is transformed to a log scale for comparison across provinces. AB: Alberta; BC: British Columbia; MB: Manitoba; NB: New Brunswick; NL: Newfoundland and Labrador; NS: Nova Scotia; ON: Ontario; PE: Prince Edward Island; QC: Quebec; SK: Saskatchewan.
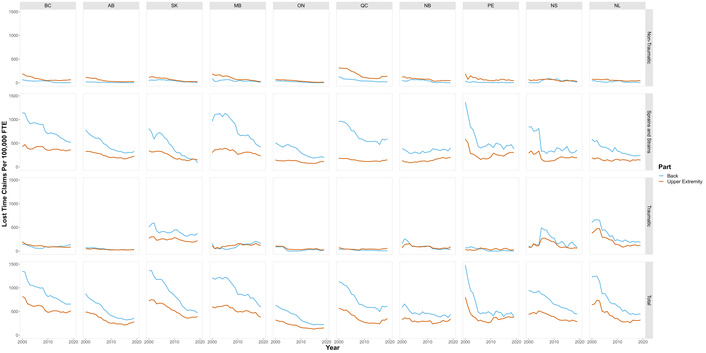
Accepted lost time injury claims normalized to 100,000 full-time equivalents (FTEs) from 2000–2019 for all Canadian provinces. Injuries are grouped by affected body part (low back in blue; upper extremity in orange) and categorized by the type of injury: non-traumatic (first row), sprains and strains (second row), traumatic (third row), and all injuries combined (fourth row). Each column is a Canadian province, arranged from west (left) to east (right). AB: Alberta; BC: British Columbia; MB: Manitoba; NB: New Brunswick; NL: Newfoundland and Labrador; NS: Nova Scotia; ON: Ontario; PE: Prince Edward Island; QC: Quebec; SK: Saskatchewan.
The objective of this study was to use Canadian workers’ injury compensation claims data to examine trends in low back versus upper extremity normalized injury claims over a 20 year-period (2000–2019) across Canadian provinces. We found that low back and upper extremity injury claims decreased 38.4% from 2000–2019 from 147,487 MSD claims in 2000 to 90,887 claims in 2019, with low back claims decreasing (–44%) more than upper extremity (–28%). MSDs decreased to their nadir in 2015 yet have gradually increased from then until 2019 nationally.
Low back claims were lower than upper extremity for non-traumatic injuries but were greater for sprains and strains. There have been roughly 600,000 more back injury claims than upper extremity claims over the two-decade analysis period. As of 2019, nine out of the ten provinces indicated having a greater number of total back injury claims than total upper extremity injuries when normalized to labour force size (exception PE where upper extremity and back claims were approximately equal).
However, we observed a significant interaction effect between year and body part, where upper extremity normalized injury claims declined more slowly than the low back for sprains/strains, traumatic injuries, and total injuries. These findings indicate a convergence in injuries between body regions but may not necessarily be evidence of a causal trade-off. For many claims, the nature of injury was described by vague terms that precluded identifying specific tissues damaged (i.e., “sprains and strains”). Among the many identified injuries, the most common tracked to specific anatomical tissues were herniated discs and sciatica for the low back, and tendinitis, epicondylitis, carpal tunnel syndrome, and rotator cuff injuries for the upper extremity.
We found that Canadian workplace MSD claims and normalized claims decreased from 2000–2019, updating the decreases previously noted for specific occupations and provinces prior to the last decade [5, 8, 9]. Smith and Mustard [9] reported decreasing injury claim counts in chronic MSDs in ON in the 10 years prior (1990–2000) to our current study, as well as drastic decreases in acute trauma, and sprains and strains claims over the same time span. While all types of injuries (i.e., traumatic, non-traumatic, and sprains and strains) for both the low back and upper extremity trended downward over the past 2 decades, extending the trend from the 1990s [9], there was a slight increase in total lost time injury claims across Canada in the last 5 years examined (2015–2019) (Figure 1). This slight increase (or flattening) of injury claims was most apparent in AB, SK, ON, and QC (Figure 5). No formal sensitivity analyses were conducted to evaluate the robustness of the stagnation or slight increase in injury claim rates since 2015; however, consistent trends across provinces suggest this finding is unlikely due to random variation. Importantly, we observed a narrowing in gap between low back and upper extremity injuries that is in line with predictions made by experts from 20 years ago [20]. While the current analysis cannot evaluate the causes of these changes, we do know they are multi-factorial. Proposed reasons for change include demographic shifts, evolving work organization (e.g., increased computer-based tasks), improved ergonomics (including automation), changes in workplace legislation, shifts in distribution of occupations, and changes to the workers compensation system [24, 25]. These factors were not directly assessed in this study and direct claims to their contribution on the observed trends cannot be made.
Provincial differences were observed with respect to body parts injured. The greatest number of claims were found in ON, QC, and BC, Canada’s most populous provinces. However, MB, followed by BC and SK were the highest normalized claims for low back injuries. For the upper extremity, the highest normalized claims were found in BC followed by SK and MB. Western provinces, including SK and BC, have previously reported higher injury risk than ON [15, 26]. These differences in provincial claim counts may reflect working population demographics. It is important to note that Morassaei et al. [15] controlled for sociodemographic (e.g., “sex”, age, and education) and work-related risk factors (e.g., full-time or part-time, physical demands). Provincial claims were also investigated by the 2000 Canadian Community Health Survey, which found young workers (aged 15–24 years old) were twice as likely to be injured in Western provinces than in Eastern provinces such as ON [27]. Geographical differences may also play a large role due to injury risks associated with predominant industries in specific provinces. For example, more urbanized provinces may employ more desk and service type whereas provinces with more rural areas may employ greater number of workers within forestry, fishing, and mining industries [28]. Isolating provincial data in relative terms (based on normalized labour force hours) can allow us to start to better focus on addressing the needs of all the Canadian provinces. As evidenced within our findings, provincial trends may not necessarily follow national-level data, where the numbers and discussion tend to be driven by more populous provinces.
Workplace MSDs are diverse in etiology, thus one of our aims was to categorize claims by body part and nature of injury to identify the most common workplace injuries. We observed twice as many low back injury claims as upper extremity. Grouping by injury type revealed that this effect is mainly observed for nature of injury codes categorized as “sprains and strains”. No significant differences in between the low back and upper extremity were observed for traumatic injury claims, while non-traumatic upper extremity injury claims were greater than low back. Attempts to further delineate injury types proved challenging as most injury claims had nature of injury codes with ambiguous terms that did not reveal the specific tissues damaged. “Sprains and strains” injuries comprised over 50% of low back and upper extremity injury claims. As a result, the overall prevalence of specific types of injuries, such as carpal tunnel syndrome or rotator cuff syndrome, may be masked by injuries categorized under other “catch-all” nature of injury codes. For example, a study from Washington State showed that only approximately 34% of work-related MSD claims in Washington State had a confirmed specific diagnosis, with the remainder classified under more general coding categories [29]. Further complicating interpretation, direct comparisons of injury rates for specific injuries are difficult due to provincial differences in classification, such as with “uns.” versus “nec.”. For example, for upper extremity injuries in ON from 2000–2019, 96,218 sprains, strains and tears injuries were labeled as “uns.” with 455 labeled as “nec.”. QC reported 2 uns. and 73,496 nec. upper extremity sprain, strain, and tear injuries over the same period. Differences in coding practices and ambiguity in nature of injury codes require caution when drawing inferences from injury claim data. Non-specific classifications such as ‘sprains and strains’ combine heterogeneous pathologies, potentially obscuring the true prevalence of specific anatomical conditions and limiting the precision of injury surveillance. This also limits mechanistic interpretation and may hinder targeted prevention and policy efforts, as such labels do not clearly indicate the affected body part or guide prevention, potentially impairing safety actions and ergonomic interventions.
Nevertheless, efforts to characterize upper-extremity injury prevalence in Canada have largely relied on province-specific workers’ compensation data, such as ON-based analyses from the 1990s [13]. Our current analyses can be valuable for many stakeholders, including policymakers and researchers, to identify high priority areas in workplaces across each Canadian province. This study provides one of the most comprehensive examinations of MSDs afflicting Canadian workers to date, with a look at compensation claims across all Canadian provinces over the past two decades. Despite the large data, the use of “accepted lost-time” claims is known to underestimate injuries in the workplace, with many absences from work going unreported [30]. Furthermore, only a proportion of submitted claims are accepted. With respect to lost-time claims, which represent a more significant burden of injuries, 761,462 total injury claims were submitted in Canada in 2017, with only 251,625 accepted as requiring time away from work [31]. This gap highlights the need for improved data systems that capture both lost-time and non-lost-time injuries. To address this issue, we recommend a multi-faceted approach. First, combining data using multiple sources (i.e., ground-level observations and population-level statistics) can provide a more comprehensive understanding of injury prevalence [24]. Secondly, a shift from purely descriptive methodologies to causal modeling that incorporate measurement errors and uncertainty (e.g., underreporting, no time off work) is essential to better approximate the true number of injuries. Despite the underestimation of the overall number of workplace injuries, lost time injury claims remain essential indicators for workplace safety, with our study providing the most up-to-date trends in MSD claims. An important note is that we normalized claims to the estimated number of at-risk, insured population using labour force survey data to allow for comparisons across years and provinces. The number of hours used for normalization were extrapolated from a one-week period for each month, thus represents a rough estimate.
During the two-decade period of this study, many demographic changes including sex and age have altered the landscape of workplace injury evaluation. Recently, we found decreases in upper extremity normalized injury claims across the board regardless of sex and/or age category [10]; however, some demographic groups were observed to have larger decreases over time. Future work could evaluate whether the differential changes between low back and upper extremity MSDs are affected by demographics.
In conclusion, low back and upper extremity injury claims have decreased since 2000. However, these decreases have stagnated in recent years, with some provinces having a slight uptick in injury claims since 2015. In addition, low back injury claims have decreased more than the upper extremity, resulting in a narrowing of the gap between the incidence of low back and upper extremity injuries that may provide an outlook on the future of work injuries with continuing changes in job environments and type of work available. Most injuries were classified using non-descript terms (e.g., sprains and strains). The most common injuries were herniated discs and sciatica for the low back, and tendinitis, epicondylitis, carpal tunnel syndrome, and rotator cuff injuries for the upper extremity. We observed provincial differences in injury claims, likely reflecting a combination of worker demographics and the nature of industries in each region. The findings from our study can provide readers an in-depth analysis of which MSDs are most prevalent over the past two decades and how the epidemiology of back and upper extremity injuries has changed over time while also highlighting a need for more specific reporting measures within workplace compensation boards.
AB: Alberta
AWCBC: Association of Workers’ Compensation Boards of Canada
BC: British Columbia
FTEs: full-time equivalents
MB: Manitoba
MSDs: musculoskeletal disorders
NB: New Brunswick
nec.: not elsewhere coded
NL: Newfoundland and Labrador
NS: Nova Scotia
NWISP: National Work Injury/Disease Statistics Program
ON: Ontario
PE: Prince Edward Island
QC: Quebec
SK: Saskatchewan
UE: upper extremity
uns.: unspecified
The supplementary tables for this article are available at: https://www.explorationpub.com/uploads/Article/file/1007125_sup_1.pdf.
Tables S1 and S2 were derived from the AWCBC NWISP classification framework and internally generated groupings. No copyrighted material was reproduced.
The authors are grateful to the Association of Workers’ Compensation Boards of Canada (AWCBC) and the National Work Injury/Disease Statistics Program (NWISP) for providing the dataset. Specifically, they would like to thank Jilal Jemal and Kelvin Yang for preparing the data upon their request. All interpretations of AWCBC/NWISP data are those of the authors and not those of the AWCBC or any of its member Boards or Commissions.
YH: Conceptualization, Formal analysis, Investigation, Methodology, Visualization, Writing—original draft, Writing—review & editing. DMM: Conceptualization, Data curation, Formal analysis, Funding acquisition, Investigation, Methodology, Visualization, Writing—review & editing. PJK: Conceptualization, Data curation, Funding acquisition, Methodology, Project administration, Supervision, Writing—review & editing. All authors read and approved the submitted version.
The authors declare that they have no conflicts of interest.
Institutional ethics approval was not required as the study used publicly available datasets, de-identified administrative data and did not involve human subjects as defined by institutional guidelines.
Consent to participate was not required as publicly available datasets were used. Informed consent was not required as no identifiable human participant data were used.
Not applicable.
The datasets used in this study can be obtained from the AWCBC on request using the information found in Table S1.
The research was supported by funding from the Centre of Research Expertise for the Prevention of Musculoskeletal Disorders (CRE-MSD seed grant). The funder had no role in study design, data collection and analysis, decision to publish, or preparation of the manuscript.
© The Author(s) 2026.
Open Exploration maintains a neutral stance on jurisdictional claims in published institutional affiliations and maps. All opinions expressed in this article are the personal views of the author(s) and do not represent the stance of the editorial team or the publisher.
Copyright: © The Author(s) 2026. This is an Open Access article licensed under a Creative Commons Attribution 4.0 International License (https://creativecommons.org/licenses/by/4.0/), which permits unrestricted use, sharing, adaptation, distribution and reproduction in any medium or format, for any purpose, even commercially, as long as you give appropriate credit to the original author(s) and the source, provide a link to the Creative Commons license, and indicate if changes were made.

View: 476
Download: 20
Times Cited: 0
Antonina D.S. Pavilanis ... Michael J.L. Sullivan
Philippe Gorce, Julien Jacquier-Bret
Raquel Ferreira Araruna de Carvalho, Márcio Alves Marçal
Philippe Gorce, Julien Jacquier-Bret
Mário Lopes, Marisa Lages
João Alberto de Souza Ribeiro, Luciana Aparecida Giacomini
Adrian Low, Benny Lam
Annalisa Bertoli ... Cesare Fantuzzi
