 Meta-Analysis

Affiliation:
1Université de Toulon, 83041 Toulon, France
2International Institute of Biomechanics and Occupational Ergonomics, Avenue du Docteur Marcel Armanet, 83418 Hyères Cedex, France
ORCID: https://orcid.org/0000-0003-4992-8443
Affiliation:
1Université de Toulon, 83041 Toulon, France
2International Institute of Biomechanics and Occupational Ergonomics, Avenue du Docteur Marcel Armanet, 83418 Hyères Cedex, France
Email: jacquier@univ-tln.fr
ORCID: https://orcid.org/0000-0003-2815-1700
Explor Musculoskeletal Dis. 2026;4:1007116 DOI: https://doi.org/10.37349/emd.2026.1007116
Received: September 18, 2025 Accepted: January 28, 2026 Published: February 12, 2026
Academic Editor: Robin Christensen, University of Southern Denmark, Denmark
The article belongs to the special issue Prevalence and Risk Factors of Work-related Musculoskeletal Disorders
Background: Nurses perform many daily care tasks that expose them to work-related musculoskeletal disorders (WMSDs). Many studies have reported a high prevalence worldwide. Analyses by continent have provided a better understanding of the WMSD occurrence, but none have yet been conducted among African nurses. The aim was to conduct a systematic review analysis with meta-analysis of the overall WMSD prevalence and the prevalence by body area among nurses in Africa.
Methods: The PRISMA (Preferred Reporting Items for Systematic Reviews and Meta-Analyses) method was used to present the results in the form of a systematic review analysis with meta-analysis. PubMed/Medline, ScienceDirect, Google Scholar, Mendeley, and Science.gov were explored between August 20 and 29, 2025 to identify studies that investigated the overall and body area WMSD prevalence among African nurses of any specialty without a date limit. Studies were included if they were cross sectional survey assessing the WMSD prevalence among nurses of any specialty or department working in Africa. Any study that was not a peer-reviewed cross-sectional survey published in English, that did not involve African nurses, or that did not report, or sufficiently detail data on the prevalence was excluded. The quality of each article included was assessed using the cross-sectional study assessment tool (AXIS). A meta-analysis with quantification of heterogeneity (Cochran’s Q test and I2 statistic) was conducted. Based on these parameters, a fixed or random effects model was selected to estimate the prevalence. Forest plots were used to summarize the overall, neck, upper back, lower back, shoulder, elbow, wrist, hip, knee, and ankle WMSD prevalence.
Results: Nineteen cross-sectional studies were selected from the 4,305 identified studies, involving 4,670 African nurses from 10 countries. A significant heterogeneity was highlighted between studies (Cochran’s Q test and I2 statistic). Lower back [59.5%, 95% confidence interval (CI): 52.8–66.2%, 4,670 participants], neck (35.4%, 95% CI: 28.0–42.8%, 4,670 participants), and knee (34.4%, 95% CI: 27.2–41.6%, 4,601 participants) were the most exposed areas. The overall WMSD prevalence was pooled at 74.6% (95% CI: 67.0−82.3%, 4,266 nurses).
Discussion: Comparison of these results with the literature showed that African nurses were less affected than those on other continents. However, the data were highly heterogeneous. Due to the numerous risk factors associated with nursing work, it is necessary to continue research projects and educational activities, as well as the development of health policies aimed at improving quality of life at work, specifically by expanding the investigation using subgroup analysis.
Nurses have a work activity that exposes them to work-related musculoskeletal disorders (WMSDs) due to heavy workloads during long working hours with frequent shift rotations. During their shifts, they handle heavy loads and numerous patients, perform many care procedures [1], and walk distances ranging from 5 km to over 10 km during a 12-hour shift, depending on the unit [2, 3]. These working conditions promote the occurrence of WMSDs [4, 5]. These are injuries to muscle, tendon, ligament, and nerve tissue, leading to short- and medium-term musculoskeletal disorders [6]. The most exposed areas are the lower back, neck, shoulders, wrists, and knees [7, 8]. The various pathologies reported have been the source of numerous work stoppages, with significant direct and indirect costs [9], and consequently high staff turnover [7]. At the same time, rapid economic growth has led to increasing demand for healthcare services, resulting in a heavier workload for nurses and, consequently, an increase in WMSDs. As a result, more and more nurses are considering leaving their jobs [10], leading to a relative shortage of nursing staff.
The African population has grown steadily since 1950 and is expected to reach 1.55 billion in 2025 [11]. In 2020, the World Health Organization estimated an average of 17.78 nurses per 10,000 inhabitants [12, 13]. This distribution is not uniform. Some countries have a significantly higher number of nurses per 10,000 inhabitants, such as South Africa (63.9) and Libya (63.8), while others, such as Ethiopia (12.2) and the Ivory Coast (7.93), have a much lower rate. Several studies conducted in African countries have shown an overall WMSD prevalence greater than 80% reported in Egypt (97.8% [14]), Botswana (90.9% [15]), and South Africa (85.5% [16]). Kgakge et al. [17] conducted a scoping review among nurses in sub-Saharan Africa and found an overall prevalence of between 57.1% and 95.7% based on 29 studies involving 6,343 nurses. The authors also demonstrated a significantly lower back WMSD prevalence ranging from 32.5% to 87.5% and values above 60% in 12 studies. Kasa et al. [18] reported a similar result. In their meta-analysis, the authors found a range of 44.1% to 82.7% with a pooled value of 64.07% [95% confidence interval (CI): 58.68–69.46%, 19 studies, and 6,110 participants] for the lower back. Other authors have reported a high prevalence among African nurses, particularly in the neck (67.2% [19]), shoulder (63.6% [16]), wrist (52.7% [20]), and knee (87.0% [21]).
These surveys on the overall prevalence of WMSDs among nurses and by body area have been widely conducted in many countries. This has enabled meta-analyses to be proposed by continent. Studies are available for Asia [22] and Europe [23]. This research contributes to understanding environmental and individual factors that contribute to the emergence of WMSDs. The use of such data is a valuable resource for supervisors and researchers in the development of new innovative technologies or workplace ergonomics. It is important to continue these investigations on other continents in order to obtain data on working conditions and nurse profiles, which can vary greatly. To our knowledge, only the studies by Kasa et al. [18] and Kgakge et al. [17] have been conducted among nurses in Africa, but the authors focused on the lower back WMSD prevalence and did not present data on other areas.
Thus, the objective of this study was to produce a quantitative overview of the overall prevalence and prevalence by body area of WMSDs among nurses in Africa, regardless of their department or specialty. The data obtained through a systematic review and meta-analysis will provide a substantial basis for developing health policy and formulating specific interventions aimed at reducing WMSDs and improving the quality of life at work for African nurses.
The meta-analysis was conducted in accordance with the PRISMA (Preferred Reporting Items for Systematic Reviews and Meta-Analyses) guidelines [24, 25]. The protocol was registered in the PROSPERO database. The registration number is CRD420251145649.
In order to achieve the main objective of the study, the following keywords, linked by the Boolean operator AND, were entered into the search engine of each of the five databases to search for relevant articles: “work-related musculoskeletal disorders” AND nurse AND prevalence AND Africa.
The term “work-related musculoskeletal disorders” corresponds to Kuorinka et al. [26] definition: WMSDs are symptoms such as pain and discomfort lasting at least one week or occurring at least once a month during the last 12 months. Five free databases were explored between August 20 and 29, 2025: PubMed/Medline, ScienceDirect, Google Scholar, Mendeley, and Science.gov.
Participants, exposures, comparisons, outcomes (PECOs) and study design principles were used to set the inclusion criteria: The participants were nurses of any specialty or department practicing in Africa and exposed to WMSDs in the workplace. The main outcomes were the overall and body area WMSD prevalence reported as a percentage of the total sample in a cross-sectional study written in English. No comparison was conducted. Four exclusion criteria were defined: (1) the study was not a cross-sectional, peer-reviewed survey written in English; (2) the study did not involve African nurses; (3) the study did not report or did not sufficiently detail data on WMSD prevalence by body area; (4) the number of body areas assessed was less than 3.
Two reviewers (PG and JJB) independently conducted the database search without applying any filters or limits. All entries from each search were considered during the selection process. The results from each reviewer were compiled into a single spreadsheet to remove multiple entries using the corresponding function. Each reviewer then reviewed the titles and abstracts of each unique article found. They separately excluded studies based on selection criteria and drew up a list of potential articles. The lists were compared to identify articles to be retrieved. Each reviewer then separately evaluated the full text of each retrieved article. The final list was obtained by comparing the selections of the reviewers. Any discrepancies encountered at each stage were resolved by consensus and re-evaluation of the articles.
The quality of each article included was assessed using the cross-sectional study assessment tool (AXIS) [27]. The AXIS tool contains 20 items. When an item is present, it is marked with “Yes”; otherwise, it is marked with “No”. The percentage of elements present was then computed. The quality was defined according to the Hermanson and Choi [28] classification based on the percentage of elements present. Quality was considered low if the number of elements present was less than 50%, and high if this percentage was greater than 80%. Between these two percentages, a medium quality was considered. Two reviewers performed separately the quality appraisal (PG and JJB). Results were compared and any discrepancies were discussed in order to reach a consensus for the final evaluation.
Demographic characteristics and prevalence of WMSDs were extracted from each cross-sectional study. The first part contained the authors’ names, study country, number of participants, response rate, gender distribution, mean age, body mass index (BMI), and work experience of the participants. Prevalence data were extracted for nine body areas, i.e., neck, upper back, lower back, shoulder, elbow, wrist, hip, knee, and ankle, as well as overall prevalence when data were available. To allow comparison between studies, data homogenization was performed. When prevalence was reported on a subgroup (groups of people with WMSD), the percentage was recomputed and reported for the total sample.
The method developed by Neyeloff et al. [29] was applied to perform a meta-analysis of the overall and body area WMSD prevalence. Cochran’s Q test (significance level < 10%) and I2 statistic (significance level > 50%) [30] were used to assess data heterogeneity. In the presence of homogeneous data, a fixed effects model was selected; otherwise, a random effects model with the inverse-variance approach was implemented. Meta-regressions were performed to investigate the impact of participants’ age on overall WMSD prevalence and prevalence for the 9 body areas using the Pearson’ r coefficient. Two sensitivity analyses were carried out to assess the stability of the meta-analysis results: a one-by-one exclusion study and a comparison of results between all studies and only those with a low risk of bias (based on results obtained with the AXIS tool). Analyses were conducted with Microsoft® Excel 2016 and JASP (v 0.19.3.0).
The use of keywords enabled a total of 4,305 studies to be extracted from the five databases. After removing 37 duplicates, 4,150 studies were excluded because they did not meet the study inclusion criteria (incorrect format, study not involving African nurses, or lack of details about WMSDs). Of the remaining 118, 92 were removed from the study because the samples included different healthcare professionals without any distinction between the different professions, the presentation of WMSDs did not allow the results to be reported on a total sample of nurses, or the number of body areas covered was less than three, etc. Reports from seven studies could not be retrieved, resulting in their exclusion. Finally, 19 cross-sectional studies were included, for a total of 4,670 participants. Figure 1 illustrates the process of study selection.
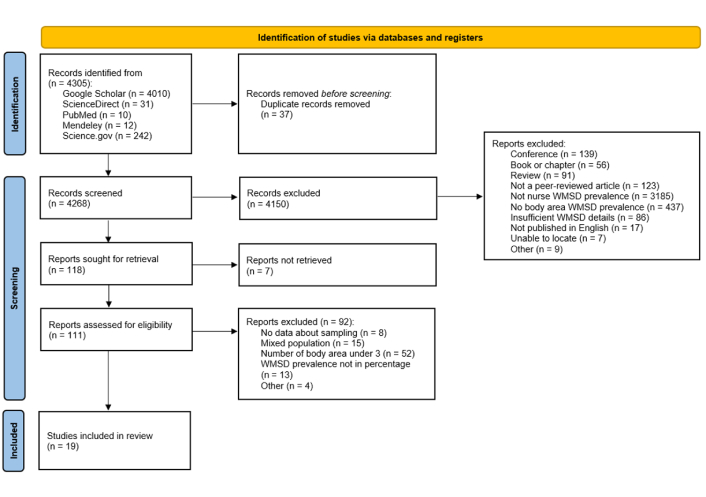
PRISMA flow diagram. Adapted from “The PRISMA 2020 statement: an updated guideline for reporting systematic reviews” by Page MJ, McKenzie JE, Bossuyt PM, Boutron I, Hoffmann TC, Mulrow CD, et al. BMJ. 2021;372:n71 (https://www.bmj.com/content/372/bmj.n71). © Author(s) (or their employer(s)) 2019. CC BY. PRISMA: Preferred Reporting Items for Systematic Reviews and Meta-Analyses.
Table 1 details the quality assessment of the 19 studies included in this analysis using the AXIS tool [14–16, 19–21, 31–43]. All studies scored above 80%, indicating a low risk of bias, except the study of Mailutha et al. [35] that achieved a score of 79%, i.e., medium quality.
Quality appraisal of each included study.
| References | Q1 | Q2 | Q3 | Q4 | Q5 | Q6 | Q7 | Q8 | Q9 | Q10 | Q11 | Q12 | Q13 | Q14 | Q15 | Q16 | Q17 | Q18 | Q19 | Q20 | Yes | No | Yes (%) | Risk of biais |
|---|---|---|---|---|---|---|---|---|---|---|---|---|---|---|---|---|---|---|---|---|---|---|---|---|
| Ajibade et al., 2013 [31] | Yes | Yes | Yes | Yes | Yes | Yes | No | Yes | Yes | Yes | Yes | Yes | No | NA | Yes | Yes | Yes | No | No | Yes | 15 | 4 | 84% | Low |
| Alalagy et al., 2025 [32] | Yes | Yes | No | Yes | Yes | Yes | No | Yes | Yes | Yes | Yes | Yes | No | NA | Yes | Yes | Yes | Yes | No | Yes | 15 | 4 | 84% | Low |
| Brien et al., 2018 [33] | Yes | Yes | No | Yes | Yes | Yes | No | Yes | Yes | Yes | Yes | Yes | No | NA | Yes | Yes | Yes | Yes | No | Yes | 15 | 4 | 84% | Low |
| El Ata et al., 2016 [14] | Yes | Yes | Yes | Yes | Yes | Yes | No | Yes | Yes | Yes | Yes | Yes | No | NA | Yes | Yes | Yes | No | No | Yes | 15 | 4 | 84% | Low |
| Elghazally et al., 2023 [21] | Yes | Yes | Yes | Yes | Yes | Yes | No | Yes | Yes | Yes | Yes | Yes | No | NA | Yes | Yes | Yes | No | No | Yes | 15 | 4 | 84% | Low |
| Freimann et al., 2016 [34] | Yes | Yes | No | Yes | Yes | Yes | No | Yes | Yes | Yes | Yes | Yes | No | NA | Yes | Yes | Yes | Yes | No | Yes | 15 | 4 | 84% | Low |
| Kgakge et al., 2019 [15] | Yes | Yes | No | Yes | Yes | Yes | No | Yes | Yes | Yes | Yes | Yes | No | NA | Yes | Yes | Yes | Yes | No | Yes | 15 | 4 | 84% | Low |
| Mailutha et al., 2020 [35] | Yes | Yes | No | Yes | Yes | Yes | No | Yes | Yes | Yes | Yes | Yes | No | NA | Yes | Yes | Yes | No | No | Yes | 14 | 5 | 79% | Medium |
| Moodley et al., 2020 [16] | Yes | Yes | Yes | Yes | Yes | Yes | No | Yes | Yes | Yes | Yes | Yes | No | NA | Yes | Yes | Yes | Yes | No | Yes | 16 | 3 | 89% | Low |
| Munabi et al., 2014 [36] | Yes | Yes | Yes | Yes | Yes | Yes | No | Yes | Yes | Yes | Yes | Yes | No | NA | Yes | Yes | Yes | Yes | No | Yes | 16 | 3 | 89% | Low |
| Mutanda et al., 2017 [37] | Yes | Yes | Yes | Yes | Yes | Yes | No | Yes | Yes | Yes | Yes | Yes | No | NA | Yes | Yes | Yes | Yes | No | Yes | 16 | 3 | 89% | Low |
| Muthelo et al., 2023 [38] | Yes | Yes | No | Yes | Yes | Yes | No | Yes | Yes | Yes | Yes | Yes | No | NA | Yes | Yes | Yes | Yes | No | Yes | 15 | 4 | 84% | Low |
| Nemera et al., 2024 [39] | Yes | Yes | Yes | Yes | Yes | Yes | No | Yes | Yes | Yes | Yes | Yes | No | NA | Yes | Yes | Yes | No | No | Yes | 15 | 4 | 84% | Low |
| Nkhata et al., 2015 [40] | Yes | Yes | No | Yes | Yes | Yes | No | Yes | Yes | Yes | Yes | Yes | No | NA | Yes | Yes | Yes | Yes | No | Yes | 15 | 4 | 84% | Low |
| Ojedoyin et al., 2025 [20] | Yes | Yes | Yes | Yes | Yes | Yes | No | Yes | Yes | Yes | Yes | Yes | No | NA | Yes | Yes | Yes | No | No | Yes | 15 | 4 | 84% | Low |
| Ouni et al., 2020 [41] | Yes | Yes | No | Yes | Yes | Yes | No | Yes | Yes | Yes | Yes | Yes | No | NA | Yes | Yes | Yes | Yes | No | Yes | 15 | 4 | 84% | Low |
| Sorour et al., 2012 [19] | Yes | Yes | No | Yes | Yes | Yes | No | Yes | Yes | Yes | Yes | Yes | No | NA | Yes | Yes | Yes | Yes | No | Yes | 15 | 4 | 84% | Low |
| Tinubu et al., 2010 [42] | Yes | Yes | No | Yes | Yes | Yes | No | Yes | Yes | Yes | Yes | Yes | No | NA | Yes | Yes | Yes | Yes | No | Yes | 15 | 4 | 84% | Low |
| Yitayeh et al., 2015 [43] | Yes | Yes | Yes | Yes | Yes | Yes | No | Yes | Yes | Yes | Yes | Yes | No | NA | Yes | Yes | Yes | Yes | No | Yes | 16 | 3 | 89% | Low |
Q1: Were the aims/objectives of the study clear?
Q2: Was the study design appropriate for the stated aim(s)?
Q3: Was the sample size justified?
Q4: Was the target/reference population clearly defined? (Is it clear who the research was about?)
Q5: Was the sample frame taken from an appropriate population base so that it closely represented the target/reference population under investigation?
Q6: Was the selection process likely to select subjects/participants that were representative of the target/reference population under investigation?
Q7: Were measures undertaken to address and categories non-responders?
Q8: Were the risk factor and outcome variables measured appropriate to the aims of the study?
Q9: Were the risk factor and outcome variables measured correctly using instruments/measurements that had been trialed, piloted or published previously?
Q10: Is it clear what was used to determined statistical significance and/or precision estimates? (eg, p values, CIs)
Q11: Were the methods (including statistical methods) sufficiently described to enable them to be repeated?
Q12: Were the basic data adequately described?
Q13: Does the response rate raise concerns about non-response bias?
Q14: If appropriate, was information about non-responders described?
Q15: Were the results internally consistent?
Q16: Were the results for the analyses described in the methods, presented?
Q17: Were the authors discussions and conclusions justified by the results?
Q18: Were the limitations of the study discussed?
Q19: Were there any funding sources or conflicts of interest that may affect the authors ‘interpretation of the results?
Q20: Was ethical approval or consent of participants attained?
Column 19 was treated as ‘Yes’ in the risk of bias calculation (the absence of conflict for interpretation is a guarantee of quality).
Table 2 presents the demographic characteristics of the included studies. Ten African countries are represented: Botswana [15], Egypt [14, 19, 21], Ethiopia [34, 39, 43], Kenya [35], Libya [32], Nigeria [20, 31, 42], South Africa [16, 33, 38], Tunisia [41], Uganda [36, 37], and Zambia [40]. The majority of samples ranged between 100 and 400 participants. Three studies had a sample size of less than 100 [19, 33, 38], and one study surveyed 741 nurses [36]. Response rates were relatively high (> 80%). Two studies had response rates of 45% [34] and 68% [16], respectively, and six studies did not report this information [14, 19–21, 31, 43]. All the studies focused on a mixed population, predominantly composed of women (78.8% across all studies). The mean age in the different studies ranged from 20.5 to 43.7 years, with an overall mean of 31.0 years. The participants’ experience as nurses ranged from 3.5 to 19.4 years. Four studies had experience of less than 10 years [15, 33, 39, 41] and six had experience of more than 10 years [32, 36–38, 40, 42]. Nine studies did not provide this information. Finally, the BMI of nurses was mostly between 25 and 30. Two studies had a BMI value of less than 25 [20, 43]. Only half of the studies reported this information.
Demographic characteristics of the 19 included studies.
| Authors | Country | Sample size | Response rate (%) | Male/Female (%) | Age (years) | Experience (years) | BMI |
|---|---|---|---|---|---|---|---|
| Ajibade et al., 2013 [31] | Nigeria | 138 | - | 16.7%/83.3% | 36.2 | - | - |
| Alalagy et al., 2025 [32] | Libya | 215 | 88.8% | 5.1%/94.9% | 43.7 ± 7.2 | 19.4 ± 9.0 | 29.4 ± 5.3 |
| Brien et al., 2018 [33] | South Africa | 59 | 70.9% | 16.9%/83.1% | 36.7 ± 9.3 | 9.9 ± 7.6 | - |
| El Ata et al., 2016 [14] | Egypt | 184 | - | 15.8%/84.2% | - | - | < 30.0 |
| Elghazally et al., 2023 [21] | Egypt | 200 | - | - | 32.4 ± 8.8 | - | 27.7 ± 5.4 |
| Freimann et al., 2016 [34] | Ethiopia | 404 | 45.0% | 1.7%/98.3% | 40.1 | - | 25.0 |
| Kgakge et al., 2019 [15] | Botswana | 200 | 89.8% | 25.0%/75.0% | 35.2 | 5.3 | - |
| Mailutha et al., 2020 [35] | Kenya | 314 | 77.7% | - | - | - | - |
| Moodley et al., 2020 [16] | South Africa | 125 | 68.0% | 22.4%/77.6% | 22.4 | - | - |
| Munabi et al., 2014 [36] | Uganda | 741 | 85.4% | 14.3%/85.7% | 35.4 ± 10.7 | 11.9 ± 10.5 | - |
| Mutanda et al., 2017 [37] | Uganda | 266 | 91.7% | 10.0%/90.0% | 39.2 | 14.0 | - |
| Muthelo et al., 2023 [38] | South Africa | 69 | 94.5% | 25.0%/75.0% | 42.1 | 14.7 | - |
| Nemera et al., 2024 [39] | Ethiopia | 397 | 97.8% | 62.5%/37.5% | 28.7 | 3.5 | - |
| Nkhata et al., 2015 [40] | Zambia | 267 | 98.8% | 18.0%/82.0% | 36.5 ± 9.4 | 11.9 ± 9.3 | - |
| Ojedoyin et al., 2025 [20] | Nigeria | 216 | - | 19.9%/80.1% | 20.5 | - | 22.3 ± 4.0 |
| Ouni et al., 2020 [41] | Tunisia | 310 | 95.0% | 45.8%/54.2% | 41.4 ± 5.7 | 8.2 ± 3.9 | 25.7 ± 2.2 |
| Sorour et al., 2012 [19] | Egypt | 58 | - | 31.0%/69.0% | 27.9 ± 8.4 | - | 25.0 |
| Tinubu et al., 2010 [42] | Nigeria | 118 | 80.0% | 2.5%/97.5% | 36.4 ± 7.7 | 11.8 ± 7.6 | 26.2 ± 4.6 |
| Yitayeh et al., 2015 [43] | Ethiopia | 389 | - | 46.3%/53.7% | 30.0 ± 5.8 | - | 22.3 ± 2.1 |
BMI: body mass index. Age, experience, and BMI are presented as mean ± SD when standard deviation was available. Otherwise, only the average value is reported.
Table 3 details the prevalence of WMSDs reported for each study for the nine body areas, as well as the overall prevalence (where data were available). The majority of studies reported all of this data. Only four studies did not report the total prevalence for the nine areas [16, 34, 35, 38], and two studies did not report the overall WMSD prevalence [31, 37].
WMSD prevalence by body area of the 19 included studies.
| Authors | Sample size | WMSD by body area | Overall WMSD prevalence | ||||||||
|---|---|---|---|---|---|---|---|---|---|---|---|
| Neck | Upper back | Lower back | Shoulders | Elbows/Forearms | Wrists/Hands | Hips/Thighs | Knees | Ankle/Foot | |||
| Ajibade et al., 2013 [31] | 138 | 20.3% | 23.3% | 70.3% | 21.0% | 8.7% | 18.1% | 31.9% | 28.3% | 26.8% | - |
| Alalagy et al., 2025 [32] | 215 | 52.6% | 42.3% | 68.8% | 47.4% | 14.4% | 37.7% | 21.4% | 48.4% | 33.5% | 92.1% |
| Brien et al., 2018 [33] | 59 | 8.8% | 23.5% | 73.5% | 41.2% | 2.9% | 17.7% | 17.7% | 26.5% | 26.5% | 61.0% |
| El Ata et al., 2016 [14] | 184 | 57.1% | 37.0% | 76.1% | 60.9% | 23.9% | 52.2% | 46.7% | 67.9% | 60.9% | 97.8% |
| Elghazally et al., 2023 [21] | 200 | 57.5% | 48.0% | 68.5% | 45.0% | 22.0% | 31.5% | 27.5% | 87.0% | 46.0% | 88.0% |
| Freimann et al., 2016 [34] | 404 | 55.7% | - | 56.9% | 30.9% | 12.4% | 20.0% | - | 31.2% | - | 70.0% |
| Kgakge et al., 2019 [15] | 200 | 15.0% | 32.7% | 68.6% | 36.8% | 3.6% | 8.2% | 10.9% | 14.5% | 23.2% | 90.9% |
| Mailutha et al., 2020 [35] | 314 | 20.4% | - | 32.5% | 20.4% | - | 6.3% | - | 11.3% | 21.5% | 74.2% |
| Moodley et al., 2020 [16] | 125 | 65.9% | 62.2% | 81.1% | 63.6% | 1.1% | 41.5% | 46.8% | 63.6% | - | 83.0% |
| Munabi et al., 2014 [36] | 741 | 36.9% | 35.8% | 61.9% | 32.6% | 15.4% | 29.1% | 27.9% | 37.1% | 38.1% | 80.8% |
| Mutanda et al., 2017 [37] | 266 | 24.1% | 24.1% | 58.7% | 20.7% | 11.0% | 24.8% | 26.6% | 38.5% | 29.7% | - |
| Muthelo et al., 2023 [38] | 69 | 9.0% | - | 43.0% | 22.0% | - | 12.0% | - | - | - | 38.0% |
| Nemera et al., 2024 [39] | 397 | 45.8% | 13.4% | 37.2% | 28.0% | 31.7% | 17.1% | 14.9% | 20.2% | 11.6% | 73.8% |
| Nkhata et al., 2015 [40] | 267 | 16.9% | 19.0% | 53.3% | 29.9% | 10.3% | 18.5% | 24.5% | 9.2% | 54.9% | 77.9% |
| Ojedoyin et al., 2025 [20] | 216 | 66.2% | 56.0% | 72.9% | 57.0% | 16.4% | 52.7% | 40.6% | 30.4% | 34.3% | 95.0% |
| Ouni et al., 2020 [41] | 310 | 28.2% | 36.9% | 68.5% | 21.5% | 20.1% | 18.1% | 0.7% | 34.5% | 20.8% | 48.1% |
| Sorour et al., 2012 [19] | 58 | 67.2% | 55.2% | 63.8% | 65.5% | 25.9% | 50.0% | 29.3% | 44.8% | 44.8% | 63.8% |
| Tinubu et al., 2010 [42] | 118 | 20.3% | 23.3% | 70.3% | 21.0% | 8.7% | 18.1% | 31.9% | 28.3% | 26.8% | 78.0% |
| Yitayeh et al., 2015 [43] | 389 | 30.0% | 17.2% | 14.1% | 45.0% | 15.4% | 3.1% | 2.6% | 7.2% | 21.1% | 9.3% |
WMSD: work-related musculoskeletal disorder.
Seventeen studies quantified the overall prevalence among African nurses. The pooled prevalence was 74.6% (95% CI: 67.0−82.3%, n = 4,266 participants, Figure 2) using a random effects model. Two studies reported a prevalence of less than 50% [38, 41]. Four studies measured a prevalence higher than 90% [14, 15, 20, 32].
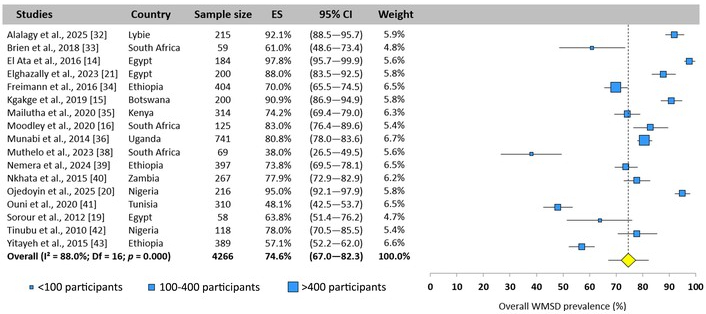
Overall WMSD prevalence pooled for all African nurses. Each blue square represents the mean value reported for each cross-sectional study. The size of the squares is proportional to the sample size (< 100; 100–400; > 400 participants). The yellow diamond represents the pooled prevalence across all 17 studies. The horizontal line is the 95% confidence interval (95% CI). ES: effect size; WMSD: work-related musculoskeletal disorder.
The neck, lower back, shoulder, and wrist were the most studied areas, as the 19 studies included reported prevalence rates. The lower back (59.5%), neck (35.4%), and knee (34.4%) were the three most affected areas, while the elbow was the least exposed area (12.9%). The following paragraphs present the prevalence values for each body area.
All included studies reported a neck WMSD prevalence ranging from 8.8% [33] to 67.2% [19]. The total prevalence was estimated at 35.4% (95% CI: 28.0–42.8%, n = 4,670 participants, random-effects model, Figure 3).
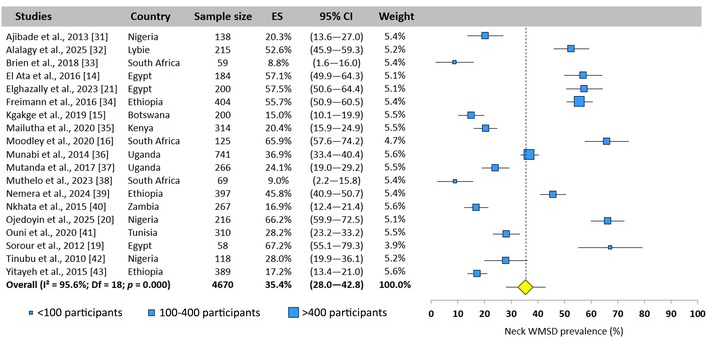
Neck WMSD prevalence pooled for all African nurses. Each blue square represents the mean value reported for each cross-sectional study. The size of the squares is proportional to the sample size (< 100; 100–400; > 400 participants). The yellow diamond represents the pooled prevalence across all 19 studies. The horizontal line is the 95% confidence interval (95% CI). ES: effect size; WMSD: work-related musculoskeletal disorder.
Sixteen of the 19 studies reported a prevalence for the upper back. Values ranged from 13.4% [39] to 62.2% [16]. The pooled prevalence was 32.8% (95% CI: 26.1–39.4%, n = 3,883 participants, random-effects model, Figure 4).
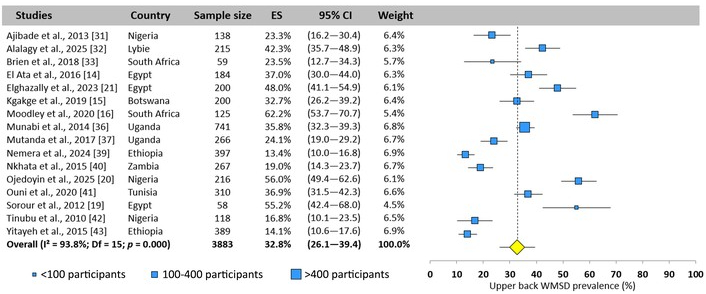
Upper back WMSD prevalence pooled for all African nurses. Each blue square represents the mean value reported for each cross-sectional study. The size of the squares is proportional to the sample size (< 100; 100–400; > 400 participants). The yellow diamond represents the pooled prevalence across all 16 studies. The horizontal line is the 95% confidence interval (95% CI). ES: effect size; WMSD: work-related musculoskeletal disorder.
The lower back was one of the most studied areas, with a reported value for each included study, and the most exposed area, with a pooled prevalence of 59.5% (95% CI: 52.8–66.2%, n = 4,670 participants, random-effects model, Figure 5). There was considerable heterogeneity between studies, with values ranging from 32.5% [35] to 81.1% [16].
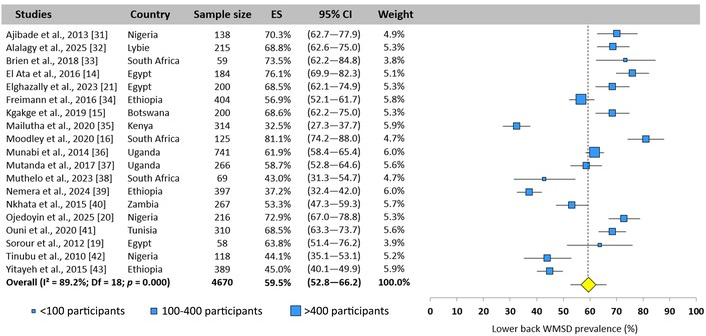
Lower back WMSD prevalence pooled for all African nurses. Each blue square represents the mean value reported for each cross-sectional study. The size of the squares is proportional to the sample size (< 100; 100–400; > 400 participants). The yellow diamond represents the pooled prevalence across all 19 studies. The horizontal line is the 95% confidence interval (95% CI). ES: effect size; WMSD: work-related musculoskeletal disorder.
All included studies reported a prevalence of WMSDs for the shoulder. Significant heterogeneity was encountered, with values ranging from 12.6% [42] to 65.5% [19]. The total prevalence was estimated at 33.8% (95% CI: 28.2–39.5%, n = 4,670 participants, random-effects model, Figure 6).
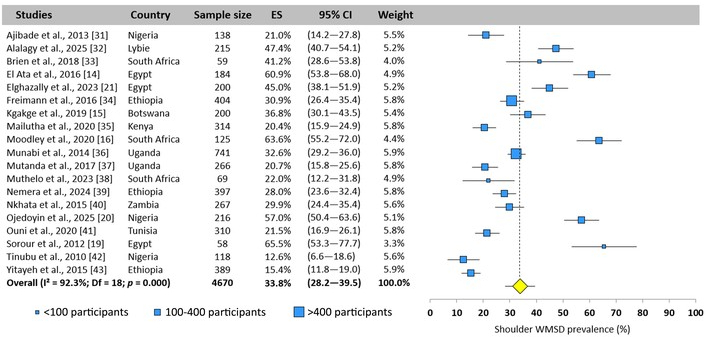
Shoulder WMSD prevalence pooled for all African nurses. Each blue square represents the mean value reported for each cross-sectional study. The size of the squares is proportional to the sample size (< 100; 100–400; > 400 participants). The yellow diamond represents the pooled prevalence across all 19 studies. The horizontal line is the 95% confidence interval (95% CI). ES: effect size; WMSD: work-related musculoskeletal disorder.
The elbow was the area least affected by WMSDs among African nurses, with a pooled prevalence of 12.9% (95% CI: 9.1–16.7%, n = 4,287 participants, random-effects model, Figure 7). Among the 17 studies, values ranged from 1.1% [16] to 31.7% [39].
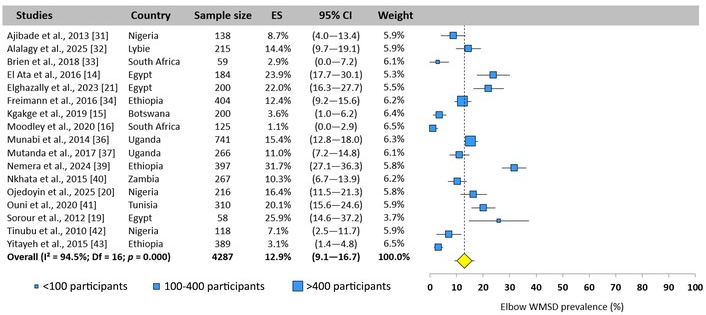
Elbow WMSD prevalence pooled for all African nurses. Each blue square represents the mean value reported for each cross-sectional study. The size of the squares is proportional to the sample size (< 100; 100–400; > 400 participants). The yellow diamond represents the pooled prevalence across all 17 studies. The horizontal line is the 95% confidence interval (95% CI). ES: effect size; WMSD: work-related musculoskeletal disorder.
The wrist was also an area examined by all studies. The overall prevalence was established at 24.0% (95% CI: 18.1–30.0%, n = 4,670 participants, random-effects model, Figure 8) with significant heterogeneity. A 50% variation was observed between studies, with prevalence ranging from 2.6% [43] to 52.7% [20]).
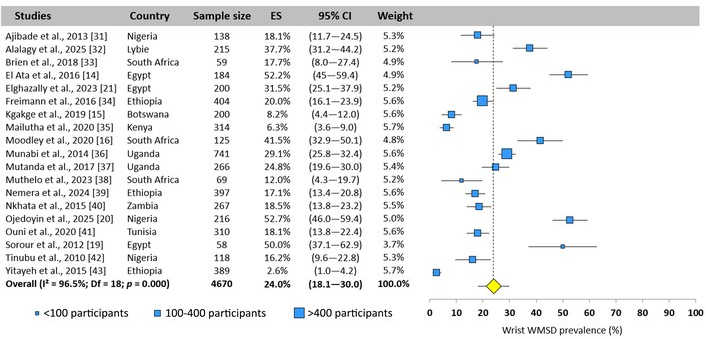
Wrist WMSD prevalence pooled for all African nurses. Each blue square represents the mean value reported for each cross-sectional study. The size of the squares is proportional to the sample size (< 100; 100–400; > 400 participants). The yellow diamond represents the pooled prevalence across all 19 studies. The horizontal line is the 95% confidence interval (95% CI). ES: effect size; WMSD: work-related musculoskeletal disorder.
Sixteen studies reported a prevalence value. A difference between prevalence values of 40% was observed (3.4% [42] to 46.8% [16]). The total prevalence was pooled at 23.0% (95% CI: 16.3–29.7%, n = 3,883 participants, random-effects model, Figure 9).
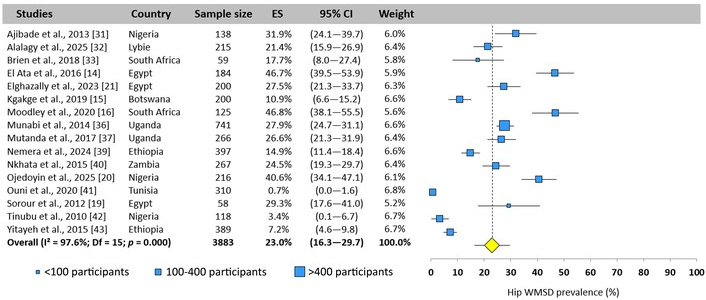
Hip WMSD prevalence pooled for all African nurses. Each blue square represents the mean value reported for each cross-sectional study. The size of the squares is proportional to the sample size (< 100; 100–400; > 400 participants). The yellow diamond represents the pooled prevalence across all 16 studies. The horizontal line is the 95% confidence interval (95% CI). ES: effect size; WMSD: work-related musculoskeletal disorder.
The knee is one of the three areas most exposed to WMSDs. Eighteen of the 19 studies included reported a prevalence. The values collected for this area showed the greatest heterogeneity, with a difference of nearly 80% (9.2% [40] to 87.0% [21]). Ten studies were close to the pooled mean value of 34.4% (95% CI: 27.2–41.6%, n = 4,601 participants, random-effects model, Figure 10).
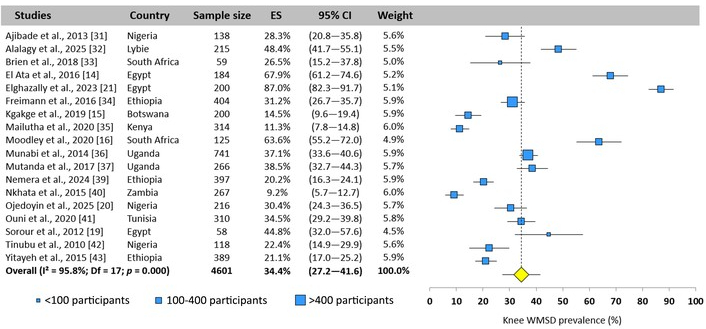
Knee WMSD prevalence pooled for all African nurses. Each blue square represents the mean value reported for each cross-sectional study. The size of the squares is proportional to the sample size (< 100; 100–400; > 400 participants). The yellow diamond represents the pooled prevalence across all 18 studies. The horizontal line is the 95% confidence interval (95% CI). ES: effect size; WMSD: work-related musculoskeletal disorder.
On the average, 30.1% of nurses were affected by WMSDs in the ankle area (95% CI: 23.1–37.1%, n = 4,072 participants, random-effects model, Figure 11) with significant heterogeneity between the values reported by the 16 studies that investigated this area. A difference of 50% was found, with 9.3% [43] for the lowest value and 60.9% [14] for the highest.
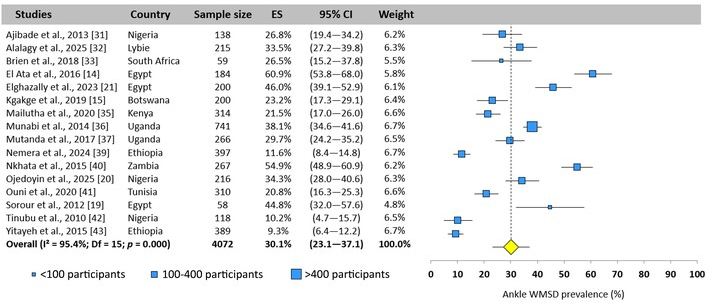
Ankle WMSD prevalence pooled for all African nurses. Each blue square represents the mean value reported for each cross-sectional study. The size of the squares is proportional to the sample size (< 100; 100–400; > 400 participants). The yellow diamond represents the pooled prevalence across all 16 studies. The horizontal line is the 95% confidence interval (95% CI). ES: effect size; WMSD: work-related musculoskeletal disorder.
Figure 12 presents a summary of the WMSDs prevalence among African nurses, based on the 19 studies included.
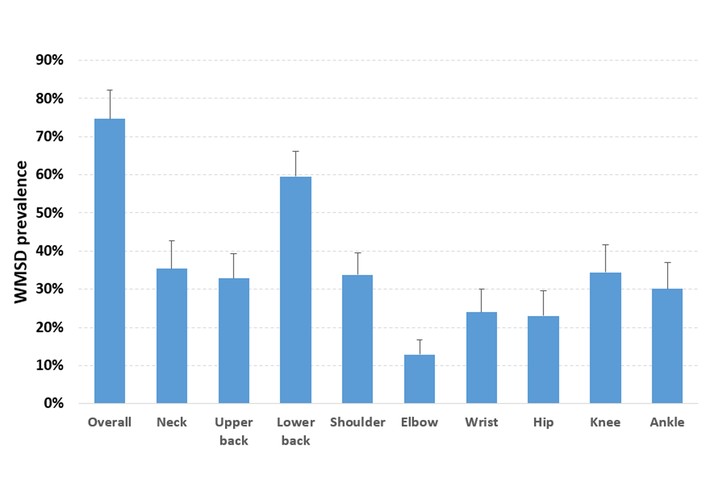
Pooled overall WMSD prevalence and by body area across all included studies. Vertical bars represent the 95% confidence interval; WMSD: work-related musculoskeletal disorder.
The effect of nurses’ age on prevalence was investigated using a meta-regression for the nine body areas and overall prevalence. Four negative correlations were observed for the neck, shoulders, wrists, and hips (Table 4).
Correlation between age and WMSD prevalence.
| WMSD by body area | Age | |
|---|---|---|
| Pearson’s r | p-value | |
| Neck | –0.542 | 0.025* |
| Upper back | –0.452 | 0.091 |
| Lower back | –0.209 | 0.422 |
| Shoulders | –0.566 | 0.018* |
| Elbows/Forearms | –0.087 | 0.750 |
| Wrists/Hands | –0.498 | 0.042* |
| Hips/Thighs | –0.554 | 0.032* |
| Knees | –0.165 | 0.542 |
| Ankles/Feet | –0.023 | 0.938 |
| Overall | –0.368 | 0.178 |
* p < 0.05. WMSD: work-related musculoskeletal disorder.
The first analysis was carried out by successively excluding studies one by one for the overall prevalence (Figure 13) and for lower back (Figure 14), which was the most affected body area. A good stability of the presented results was observed, since no study had a significant impact on prevalence (maximum difference of 2.2% for overall and 1.5% for lower back prevalence compared to the value pooled from all studies). A second analysis was conducted by comparing the pooled prevalence from all studies and only those with a low risk of bias. Table 5 summarizes the results for each body area. The results showed good stability, as the observed differences were less than or equal to 1.5%.
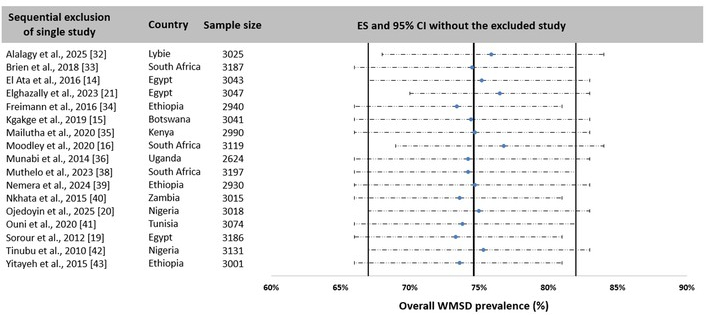
Synthesis of overall WMSD prevalence sensitivity analysis by sequentially excluding studies one by one. Each horizontal line represents the pooled prevalence of all studies without the reference cited in the first column. The central blue circle indicates the mean prevalence. The dotted line represents the 95% CI. The three vertical lines represent the prevalence (central line) and the 95% CI (outer lines) pooled from all 17 included studies. CI: confidence interval; ES: effect size; WMSD: work-related musculoskeletal disorder.
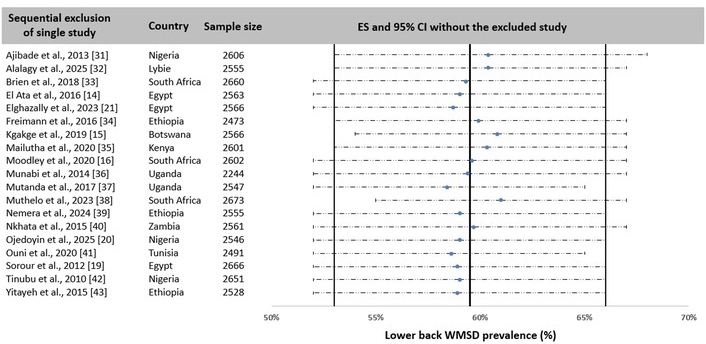
Synthesis of lower back WMSD prevalence sensitivity analysis by sequentially excluding studies one by one. Each horizontal line represents the pooled prevalence of all studies without the reference cited in the first column. The central blue circle indicates the mean prevalence. The dotted line represents the 95% CI. The three vertical lines represent the prevalence (central line) and the 95% CI (outer lines) pooled from all 19 included studies. CI: confidence interval; ES: effect size; WMSD: work-related musculoskeletal disorder.
Sensitivity analysis of studies: effect of quality on prevalence.
| WMSD by body area | All studies | High quality only | ||
|---|---|---|---|---|
| Prevalence | 95% CI | Prevalence | 95% CI | |
| Neck | 35.4% | 28.0–42.8% | 36.4% | 28.5–44.3% |
| Upper back | 32.8% | 26.1–39.4% | 32.8% | 26.1–39.4% |
| Lower back | 59.5% | 52.8–66.2% | 61.0% | 54.9–67.2% |
| Shoulder | 33.8% | 28.2–39.5% | 34.7% | 28.7–40.7% |
| Elbow | 12.9% | 9.1–16.7% | 12.9% | 9.1–16.7% |
| Wrist | 24.0% | 18.1–30.0% | 25.2% | 18.7–31.7% |
| Hip | 23.0% | 16.3–29.7% | 23.0% | 16.3–29.7% |
| Knee | 34.4% | 27.2–41.6% | 35.9% | 28.4–43.3% |
| Ankle | 30.1% | 23.1–37.1% | 30.8% | 23.2–38.4% |
| Overall | 74.6% | 67.0–82.3% | 74.7% | 66.5–82.9% |
CI: confidence interval; WMSD: work-related musculoskeletal disorder.
The present systematic review and meta-analysis was conducted to investigate the prevalence of WMSDs among African nurses. Nineteen studies allowed the analysis of the overall and body area WMSD prevalence.
The overall prevalence of MSDs reached a high value of 74.6% (95% CI: 67.0–82.3%). These values are of the same order of magnitude as those presented by Kgakge et al. [17] based on 18 studies in sub-Saharan Africa. The authors assessed the overall prevalence using a range (57.1% to 95.7%) but without combining all values in a meta-analysis. This prevalence is also comparable to that reported worldwide by Ellapen and Narsigan [44] (71.85%, 13,317 nurses, 27 studies) and Sun et al. [7] (77.2%, 36,934 nurses, 42 studies). However, it is 10% lower than the prevalence observed in Europe (87.8%, 95% CI: 83.3–92.2% [23]) and Asia (84.3%, 95% CI: 81.1–87.4% [22]). This difference could be linked to differences in working conditions, whether in terms of workload, the organization of different departments, or the resources available for care. Studies have shown that working conditions have a direct impact on the onset of WMSDs, particularly between departments [45]. A detailed analysis of these working conditions across continents would be useful in identifying the main causes of WMSDs and thus suggesting adjustments with the aim of reducing their overall prevalence.
The present analysis showed that the lower back was the most exposed area, with a prevalence of 59.5% (95% CI: 52.8–66.2%). This value is slightly lower than that reported by Kasa et al. [18], which was 64.1% among nurses in Africa, and equivalent to the values observed on other continents [22, 23]. Recent studies have proposed an integrated analysis of different health professions [46, 47]. The authors showed that the prevalence for the lower back (44.8% and 54.5%, respectively) was lower than that observed among nurses. Therefore, this result reveals that nurses are the healthcare professionals most exposed to WMSDs in the lower back, with more than one in two nurses suffering from recurrent pain due to their professional practice.
The neck ranks second with a prevalence of 35.4% (95% CI: 28.0–42.8%). As for the overall prevalence, this prevalence appears to be more than 10% lower than that observed in Europe (49.9%) [23] and Asia (45.7%) [22]. The reason for this difference could be the same as that observed for overall prevalence, namely differences in working conditions or demographic differences, which do not seem to affect the prevalence of lower back pain.
Although the various studies agree on the lower back and neck, the third most affected area depends on the continent. In Europe, the results showed that the upper back (46.3%) had the third highest prevalence, while in Asia, it was the shoulder (43.0%). In the present study, the third most common area was the knee, with a prevalence of 34.4% (95% CI: 27.2–41.6%). This result suggests that nurses’ activities may differ depending on the institution, country, and continent. The high prevalence in the knee, observed in other studies [48, 49], could be explained by more frequent displacements, heavy lifting, or more numerous patient transfers. It therefore seems important to analyze nurses’ activities in Africa in more detail over the course of a day, as proposed by Al-Moteri et al. [50] or Michel et al. [51], with a precise timed description of the routine tasks performed during a shift.
Other areas showed a significant prevalence between 25% and 35%, which, like the most exposed areas, requires special attention. However, it should be noted that prevalence rates in these areas remain lower than those observed on other continents [22, 23] or worldwide [5, 7].
Meta-regression showed an effect of age on the prevalence in four body areas, i.e., neck, shoulders, wrists, and hips. Correlations showed a decrease in prevalence with age. This result contrasts with those reported in the literature, where older nursing populations had a higher prevalence [52]. Such a difference could be explained by a change in care activities with age in Africa, as indicated by Mailutha et al. [35]. The authors emphasized that younger nurses primarily perform tasks that require significant physical exertion, while older nurses perform more supervisory and administrative tasks. This work distribution would result in older nurses spending less time with patients, which would reduce their prevalence of WMSDs [42]. Other authors have reported peaks in prevalence among nurses aged 30 to 45 [53, 54], suggesting that older nurses have a lower prevalence. This hypothesis could be reinforced by a quantitative study of the time spent performing different tasks [51, 55] by age group during their shift to highlight these differences.
The statistical indicators revealed significant heterogeneity in the results reported by the various studies included (I2 > 80%). This effect was taken into account by using a random effect model in the meta-analysis. This heterogeneity can be explained by various factors. The variation in the sample size investigated in the studies (ranging from 58 to 741) is the first source of variability. The type of questionnaire used may also lead to disparity in the results. In addition to the subjective aspect, the different wording of the questions may contribute to the heterogeneity of prevalence reported. Demographic characteristics (age, height, weight, experience, etc.), working conditions (workload, hours, etc.), departments (emergency, intensive care, etc.), type of establishment (private, public, etc.) and geographical location (different African countries) are all factors that contribute to the variability in the prevalence of WMSDs and therefore to the heterogeneity of the results.
Some limitations could be addressed. These are mainly related to methodology. The first concerns the choice of free databases. The use of other databases, such as Web of Science or Scopus, could have identified other relevant studies. The second relates to the decision to include only peer-reviewed original studies written in English with a specific keyword combination. These criteria may have led to the omission of some relevant studies that could have enriched the analysis of WMSDs among African nurses. The third limitation relates to the overall objective of the study. In order to produce a comprehensive analysis for the African continent as a whole, no restrictions were applied in terms of demographic parameters or working conditions (particularly the department to which the nurses belonged). As a result, a high degree of heterogeneity in the results was observed. Finally, the diversity of the questionnaires used to collect data on overall prevalence and prevalence by body area may also be a source of variability in the results presented in this study and thus constitutes another limitation.
The results of this study highlighted that there was a difference in the prevalence of WMSDs among nurses between continents. However, it is difficult to attribute these differences to clearly defined causes. Although several studies have reported various risk factors associated with the onset of WMSDs [52, 56], detailed analyses of the activities performed by nurses are needed to better identify the activities that contribute most to the development of WMSDs. An ergonomic analysis of awkward postures (one of the most significant risk factors) could provide additional parameters for assessing risky activities. As demographic and geographic factors have an effect on prevalence and are sources of heterogeneity, a subgroup analysis (by age, specialty, location, etc.) could provide a better understanding of the effect of these parameters on the occurrence of WMSDs. The study of working conditions, particularly the layout of workspaces, the ergonomics of equipment, and the organization of working hours, as well as raising nurses’ awareness of WMSD risk factors, must be continued in order to propose appropriate health policies aimed at reducing the risk of WMSDs.
In conclusion, African nurses are highly exposed to WMSDs (74.6%). The meta-analysis showed that the most exposed area was the lower back (59.5%). The knee, upper back, neck, shoulder, and ankle had a prevalence between 30% and 35%. Comparison of these results with the literature showed that African nurses were less affected than those on other continents. However, due to the multifactorial aspect of WMSD risks among nurses, it is necessary to continue research projects and educational activities, as well as the development of health policies aimed at improving the quality of life at work.
AXIS: cross-sectional study assessment tool
BMI: body mass index
CI: confidence interval
PECOs: participants, exposures, comparisons, outcomes
PRISMA: Preferred Reporting Items for Systematic Reviews and Meta-Analyses
WMSDs: work-related musculoskeletal disorders
PG: Conceptualization, Methodology, Software, Validation, Formal analysis, Investigation, Resources, Data curation, Writing—original draft, Writing—review & editing, Visualization, Supervision, Project administration. JJB: Conceptualization, Methodology, Software, Validation, Formal analysis, Investigation, Resources, Data curation, Writing—original draft, Writing—review & editing, Visualization. Both authors read and approved the submitted version.
Philippe Gorce, Associate Editor and Guest Editor of Exploration of Musculoskeletal Diseases, was not involved in the decision-making or review process of this manuscript. The other author declares no conflicts of interest.
Not applicable.
Not applicable.
Not applicable.
All relevant data are contained within the manuscript.
Not applicable.
© The Author(s) 2026.
Open Exploration maintains a neutral stance on jurisdictional claims in published institutional affiliations and maps. All opinions expressed in this article are the personal views of the author(s) and do not represent the stance of the editorial team or the publisher.
Copyright: © The Author(s) 2026. This is an Open Access article licensed under a Creative Commons Attribution 4.0 International License (https://creativecommons.org/licenses/by/4.0/), which permits unrestricted use, sharing, adaptation, distribution and reproduction in any medium or format, for any purpose, even commercially, as long as you give appropriate credit to the original author(s) and the source, provide a link to the Creative Commons license, and indicate if changes were made.

Antonina D.S. Pavilanis ... Michael J.L. Sullivan
Philippe Gorce, Julien Jacquier-Bret
Raquel Ferreira Araruna de Carvalho, Márcio Alves Marçal
Youssef Habib ... Peter J. Keir
Mário Lopes, Marisa Lages
João Alberto de Souza Ribeiro, Luciana Aparecida Giacomini
Adrian Low, Benny Lam
Annalisa Bertoli ... Cesare Fantuzzi
