Original Article


Affiliation:
1Department of Epidemiology, Boston University School of Public Health, Boston, MA 02118, USA
ORCID: https://orcid.org/0009-0005-9928-1096

 ,
Affiliation:
2Department of Anatomy & Neurobiology, Boston University Chobanian & Avedisian School of Medicine, Boston, MA 02118, USA
3The Framingham Heart Study, Boston University Chobanian & Avedisian School of Medicine, Boston, MA 02118, USA
ORCID: https://orcid.org/0000-0001-6495-3087
,
Affiliation:
1Department of Epidemiology, Boston University School of Public Health, Boston, MA 02118, USA
2Department of Anatomy & Neurobiology, Boston University Chobanian & Avedisian School of Medicine, Boston, MA 02118, USA
3The Framingham Heart Study, Boston University Chobanian & Avedisian School of Medicine, Boston, MA 02118, USA
Email: phhwang@bu.edu
ORCID: https://orcid.org/0000-0001-6780-6808

Explor Med. 2026;7:1001436 DOI: https://doi.org/10.37349/emed.2026.1001436
Received: June 10, 2026 Accepted: September 09, 2026 Published: November 11, 2026
Academic Editor: Hua Su, University of California, USA
Aim: Social engagement is associated with preserved cognition in older adults. We evaluated the predictive value of structural and functional social network characteristics for cognitive resilience among adults aged ≥ 80 years using machine learning models.
Methods: We included Framingham Heart Study Offspring participants aged ≥ 80 years and free of dementia at Exam 8 (2005–2008). Eleven social network measures were assessed using the Berkman-Syme Social Network Index. Cognitive resilience was defined as remaining dementia-free through December 2024. Minimum Redundancy Maximum Relevance (mRMR) identified informative features, and principal component analysis (PCA) characterized their multidimensional structure. Logistic regression, classification and regression trees, random forest, XGBoost, and LightGBM were evaluated using five-fold cross-validation. Performance was assessed using area under the receiver operating characteristic curve (AUC), sensitivity, specificity, positive predictive value (PPV), negative predictive value, F1 score, and balanced accuracy. SHapley Additive exPlanations (SHAP) was used to interpret the best-performing model.
Results: The sample of 141 participants consisted of 56.7% females with a median age of 82 years. In total, 107 participants were cognitively resilient. The most frequently selected feature was “Feeling love and affection”. PCA identified one component reflecting overall social connectedness and support (PC1) and another reflecting interaction with friends and social activities (PC2). LightGBM including PC1 and PC2 had the highest discrimination (AUC = 0.694; 95% CI: 0.456–0.897), with PPV = 0.850, F1 = 0.654, and balanced accuracy = 0.616. Within LightGBM, AUC increased from 0.613 to 0.694 after adding PC1 and PC2. SHAP ranked PC1 and PC2 among the four most influential predictors.
Conclusions: Social network characteristics reflecting perceived love, emotional support, family connections, and social interaction may provide incremental predictive information for cognitive resilience. However, overall predictive performance was modest, and larger, more diverse studies incorporating broader biological, behavioral, and clinical factors are needed.
At advanced ages, chronological aging constitutes the most prominent risk factor for cognitive decline and dementia, reflecting the cumulative burden of neurobiological changes associated with brain aging [1–3]. The incidence and prevalence of Alzheimer’s disease and related dementias (ADRD) increase substantially among the oldest adults, making dementia increasingly common in this age group. In 2025, an estimated 7.2 million Americans aged 65 years and older are living with ADRD, and the prevalence rises markedly across older age groups, from 5.1% among individuals aged 65–74 years to 33.4% among those aged 85 years and older [4]. Nevertheless, a considerable proportion of the oldest adults maintain relatively preserved cognitive function despite surviving to ages associated with high dementia risk. This heterogeneity in late-life cognitive outcomes suggests that factors beyond chronological aging alone may contribute to protection against cognitive decline and dementia. Cognitive resilience, defined as the capacity to preserve cognitive function despite age-related neuropathological changes [5, 6], represents a critical mechanism for mitigating cognitive decline and reducing the risk of ADRD [7–11]. Accordingly, identifying factors that predict or promote cognitive resilience is of considerable importance for improving late-life quality of life and facilitating healthy cognitive aging.
Among the candidate factors, social network characteristics have been consistently associated with better cognitive performance, slower cognitive decline, and a reduced risk of dementia incidence in older populations [12–16]. One plausible mechanism underlying this association is cognitive reserve. Animal studies have demonstrated that enriched social and intellectual environments enhance the brain’s capacity to compensate for ADRD-related neuropathological damage by rescuing impaired neurogenesis and enhancing synaptic plasticity [17, 18]. Through these hypothesized mechanisms, individuals with more robust social networks may be better equipped to buffer against the deleterious effects of neurodegenerative disease processes on cognitive function. Epidemiological evidence further suggests that social relationships may exert neuroprotective effects by attenuating the impact of regional brain atrophy, including limbic structures such as the amygdala, which plays a key role in emotional processing and social behavior [19–22]. Therefore, these findings support the hypothesis that social network indices may serve as promising predictors of cognitive resilience in late life.
Social networks are inherently multidimensional and can be broadly conceptualized as comprising structural and functional domains [23]. The structural domain captures the quantitative aspects of social relationships, including network size, diversity of social ties, and frequency of interpersonal contact. In contrast, the functional domain reflects the qualitative dimensions of social engagement, encompassing perceived social support, emotional closeness, companionship, and social strain. A range of validated instruments has been developed to assess these complementary aspects of social relationships [24]. However, although epidemiological studies have consistently demonstrated associations between the social network and cognitive resilience [19, 25–27], few studies have developed cognitive resilience prediction models that incorporate a diverse set of social network measures. Additionally, existing models on the risk of ADRD typically rely on simplified or global indicators of social relationships, which may not fully capture their multidimensional nature [16, 28–31].
The Berkman-Syme Social Network Index (SNI) represents a relatively comprehensive measure that integrates both structural and functional components of social networks [32]. Specifically, it includes quantitative indicators such as network size, social participation, organizational membership, and frequency of contact, as well as qualitative dimensions including perceived social support and emotional connectedness. Using data from a well-established community-based cohort, the Framingham Heart Study (FHS), we sought to address two key research questions: (1) Which dimensions of social network characteristics are most strongly predictive of cognitive resilience among adults aged 80 years and older? (2) To what extent do multidimensional social network characteristics, along with demographic and health-related factors, contribute to the prediction of cognitive resilience? To address these questions, we aimed to employ the SNI to explore the predictive value of social network components on cognitive resilience with machine learning approaches in the context of extreme aging. This study helps to advance the understanding of the predictive value of multidimensional social network characteristics for cognitive resilience in late life and to inform future strategies for promoting healthy cognitive aging.
The FHS was designed to identify risk factors or determinants of cardiovascular disease (CVD), while later the research expanded to a broader spectrum of public health challenges [33]. FHS consists of a series of multigenerational cohorts of residents from Framingham, MA. Participants of the Original Cohort were enrolled in 1948, and in 1971, their adult children and spouses were recruited as the Offspring Cohort [34]. For this analysis, we selected 166 participants who were aged ≥ 80 years and completed the SNI questionnaire at Exam 8 (2005–2008) from the FHS Offspring cohort. Participants from the Offspring cohort regularly attend the clinical exams every four to eight years, during which their demographic information, clinical health index, lifestyle factors, medical treatment, and disease diagnosis status are collected. We excluded 25 individuals from the sample based on the following exclusion criteria: (1) being diagnosed with all-cause dementia at or before the baseline exam (e.g., Exam 8) (N = 11); and (2) missing data on covariate variables (N = 14), including 5 with missing marital status, 2 with missing APOE ε4 status, and 7 with missing CVD risk score. Written informed consent was obtained from all participants prior to enrollment in FHS, and the study protocol was approved by the Boston University Medical Campus Institutional Review Board (IRB; approval number H-43332). The study was conducted in accordance with the Declaration of Helsinki.
The social network measurement was assessed through the self-administered Berkman-Syme SNI questionnaire between March 2005 and August 2009. The SNI captures both structural and functional dimensions of social relationships through 11 categorical indices, including network size (e.g., number of relatives and friends), social participation (e.g., involvement in community or religious activities), frequency of contact, and perceived social support (e.g., availability of emotional support, companionship, and expressions of love and affection). Details of the individual indices and their categorizations are provided in Table 1.
Berkman-Syme Social Network Index components.
| Social Network Index | Category |
|---|---|
| b1. How many close friends do you have, people that you feel at ease with, can talk to about private matters? | (1) ≤ 2(2) > 2 |
| b2. How many of these close friends do you see at least once a month? | (1) ≤ 2(2) > 2 |
| b3. How many relatives do you have, people, that you feel at ease with, can talk to about private matters? | (1) ≤ 2(2) > 2 |
| b4. How many of these relatives do you see at least once a month? | (1) ≤ 2(2) > 2 |
| b5. Do you participate in any groups such as a senior center, social or work group, religious-connected group, self-help group, or charity, public service, or community group? | (1) No(2) Yes |
| b6. About how often do you go to religious meetings or services? | (1) Never or almost never/Once or twice a year(2) Every few months or more frequently |
| b7. Is there someone available to you whom you can count on to listen to you when you need to talk? | (1) None/a little of the time(2) Some/most/all of the time |
| b8. Is there someone available to give you good advice about a problem? | (1) None/a little of the time(2) Some/most/all of the time |
| b9. Is there someone available to you who shows you love and affection? | (1) None/a little of the time(2) Some/most/all of the time |
| b10. Can you count on anyone to provide you with emotional support (talking over problems or helping you make a difficult decision)? | (1) None/a little of the time(2) Some/most/all of the time |
| b11. Do you have as much contact as you would like with someone you feel close to, someone in whom you can trust and confide? | (1) None/a little of the time(2) Some/most/all of the time |
Among adults aged ≥ 80 years [35], age represents the predominant risk factor for cognitive impairment and dementia [36]. Therefore, cognitive resilience was defined as the absence of incident all-cause dementia from the baseline examination through December 31, 2024. Dementia diagnoses were determined through consensus review, including at least one neurologist and one neuropsychologist, for participants identified as cognitively impaired based on neuropsychological and/or neurological evaluations conducted during follow-up.
Demographic factors included age at baseline, sex, education level, and marital status. Genetic factors included APOE genotype. Framingham CVD risk score incorporates age, HDL cholesterol, total cholesterol, smoking status, diabetes, and systolic blood pressure. Due to the small sample size, the CVD risk score alone was expected to partially capture lifestyle factors and health status that might confound the relationship while reducing model complexity. Details of the CVD risk score calculation could be found in the previous paper [37]. Education level was categorized into: (1) High school graduate or lower; (2) Some college; and (3) College graduate. Marital status was dichotomized into: (1) Married/Living with partner; and (2) Single, separated, divorced, or widowed. APOE genotype was grouped as: (1) ε4 non-carrier, and (2) ε4 carrier (e.g., at least one ε4 allele). Covariates were measured at the analytical baseline examination.
First, descriptive analyses were performed for all variables in the overall study population and stratified by cognitive resilience status. We applied Q-Q plots and the Shapiro–Wilk test to examine the normality of age and the Framingham CVD risk score. As age showed a skewed distribution, we reported its median (25th–75th percentile). Framingham CVD risk score was reported as the mean and standard deviation (SD). Categorical variables were reported using counts (percentages). Characteristic differences between the two outcome groups were assessed using chi-square tests for categorical variables and Kruskal–Wallis tests for continuous variables. To examine the potential selection bias, we compared the basic characteristics of the excluded participants due to missing covariates with those of the study sample.
Second, we conducted Spearman rank correlations among the eleven social network features to examine their multicollinearity.
Third, we applied Minimum Redundancy Maximum Relevance (mRMR) along with five-fold cross-validation across 100 repetitions to obtain the importance of the eleven social network features on cognitive resilience. The mRMR framework is an iterative algorithm selecting features that have the strongest relevance to the target variable, while minimizing redundancy among features, thereby reducing the inclusion of highly correlated or overlapping predictors. For each iteration, mRMR selected five indices. The features were ranked from the most to the least important based on their selection counts.
Fourth, we conducted principal component analysis (PCA) on the eleven social network features to reduce the dimensions and redundancy. Before conducting PCA, we used Cronbach’s alpha to assess the internal consistency of the social network features and evaluated the suitability of the data using the Kaiser–Meyer–Olkin (KMO) measure of sampling adequacy and Bartlett’s test of sphericity. The first two principal components (PC1 and PC2) were retained and included as predictors in the subsequent machine-learning models.
Fifth, we selected five candidate models, including logistic regression, classification and regression trees (CART), random forest, XGBoost, and LightGBM, to build the predictive models for cognitive resilience. We conducted four Step models for each algorithm. Model 1 used demographic characteristics only, including age, sex, education, and marital status. Model 2 additionally included APOE genotype and the Framingham CVD risk score. Model 3a further incorporated PC1, and Model 3b incorporated both PC1 and PC2. We randomly split 70% of the data into a training set and the remainder into a test set. Within the training data, we conducted hyperparameter tuning using 5-fold cross-validation based on mean validation AUC. Then we trained the models with the optimal hyperparameters using the full training data and evaluated the performance using the test data. To deal with the imbalanced cognitive resilience outcome, inverse-frequency class weights were incorporated during model training, assigning greater weight to the minority class.
The prediction performance metrics were receiver operating characteristic (ROC) curves, average AUC, F1, sensitivity, specificity, positive predictive value (PPV), negative predictive value (NPV), and balanced accuracy [38]. To evaluate the uncertainty of the performance metrics, we used the bootstrap method to assess the 95% confidence interval (95% CI). Model calibration was assessed using calibration plots. To evaluate predictors’ contribution, SHapley Additive exPlanations (SHAP) analysis was conducted for the LightGBM Model 3b. Mean absolute SHAP values were used to assess global feature importance, and a SHAP summary plot visualized each predictor’s contribution to the predicted probability of cognitive resilience.
Data cleaning, statistical analyses, and visualization were conducted using RStudio (version 4.5.2), primarily using the pROC (version 1.19.0.1), caret (version 7.0.1), xgboost (version 3.2.1.1), lightgbm (version 4.7.0) packages, fastshap (version 0.3.0), praznik (version 12.0.0), and SAS (version 9.4).
In total, the sample included 141 participants, with 56.7% being female (N = 80) and 56% being married or living with a partner (N = 79). The median age of the study sample was 82 years, with a 25th percentile of 81 years and a 75th percentile of 84 years, and 63.1% of individuals (N = 89) had a college experience or higher. In total, 107 (75.9%) participants were classified as cognitively resilient. Compared with non-cognitively resilient participants, cognitively resilient individuals were more likely to be male (47.7% vs. 29.4%), APOE ε4 non-carriers (88.8% vs. 76.5%), and college-educated (67.3% vs. 50.0%). The median age and marital status were similar between the two groups. Cognitively resilient participants also tended to report larger social networks and greater social engagement, including having more than two relatives (74.8% vs. 67.6%), participating in at least one social group (69.2% vs. 61.8%), and seeing more than two friends per month (59.8% vs. 52.9%). Most of the individuals reported having someone available to listen to (90.1%), provide advice (90.8%), show love (92.9%), and offer emotional support (93.6%), with slightly higher proportions observed among cognitively resilient individuals (Table 2).
Demographic characteristics and social network conditions of the overall study sample and stratified by cognitive resilience status.
| Characteristics | Cognitively resilient | Total(N = 141) | p-value | |
|---|---|---|---|---|
| No(N = 34) | Yes(N = 107) | |||
| Sex, n (%) | 0.0613 | |||
| Male | 10 (29.4%) | 51 (47.7%) | 61 (43.3%) | |
| Female | 24 (70.6%) | 56 (52.3%) | 80 (56.7%) | |
| APOE ε4 allele, n (%) | 0.0730 | |||
| Non-carrier | 26 (76.5%) | 95 (88.8%) | 121 (85.8%) | |
| Carrier | 8 (23.5%) | 12 (11.2%) | 20 (14.2%) | |
| Education, n (%) | 0.1752 | |||
| High school graduate or lower | 17 (50.0%) | 35 (32.7%) | 52 (36.9%) | |
| Some college | 10 (29.4%) | 38 (35.5%) | 48 (34.0%) | |
| College graduate | 7 (20.6%) | 34 (31.8%) | 41 (29.1%) | |
| Marital status, n (%) | 0.2264 | |||
| Married/Living with partner | 16 (47.1%) | 63 (58.9%) | 79 (56.0%) | |
| Single, separated, divorced, widowed | 18 (52.9%) | 44 (41.1%) | 62 (44.0%) | |
| Age (years), Exam 8, Median (25th–75th) | 83 (81, 84) | 82 (81, 84) | 82 (81, 84) | |
| CVD risk score, mean (SD) | 18.0 (4.3) | 17.4 (3.6) | 17.6 (3.8) | |
| How many friends? n (%) | 0.8684 | |||
| ≤ 2 | 11 (32.4%) | 33 (30.8%) | 44 (31.2%) | |
| > 2 | 23 (67.6%) | 74 (69.2%) | 97 (68.8%) | |
| How many friends see a month? n (%) | 0.4792 | |||
| ≤ 2 | 16 (47.1%) | 43 (40.2%) | 59 (41.8%) | |
| > 2 | 18 (52.9%) | 64 (59.8%) | 82 (58.2%) | |
| How many relatives? n (%) | 0.4151 | |||
| ≤ 2 | 11 (32.4%) | 27 (25.2%) | 38 (27.0%) | |
| > 2 | 23 (67.6%) | 80 (74.8%) | 103 (73.0%) | |
| How many relatives see a month? n (%) | 0.5820 | |||
| ≤ 2 | 19 (55.9%) | 54 (50.5%) | 73 (51.8%) | |
| > 2 | 15 (44.1%) | 53 (49.5%) | 68 (48.2%) | |
| Participate in any groups? n (%) | 0.4231 | |||
| No | 13 (38.2%) | 33 (30.8%) | 46 (32.6%) | |
| Yes | 21 (61.8%) | 74 (69.2%) | 95 (67.4%) | |
| How often do you go to religious meetings? n (%) | 0.8588 | |||
| Never or almost never/Once or twice a year | 9 (26.5%) | 30 (28.0%) | 39 (27.7%) | |
| Every few months or more frequently | 25 (73.5%) | 77 (72.0%) | 102 (72.3%) | |
| Someone to listen to you? n (%) | 0.6812 | |||
| None/a little of the time | 4 (11.8%) | 10 (9.3%) | 14 (9.9%) | |
| Some/most/all of the time | 30 (88.2%) | 97 (90.7%) | 127 (90.1%) | |
| Someone to give you advice? n (%) | 0.5560 | |||
| None/a little of the time | 4 (11.8%) | 9 (8.4%) | 13 (9.2%) | |
| Some/most/all of the time | 30 (88.2%) | 98 (91.6%) | 128 (90.8%) | |
| Someone shows love? n (%) | 0.2791 | |||
| None/a little of the time | 1 (2.9%) | 9 (8.4%) | 10 (7.1%) | |
| Some/most/all of the time | 33 (97.1%) | 98 (91.6%) | 131 (92.9%) | |
| Someone gives emotional support? n (%) | 0.5040 | |||
| None/a little of the time | 3 (8.8%) | 6 (5.6%) | 9 (6.4%) | |
| Some/most/all of the time | 31 (91.2%) | 101 (94.4%) | 132 (93.6%) | |
| As much contact as you like? n (%) | 0.4350 | |||
| None/a little of the time | 4 (11.8%) | 8 (7.5%) | 12 (8.5%) | |
| Some/most/all of the time | 30 (88.2%) | 99 (92.5%) | 129 (91.5%) | |
CVD: cardiovascular disease.
In general, the excluded participants, missing data on covariate variables (N = 14), were similar to the study sample with respect to the basic characteristics and the majority of the social network features (median age: 81 years vs. 82 years; cognitive resilience: 78.6% vs. 75.9%) (Supplementary Table S1).
Spearman rank correlations among the social network features ranged from –0.192 to 0.632. Several moderate positive correlations were observed, with the strongest correlations between “Someone to listen to you” and “Someone to give you advice” (ρ = 0.632), “Someone to listen to you” and “As much contact as you like?” (ρ = 0.579), “Someone to give you advice” and “Someone gives emotional support” (ρ = 0.518), and “How many friends” and “How many friends see a month” (ρ = 0.515; all p < 0.001) (Supplementary Table S2). Overall, the correlation pattern indicated shared variation among several social network features while showing no evidence of extremely high pairwise correlations.
Supplementary Table S3 shows the selection counts of social network features through the mRMR approach across 100 repetitions. With a maximum of 500 counts, the three top-ranked features with the highest selection frequency were “Feeling someone shows you love and affection”, “How many relatives”, and “Counting on anyone to provide you with emotional support”, with their selection counts being 407 (81.4%), 364 (72.8%), and 342 (68.4%), respectively. The least selected social network feature was “Someone listens to you when you need to talk” with a selection count of 44 (8.8%).
Standardized Cronbach’s α was 0.706, indicating acceptable internal consistency of the social network features. The KMO measure of sampling adequacy was 0.68, indicating moderate sampling adequacy, and Bartlett’s test of sphericity was statistically significant (p < 0.001), supporting the appropriateness of PCA. The first two PCs accounted for the largest proportions of variance among the components (Supplementary Figure S1). PC1 showed negative loadings across all social network features, with the largest absolute loadings observed for both quantitative (“How many relatives”: −0.538, “Participate in any groups”: −0.491) and qualitative domains (“Someone shows love”: −0.454, “Someone gives emotional support”: −0.344). PC2 was primarily characterized by “How many friends see a month” (−0.741) and “How often do you go to religious meetings” (−0.602), representing social interaction and participation (Table 3). As all social network features loaded negatively on PC1 and PC2, higher PC1 and PC2 scores represented lower levels of social networking.
Principal component loadings of the eleven social network features.
| Social network features | PC1 | PC2 |
|---|---|---|
| Someone shows love | –0.454 | 0.093 |
| How many relatives | –0.538 | 0.005 |
| Someone gives emotional support | –0.344 | 0.14 |
| Participate in any groups | –0.491 | 0.177 |
| How many friends see a month | –0.15 | –0.741 |
| How often do you go to religious meetings | –0.17 | –0.602 |
| As much contact as you like | –0.175 | 0.055 |
| How many friends | –0.174 | 0.009 |
| How many relatives see a month | –0.077 | 0.143 |
| Someone to give you advice | –0.095 | 0.064 |
| Someone to listen to you | –0.134 | 0.033 |
In the fully adjusted logistic regression model, each one SD increment in PC1 and PC2 was associated with 22% and 9% lower odds of cognitive resilience, respectively (PC1: OR = 0.78; 95% CI: 0.52–1.17; p = 0.235; PC2: OR = 0.91; 95% CI: 0.59–1.41; p = 0.677). As higher PC scores indicated less active social engagement, the results suggested a positive, but non-significant association between active social network and cognitive resilience.
For the four Step models using five candidate algorithms, predictive discrimination was generally modest, with AUCs ranging from 0.473 to 0.694. The highest AUC was observed for LightGBM including both PC1 and PC2 (Model 3b) (AUC = 0.694; 95% CI: 0.456–0.897), with specificity of 0.700, F1 score of 0.654, and balanced accuracy of 0.616. The LightGBM AUC increased from 0.613 (95% CI: 0.378–0.828) for Model 2 to 0.641 (95% CI: 0.416–0.844) after adding PC1 and to 0.694 (95% CI: 0.456–0.897) after adding both PC1 and PC2, suggesting potential predictive value of adding social network components. Similarly, PPV was 0.810 (95% CI: 0.682–0.941) for Model 2, 0.882 (95% CI: 0.733–1.000) for Model 3a, and 0.850 (95% CI: 0.722–0.961) for Model 3b, respectively. Sensitivity did not show improvement after including the social network components, with 0.531 (95% CI: 0.345–0.688) for Model 2, 0.469 (95% CI: 0.281–0.656) for Model 3a, and 0.531 (95% CI: 0.375–0.688) for Model 3b. However, the 95% CIs were wide and overlapping due to the limited test data. Random forest models showed relatively high F1 scores and sensitivity but poor specificity (Table 4).
Predictive performance with 95% CI of candidate models for cognitive resilience.
| Predictor_Seta | Model | AUC | F1 | Sensitivity | Specificity | PPV | NPV | Balanced accuracy |
|---|---|---|---|---|---|---|---|---|
| Model 1 | Logistic | 0.561 (0.330, 0.781) | 0.444 (0.256, 0.612) | 0.312 (0.156, 0.469) | 0.700 (0.400, 1.000) | 0.769 (0.562, 1.000) | 0.241 (0.148, 0.333) | 0.506 (0.328, 0.666) |
| CART | 0.553 (0.344, 0.736) | 0.702 (0.561, 0.820) | 0.625 (0.469, 0.781) | 0.500 (0.200, 0.800) | 0.800 (0.690, 0.913) | 0.294 (0.125, 0.467) | 0.562 (0.381, 0.737) | |
| Random_Forest | 0.567 (0.358, 0.750) | 0.841 (0.769, 0.899) | 0.906 (0.781, 1.000) | 0.200 (0.000, 0.500) | 0.784 (0.737, 0.844) | 0.400 (0.000, 1.000) | 0.553 (0.438, 0.688) | |
| XGBoost | 0.669 (0.442, 0.869) | 0.627 (0.455, 0.764) | 0.500 (0.313, 0.656) | 0.700 (0.400, 1.000) | 0.842 (0.706, 1.000) | 0.304 (0.190, 0.421) | 0.600 (0.434, 0.750) | |
| LightGBM | 0.650 (0.441, 0.845) | 0.679 (0.531, 0.813) | 0.562 (0.406, 0.719) | 0.700 (0.400, 1.000) | 0.857 (0.737, 1.000) | 0.333 (0.211, 0.474) | 0.631 (0.466, 0.781) | |
| Model 2 | Logistic | 0.575 (0.347, 0.794) | 0.615 (0.449, 0.754) | 0.500 (0.344, 0.656) | 0.600 (0.300, 0.900) | 0.800 (0.667, 0.941) | 0.273 (0.150, 0.400) | 0.550 (0.372, 0.719) |
| CART | 0.473 (0.291, 0.669) | 0.630 (0.468, 0.767) | 0.531 (0.344, 0.719) | 0.500 (0.200, 0.800) | 0.773 (0.650, 0.909) | 0.250 (0.111, 0.400) | 0.516 (0.347, 0.697) | |
| Random_Forest | 0.588 (0.384, 0.778) | 0.865 (0.865, 0.865) | 1.000 (1.000, 1.000) | 0.000 (0.000, 0.000) | 0.762 (0.762, 0.762) | NAb | 0.500 (0.500, 0.500) | |
| XGBoost | 0.617 (0.375, 0.839) | 0.679 (0.520, 0.807) | 0.562 (0.406, 0.719) | 0.700 (0.400, 1.000) | 0.857 (0.722, 1.000) | 0.333 (0.200, 0.474) | 0.631 (0.450, 0.794) | |
| LightGBM | 0.613 (0.378, 0.828) | 0.642 (0.478, 0.772) | 0.531 (0.345, 0.688) | 0.600 (0.300, 0.900) | 0.810 (0.682, 0.941) | 0.286 (0.150, 0.421) | 0.566 (0.384, 0.731) | |
| Model 3a | Logistic | 0.553 (0.344, 0.769) | 0.654 (0.489, 0.786) | 0.531 (0.344, 0.688) | 0.700 (0.400, 1.000) | 0.850 (0.722, 1.000) | 0.318 (0.200, 0.450) | 0.616 (0.450, 0.778) |
| CART | 0.483 (0.294, 0.678) | 0.500 (0.318, 0.655) | 0.375 (0.219, 0.531) | 0.600 (0.300, 0.900) | 0.750 (0.571, 0.929) | 0.231 (0.125, 0.333) | 0.487 (0.319, 0.653) | |
| Random_Forest | 0.647 (0.434, 0.844) | 0.849 (0.817, 0.865) | 0.969 (0.906, 1.000) | 0.000 (0.000, 0.000) | 0.756 (0.744, 0.762) | 0.000 (0.000, 0.000) | 0.484 (0.453, 0.500) | |
| XGBoost | 0.625 (0.412, 0.834) | 0.627 (0.459, 0.772) | 0.500 (0.344, 0.688) | 0.700 (0.400, 1.000) | 0.842 (0.706, 1.000) | 0.304 (0.190, 0.429) | 0.600 (0.431, 0.762) | |
| LightGBM | 0.641 (0.416, 0.844) | 0.612 (0.429, 0.764) | 0.469 (0.281, 0.656) | 0.800 (0.500, 1.000) | 0.882 (0.733, 1.000) | 0.320 (0.217, 0.429) | 0.634 (0.469, 0.766) | |
| Model 3b | Logistic | 0.547 (0.338, 0.762) | 0.642 (0.478, 0.774) | 0.531 (0.344, 0.719) | 0.600 (0.300, 0.900) | 0.810 (0.682, 0.947) | 0.286 (0.158, 0.421) | 0.566 (0.388, 0.744) |
| CART | 0.548 (0.373, 0.703) | 0.419 (0.211, 0.596) | 0.281 (0.125, 0.438) | 0.800 (0.500, 1.000) | 0.818 (0.583, 1.000) | 0.258 (0.177, 0.333) | 0.541 (0.378, 0.684) | |
| Random_Forest | 0.572 (0.369, 0.772) | 0.849 (0.817, 0.865) | 0.969 (0.906, 1.000) | 0.000 (0.000, 0.000) | 0.756 (0.744, 0.762) | 0.000 (0.000, 0.000) | 0.484 (0.453, 0.500) | |
| XGBoost | 0.625 (0.400, 0.831) | 0.691 (0.542, 0.814) | 0.594 (0.406, 0.750) | 0.600 (0.300, 0.900) | 0.826 (0.714, 0.952) | 0.316 (0.176, 0.471) | 0.597 (0.431, 0.766) | |
| LightGBM | 0.694 (0.456, 0.897) | 0.654 (0.490, 0.786) | 0.531 (0.375, 0.688) | 0.700 (0.400, 0.900) | 0.850 (0.722, 0.961) | 0.318 (0.200, 0.450) | 0.616 (0.450, 0.778) |
a Model 1 adjusted for age, sex, education, and marital status. Model 2 additionally adjusted for APOE genotype and the Framingham cardiovascular disease (CVD) risk score. Model 3a further adjusted for PC1, whereas Model 3b further adjusted for PC1 and PC2. b NPV was not estimable when no participants were classified as negative by the model. PPV: positive predictive value; NPV: negative predictive value; CART: classification and regression trees.
The ROC curves showed a limited discriminatory power of all models (Figure 1). The calibration plots indicated that there was a discrepancy between the predicted probabilities and the observed probabilities across the models studied, suggesting poor calibration. However, given the limited size of the test set, these results should be interpreted with caution (Supplementary Figure S2).
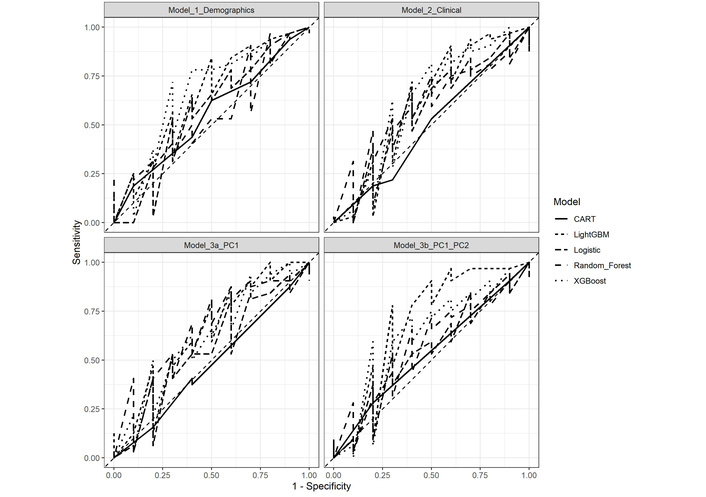
Receiver operating characteristic curves for candidate models across predictor sets. Model 1 adjusted for age, sex, education, and marital status. Model 2 additionally adjusted for APOE genotype and the Framingham cardiovascular disease (CVD) risk score. Model 3a further adjusted for PC1, whereas Model 3b further adjusted for PC1 and PC2. CART: classification and regression trees.
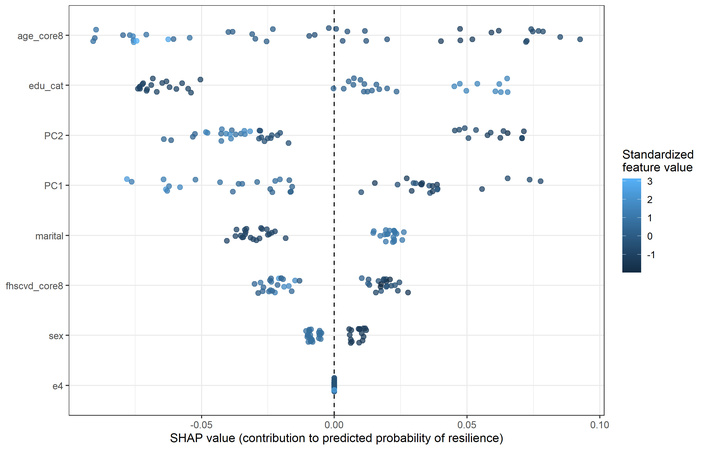
SHAP analyses were conducted for the best-performing LightGBM Model 3b to evaluate feature contributions to the prediction of cognitive resilience. The top four influential predictors were age, education level, PC2, and PC1, with their mean absolute SHAP values being 0.052, 0.046, 0.043, and 0.039. The following predictors were marital status, Framingham CVD risk score, sex, and APOE ε4 genotype (Supplementary Figure S3). Higher age and Framingham CVD risk scores generally contributed to lower predicted probabilities of cognitive resilience. In contrast, higher educational level contributed to higher cognitive resilience probabilities. Lower PC1 and PC2 scores contributed to higher predicted probabilities of resilience, whereas higher component scores tended to contribute to lower predicted probabilities (Figure 2). Because PC1 had negative loadings across all eleven social network features, with the largest absolute loadings for number of relatives, group participation, having someone who shows love, and emotional support, more negative PC1 scores corresponded to higher levels of these social network characteristics.
Similarly, PC2 was primarily defined by negative loadings for number of friends seen per month and frequency of attending religious meetings, such that more negative PC2 scores corresponded to higher levels of these social interaction measures. Therefore, the SHAP patterns suggest that higher levels of social interaction and participation, perceived love, family size, and emotional support contributed to higher predicted probabilities of cognitive resilience. The two social network principal components ranked among the four most influential predictors in the final LightGBM Model, whereas APOE ε4 genotype had a mean absolute SHAP value of zero, indicating that it did not contribute to predictions in the fitted model.
The present study evaluated the predictive ability of social network characteristics on cognitive resilience among a sample of adults aged 80 years and older in the FHS Offspring cohort. Cognitive resilience was highly prevalent in this cohort, alongside generally strong social resources, including frequent social participation and widespread access to emotional and instrumental support. The mRMR results identified perceived love and affection, number of relatives, and emotional support as the most likely to be selected. Overall predictive performance across the five candidate algorithms was modest, with the fully adjusted LightGBM Model having the highest discrimination. Including PC1 and PC2 in the LightGBM improved the model performance, and both components ranked among the top four influential predictors based on SHAP analysis.
Our feature selection process and SHAP values highlighted social interaction and participation, perceived love, family size, and emotional support as predominant predictors of cognitive resilience, which underscores the importance of both qualitative and quantitative aspects of the social network. This aligns with existing evidence highlighting the role of an active social network in lowering the risk of cognitive decline through enhancing cognitive resilience. A series of studies based on the Social Networks in Alzheimer’s Disease (SNAD) project found that large, diverse, and loose social networks were associated with promoting cognitive reserve among the elderly [19, 39, 40]. A study of the elderly population in Milan, Italy, indicated that positive social engagement with family, neighborhood, and friends had a strong predictive value for cognitive reserve in aging [41]. Another aging study on the Swedish National Study on Aging and Care–Kungsholmen (SNAC-K) cohort suggested that social health, which involved aspects of social network, engagement, and support, was associated with slower cognitive decline and interacted with total brain tissue volume to improve cognitive performance [42]. Similarly, two studies using Chinese older adult cohorts found that cognitive resilience mediated the positive association between social support and cognitive performance [25, 26]. Additionally, social engagement and connections were considered proxies to quantify cognitive reserve in some studies exploring the association between cognitive reserve and dementia [15, 43].
Several biologic and behavioral mechanisms may explain the predictive value of social network features. Older adults could get sustained cognitive stimulation through actively participating in social activities and enhancing social interaction through communication and interpersonal experiences, which may contribute to cognitive reserve and support the maintenance of cognitive function [19, 44]. Social interaction also promotes healthier lifestyles, including greater physical activity, better adherence to medical care, and increased participation in cognitively stimulating activities [45]. Moreover, the qualitative aspects of social networks, such as perceived care, feeling loved, and emotional support, may influence cognitive health by alleviating stress, reducing psychological distress and loneliness, and mitigating long-term activation of the hypothalamic-pituitary-adrenal axis [45]. In this way, the adverse neuroendocrine and inflammatory processes associated with cognitive aging and neurodegenerative diseases could be suppressed [46].
Machine learning algorithms have been widely applied in predictive modeling across multiple research fields and have demonstrated encouraging predictive performance [47–49]. Within cognitive aging and dementia research, machine learning approaches have also been used to integrate demographic, lifestyle, and clinical health factors for risk prediction [38, 50–52]. In our study, overall predictive performance remained modest, and we observed an improvement in predictive performance only for LightGBM Models after adding social network features. The contribution patterns of social network features varied across five algorithms. Logistic regression and CART exhibited comparatively modest discriminatory power and only minimal improvements in predictive performance when including the social network components, whereas XGBoost did not demonstrate a consistent increase in predictive performance with the addition of PC1 and PC2. The random forest models exhibited varying performance patterns: high sensitivity and F1 scores, but extremely low specificity. Random forest models tending to classify participants as cognitively resilient may result from the imbalanced distribution of the target outcome in the study sample. Therefore, we should be cautious when interpreting high sensitivity or F1 scores. Thus, the variance across algorithms suggests that social network features may provide incremental predictive information for cognitive resilience through nonlinearities or interactions with other demographic and health-related factors, as this can be better captured by boosting algorithms such as LightGBM. However, their contribution alone is insufficient to achieve strong discrimination. Although evidence using social network features in machine learning-based models of cognitive resilience remains limited, previous machine learning studies have identified social isolation and marital status as important predictors of cognitive decline and have highlighted social engagement and broader social network characteristics as relevant predictors of dementia [30, 31, 53, 54]. Our findings extend this literature by suggesting that both structural and qualitative dimensions of social relationships may contribute predictive information for cognitive resilience, while also demonstrating that their predictive value is likely complementary to established biological, behavioral, and clinical factors.
Several factors may explain the limited improvement in overall predictive performance observed in the present study. First, although the Berkman-Syme SNI captures multiple dimensions of social relationships [32], its categorical structure may not fully reflect the complexity, intensity, and dynamic nature of social interactions that are relevant to cognitive resilience. Other questionnaires, such as the Arizona Social Support Interview Survey, include more aspects of the social network, such as network density and negative interaction [24]. Second, individual social network components may interact with one another, and their influence on cognitive resilience may not be independent [55]. Moreover, not all social relationships are uniformly beneficial. Certain relationships characterized by conflict, stress, or poor quality, such as strained marital relationships or negative peer influences, may adversely affect cognitive outcomes, with potentially stronger associations observed in closer or more intimate social ties [56]. A study based on the Health and Retirement Study indicated that larger size and contact frequency with friend networks were associated with better cognitive performance, while larger family networks were associated with worse executive function [57]. In addition, social engagement often co-occurs with other health-related behaviors, such as physical and cognitively stimulating activities, making it difficult to isolate its independent contribution [58]. Furthermore, the use of a single baseline assessment may fail to capture longitudinal changes in social engagement, which could be more informative for predicting long-term cognitive outcomes. The relative importance of different social ties may also vary across the life course, shifting from family relationships to peer networks and later to partners and offspring, further complicating their role in late-life cognitive resilience [56]. Lastly, other important determinants beyond social network characteristics, such as diet and physical activity, should also be incorporated into predictive models of cognitive resilience to improve overall performance [59].
This study has several strengths. First, to the best of our knowledge, this is the first study to apply machine learning approaches to systematically evaluate the contribution of social network components in predicting cognitive resilience among the oldest population. The application of machine learning techniques, including mRMR feature selection and five candidate predictive models, enhanced the robustness of feature ranking and reduced the risk of overfitting. Second, the study leveraged data from the well-characterized FHS cohort, with rigorous dementia adjudication, enabling a robust definition of cognitive resilience. The Berkman-Syme SNI allows for a comprehensive assessment of both structural and functional aspects of the social network.
However, several limitations should be considered. First, regarding the study sample and modeling, the study included only 141 participants with imbalanced cognitive resilience, which may have limited statistical power and reduced the discrimination of the machine learning models. Additionally, the risk of model instability and overfitting existed even though we applied 5-fold cross-validation and inverse-frequency class weights to mitigate the impact of the sample size and imbalanced outcome distribution. Furthermore, we used the Framingham CVD risk score to capture health-related factors associated with cognitive resilience as much as possible. However, this score may not fully account for the predictive contributions of other relevant lifestyle factors, such as physical activity and other chronic health conditions. Second, regarding the measurement, cognitive resilience was operationalized based on the absence of dementia among adults aged ≥ 80 years, representing only one approach to measuring cognitive resilience. The study did not incorporate biological markers related to neurodegeneration or ADRD pathology, which may provide a more comprehensive characterization of resilience mechanisms. Furthermore, social network measures were assessed at a single time point, which may not capture dynamic changes in social engagement over time. Finally, regarding generalizability, most participants in the FHS cohort reported high levels of education, social support, and engagement. This, along with the limited sample size, may restrict generalizability to more socially diverse populations. External validation is needed to assess the generalizability of the findings.
Our findings suggest that social network characteristics, particularly social interaction, perceived love, and emotional support, may contribute to cognitive resilience among adults aged 80 years and older. However, the overall predictive performance of the machine learning models was modest, indicating that current social network structures are insufficient for accurately predicting cognitive resilience, and the prediction models should consider including more behavioral and clinical factors. Future studies should incorporate more comprehensive, dynamic, and context-sensitive measures of social networks and validate these findings in larger and more diverse populations. Despite this, the study explored different machine learning tools as a novel method to uncover subtle patterns in psychosocial data in predicting cognitive resilience. Additionally, within a broader dementia prevention and cognitive aging framework, the findings highlight the potential clinical relevance of both quantitative and qualitative social network features. From a clinical perspective, social participation and emotional support may act as relevant components of geriatric assessment and care, and may inform the development of interventions designed to strengthen supportive social relationships among older adults.
ADRD: Alzheimer’s disease and related dementias
CART: classification and regression trees
CVD: cardiovascular disease
FHS: Framingham Heart Study
KMO: Kaiser–Meyer–Olkin
mRMR: Minimum Redundancy Maximum Relevance
NPV: negative predictive value
PCA: principal component analysis
PPV: positive predictive value
ROC: receiver operating characteristic
SHAP: SHapley Additive exPlanations
SNI: Social Network Index
The supplementary materials for this article are available at: https://www.explorationpub.com/uploads/Article/file/1001436_sup_1.pdf.
During the preparation of this work, the authors used ChatGPT-5.6 to improve language and grammar. After using the tool/service, the authors reviewed and edited the content as needed and take full responsibility for the content of the publication.
TL: Data curation, Formal analysis, Methodology, Visualization, Writing—original draft, Writing—review & editing. HD: Conceptualization, Methodology, Writing—review & editing. PHH: Conceptualization, Methodology, Writing—review & editing, Supervision, Investigation. All authors read and approved the submitted version.
The authors declare that they have no conflicts of interest.
The study protocol was approved by the Boston University Medical Campus Institutional Review Board (IRB; approval number H-43332). The study was conducted in accordance with the Declaration of Helsinki.
Written informed consent was obtained from all participants prior to enrollment in FHS.
Informed consent to publication was obtained from relevant participants.
The datasets analyzed in this study were obtained from the Framingham Heart Study and are not publicly available due to data use agreements and participant privacy protections. Requests for access to these datasets should be directed to the Framingham Heart Study through https://www.framinghamheartstudy.org/fhs-for-researchers/.
Support for this work came from the Alzheimer’s Association (grant number [23AARF-1019048]) and from the National Institute on Aging (grant number [U19AG068753]), as well as the Framingham Heart Study of the National Heart Lung and Blood Institute of the National Institutes of Health and Boston University School of Medicine. This project has been funded in whole or in part with Federal funds from the National Heart Lung and Blood Institute, Department of Health and Human Services, under Contract No. [75N92019D00031]. The funders had no role in study design, data collection and analysis, decision to publish, or preparation of the manuscript.
© The Author(s) 2026.
Open Exploration maintains a neutral stance on jurisdictional claims in published institutional affiliations and maps. All opinions expressed in this article are the personal views of the author(s) and do not represent the stance of the editorial team or the publisher.
Copyright: © The Author(s) 2026. This is an Open Access article licensed under a Creative Commons Attribution 4.0 International License (https://creativecommons.org/licenses/by/4.0/), which permits unrestricted use, sharing, adaptation, distribution and reproduction in any medium or format, for any purpose, even commercially, as long as you give appropriate credit to the original author(s) and the source, provide a link to the Creative Commons license, and indicate if changes were made.



View: 84
Download: 9
Times Cited: 0