 Original Article


Affiliation:
1School of Public Health, College of Medicine and Health Sciences, Hawassa University, Hawassa, Sidama Region 1560, Ethiopia
Email: kebedetefera@hu.edu.et
ORCID: https://orcid.org/0000-0003-3049-7073


 ,
,
Affiliation:
2National Data Management and Analytics Center, Ethiopian Public Health Institute, Addis Ababa 1242, Ethiopia
Affiliation:
2National Data Management and Analytics Center, Ethiopian Public Health Institute, Addis Ababa 1242, Ethiopia
Affiliation:
2National Data Management and Analytics Center, Ethiopian Public Health Institute, Addis Ababa 1242, Ethiopia
ORCID: https://orcid.org/0000-0002-9560-4004
,
Affiliation:
2National Data Management and Analytics Center, Ethiopian Public Health Institute, Addis Ababa 1242, Ethiopia
Affiliation:
2National Data Management and Analytics Center, Ethiopian Public Health Institute, Addis Ababa 1242, Ethiopia
Affiliation:
2National Data Management and Analytics Center, Ethiopian Public Health Institute, Addis Ababa 1242, Ethiopia
Affiliation:
2National Data Management and Analytics Center, Ethiopian Public Health Institute, Addis Ababa 1242, Ethiopia
ORCID: https://orcid.org/0000-0002-6209-1513
,
Affiliation:
2National Data Management and Analytics Center, Ethiopian Public Health Institute, Addis Ababa 1242, Ethiopia
Affiliation:
2National Data Management and Analytics Center, Ethiopian Public Health Institute, Addis Ababa 1242, Ethiopia
Affiliation:
2National Data Management and Analytics Center, Ethiopian Public Health Institute, Addis Ababa 1242, Ethiopia
ORCID: https://orcid.org/0000-0002-7905-4954
,
Affiliation:
2National Data Management and Analytics Center, Ethiopian Public Health Institute, Addis Ababa 1242, Ethiopia
Affiliation:
2National Data Management and Analytics Center, Ethiopian Public Health Institute, Addis Ababa 1242, Ethiopia
Affiliation:
2National Data Management and Analytics Center, Ethiopian Public Health Institute, Addis Ababa 1242, Ethiopia
3Department of Health Metrics Sciences, Institute for Health Metrics and Evaluation, University of Washington, Seattle, WA 98101, USA
ORCID: https://orcid.org/0000-0002-3949-9457
Explor Med. 2026;7:1001416 DOI: https://doi.org/10.37349/emed.2026.1001416
Received: January 25, 2026 Accepted: May 19, 2026 Published: July 15, 2026
Academic Editor: Undurti Narasimha Das, UND Life Sciences, USA
Aim: Diabetes mellitus is a growing non-communicable disease (NCD) imposing major health and economic burdens in Ethiopia. While prior national and subnational estimates have been published using Global Burden of Disease (GBD) 2019 data, this study provides novel, updated estimates reflecting newly delineated regional boundaries and recent socio-demographic shifts using GBD 2023 data. We aimed to estimate the national and subnational burden and trends of diabetes mellitus in Ethiopia from 1990 to 2023.
Methods: This analysis is part of the GBD 2023 study, a collaborative effort between the Ethiopian Public Health Institute and the Institute for Health Metrics and Evaluation. Estimates were generated using standard GBD modeling tools [DisMod-MR 2.1 and Cause of Death Ensemble modeling (CODEm)] for incidence, prevalence, mortality, years of life lost (YLLs), years lived with disability (YLDs), and DALYs [with 95% uncertainty intervals (UI)] across Ethiopia’s regions and city administrations.
Results: In 2023, Ethiopia’s age-standardized prevalence of all forms of diabetes mellitus (type 1 and type 2 combined) was 2,996.4 (95% UI: 2,704.8–3,269.5) cases per 100,000 population. Type 2 diabetes accounted for nearly 99% of cases. The Somali region had the lowest prevalence (2,243.1 per 100,000), about 45% lower than in Sidama (4,066.4 per 100,000), highlighting marked regional disparities. The age-standardized DALY rate was 1,124.2 per 100,000. While high fasting plasma glucose was the leading proximal risk factor, high body mass index ranked as the top upstream modifiable risk factor (264.1 DALYs per 100,000).
Conclusions: This study highlights the substantial and unevenly distributed burden of diabetes mellitus in Ethiopia, driven predominantly by type 2 diabetes and modifiable metabolic risk factors. These findings call for tailored, region-specific strategies, such as targeted obesity prevention in high-prevalence urban centers and strengthened health system capacity in high-mortality pastoral regions to curb the future burden and align with global NCD targets.
Diabetes mellitus is a serious chronic metabolic disorder characterized by persistently elevated blood glucose levels resulting from impaired insulin secretion, insulin action, or both [1]. Globally, more than one in ten adults lives with diabetes, a condition responsible for 6.7 million deaths worldwide in 2021. Approximately 80.6% of people with diabetes reside in low- and middle-income countries (LMICs), where 44.7% of cases remain undiagnosed, placing immense strain on overburdened health systems [1].
Against this global backdrop, Ethiopia is undergoing a rapid epidemiological transition, with non-communicable diseases (NCDs) accounting for a growing share of morbidity and mortality. According to 2021 International Diabetes Federation (IDF) estimates, the prevalence of diabetes among Ethiopian adults was 3.3%, with 57.6% of cases undiagnosed [1]. Data from the 2015 National STEPS Survey indicated a prevalence of raised blood glucose of 3.2%, with a higher prevalence among males (3.5%) than females (3.0%) [2]. Despite this, comprehensive and comparable national and subnational trend estimates over time remain limited. Previous subnational Global Burden of Disease (GBD) analyses for Ethiopia (based on GBD 2019) provided baseline estimates; however, the GBD 2023 iteration incorporates updated data sources, refined modeling frameworks, and newly delineated regional boundaries (the creation of the Sidama and South West regions) [3].
This study aims to provide the most up-to-date, granular assessment of the diabetes burden in Ethiopia from 1990 to 2023 using GBD 2023 data. By analyzing subnational heterogeneity and temporal trends, this study provides novel insights into the specific impact of regional disparities and upstream risk factors, offering a critical evidence base to inform localized NCD policy, planning, and monitoring.
This study was conducted by the Ethiopian Public Health Institute (EPHI) and the Institute for Health Metrics and Evaluation (IHME) collaborative initiative. We used the GBD 2023 database for Ethiopia, which includes thirteen regional states and two chartered cities. The process of GBD estimation for Ethiopia was based on multiple relevant data sources, including censuses, demographic surveillance, disease registries, household surveys (Demographic and Health Surveys), and verbal autopsies. EPHI and IHME collaboratively extracted, standardized, and mapped these data according to GBD guidelines [4]. This analysis complies with the Guidelines for Accurate and Transparent Health Estimates Reporting (GATHER) [4].
In the GBD framework, “all forms of diabetes” refers specifically to the combined burden of type 1 diabetes mellitus (T1DM) and type 2 diabetes mellitus (T2DM), as gestational diabetes is modeled separately within maternal conditions.
Burden metrics, incidence, prevalence, mortality, years of life lost (YLLs), years lived with disability (YLDs), and disability-adjusted life years (DALYs) were estimated using standard GBD modeling tools. Non-fatal outcomes (prevalence, incidence, YLDs) were estimated using DisMod-MR 2.1, a Bayesian meta-regression tool that ensures internally consistent estimates. Mortality (YLLs) was estimated using the Cause of Death Ensemble modeling (CODEm) framework [5]. Total DALYs were calculated as the sum of YLLs and YLDs [6]. Subnational estimates for Ethiopia’s 13 regions and 2 chartered cities were generated using spatio-temporal regression and Gaussian process regression (GPR) to borrow strength across locations and time. Age-standardized rates were calculated using the GBD standard population to facilitate comparisons over time and across regions by removing the effects of population aging [7].
Temporal trends from 1990 to 2023 were analyzed by calculating the estimated annual percentage change (EAPC) using a join point regression model, with statistical significance determined at a p-value of < 0.05. All statistical analyses and data visualizations were performed using R (version 4.2.0) and the Join point Regression Program (version 4.9.0.1, National Cancer Institute). Geospatial mapping and visualization were conducted using QGIS software (version 3.28). All estimates are presented with 95% uncertainty intervals (UI) to account for data limitations and modeling assumptions.
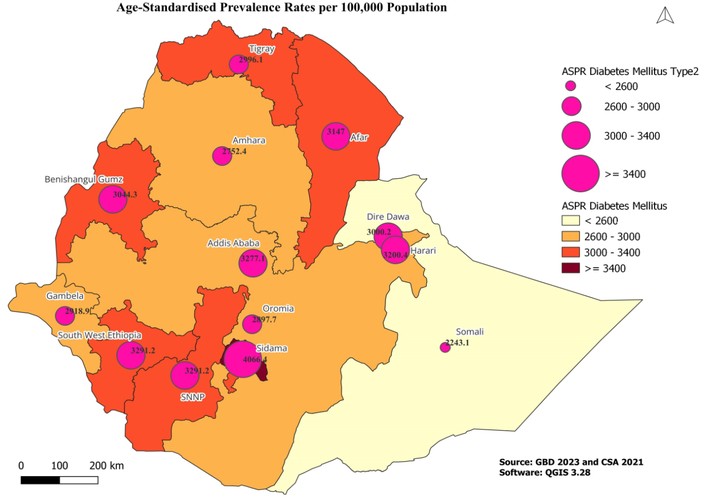
In 2023, Ethiopia’s age-standardized prevalence of all forms of diabetes mellitus was 2,996.4 cases per 100,000 population (95% UI: 2,704.8–3,269.5). T2DM made up nearly all cases (2,967.3 per 100,000; ~99% of total), whereas T1DM had a uniformly low prevalence (~29.0 per 100,000). There was substantial regional variation: Sidama had the highest prevalence (4,066.4 per 100,000), while the Somali region had the lowest (2,243.1 per 100,000) about 45% lower than Sidama (Figure 1). The age-standardized incidence rate increased modestly between 1990 and 2023 in both sexes. Among males, the incidence rose from 163.5 (95% UI: 147.4–179.4) to 171.4 (95% UI: 153.9–187.7) per 100,000 population, while among females it increased from 145.1 (95% UI: 130.0–160.6) to 151.8 (95% UI: 138.2–165.2) per 100,000 population (Table 1).
Prevalence and incidence of type 2 diabetes mellitus by sex in 1990 and 2023, with absolute change (per 100,000 population).
| Indicator | Sex | 1990 | 2023 | Absolute change (1990–2023) |
|---|---|---|---|---|
| Prevalence | Male | 2,817.8 (2,505.6–3,121.2) | 3,013.7 (2,710.7–3,311.3) | +195.9 |
| Prevalence | Female | 2,709.1 (2,417.2–3,005.6) | 2,912.9 (2,621.0–3,189.6) | +203.8 |
| Incidence | Male | 163.5 (147.4–179.4) | 171.4 (153.9–187.7) | +7.9 |
| Incidence | Female | 145.1 (130.0–160.6) | 151.8 (138.2–165.2) | +6.7 |
Values are age-standardized rates per 100,000 population with 95% uncertainty intervals (UI).
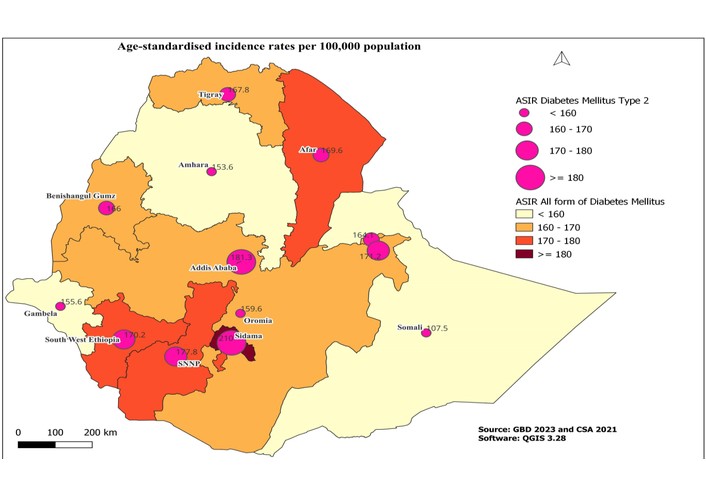
From 1990 to 2023, the age-standardized prevalence of T2DM increased steadily (EAPC: +0.2%, p < 0.05), with this growth driven primarily by accelerations after 2015. In 2023, incidence rates showed a modest but consistent rise (Figure 2). Males had consistently higher prevalence and incidence than females throughout the study period, though the gap narrowed slightly by 2023 (Table 2).
Age-standardized prevalence and incidence of type 2 diabetes mellitus (T2DM) by sex, with annual absolute change, 1990–2023.
| Year | Prev. (M) | Δ Prev (M) | Prev. (F) | Δ Prev (F) | Inc. (M) | Δ Inc. (M) | Inc. (F) | Δ Inc. (F) |
|---|---|---|---|---|---|---|---|---|
| 1990 | 2,817.8 | — | 2,709.1 | — | 163.5 | — | 145.1 | — |
| 1991 | 2,821.1 | 3.3 | 2,713.8 | 4.7 | 163.2 | −0.3 | 145.2 | 0.1 |
| 1992 | 2,824.6 | 3.5 | 2,719.4 | 5.6 | 163 | −0.2 | 145.3 | 0.1 |
| 1993 | 2,828.2 | 3.6 | 2,725.5 | 6.1 | 162.8 | −0.2 | 145.5 | 0.2 |
| 1994 | 2,831.8 | 3.6 | 2,731.9 | 6.4 | 162.6 | −0.2 | 145.6 | 0.1 |
| 1995 | 2,835.3 | 3.5 | 2,738.5 | 6.6 | 162.5 | −0.1 | 145.8 | 0.2 |
| 1996 | 2,840.3 | 5 | 2,746.9 | 8.4 | 162.5 | 0 | 146 | 0.2 |
| 1997 | 2,847.7 | 7.4 | 2,758 | 11.1 | 162.7 | 0.2 | 146.3 | 0.3 |
| 1998 | 2,855.8 | 8.1 | 2,770.1 | 12.1 | 162.9 | 0.2 | 146.6 | 0.3 |
| 1999 | 2,862.9 | 7.1 | 2,781.6 | 11.5 | 163.1 | 0.2 | 146.9 | 0.3 |
| 2000 | 2,867.4 | 4.5 | 2,790.7 | 9.1 | 163.3 | 0.2 | 147.1 | 0.2 |
| 2001 | 2,865.1 | −2.3 | 2,799.3 | 8.6 | 163.2 | −0.1 | 147.2 | 0.1 |
| 2002 | 2,856.5 | −8.6 | 2,809.3 | 10 | 162.7 | −0.5 | 147.2 | 0 |
| 2003 | 2,845.4 | −11.1 | 2,819.3 | 10 | 162.2 | −0.5 | 147.2 | 0 |
| 2004 | 2,835.7 | −9.7 | 2,827.5 | 8.2 | 161.8 | −0.4 | 147.1 | −0.1 |
| 2005 | 2,831.3 | −4.4 | 2,832.2 | 4.7 | 161.9 | 0.1 | 147.1 | 0 |
| 2006 | 2,832.2 | 0.9 | 2,832.8 | 0.6 | 162.3 | 0.4 | 147.1 | 0 |
| 2007 | 2,835.6 | 3.4 | 2,830.3 | −2.5 | 162.7 | 0.4 | 147.2 | 0.1 |
| 2008 | 2,840.7 | 5.1 | 2,826.4 | −3.9 | 163.3 | 0.6 | 147.2 | 0 |
| 2009 | 2,846.9 | 6.2 | 2,822.7 | −3.7 | 163.9 | 0.6 | 147.3 | 0.1 |
| 2010 | 2,853.6 | 6.7 | 2,820.5 | −2.2 | 164.6 | 0.7 | 147.3 | 0 |
| 2011 | 2,861.3 | 7.7 | 2,818.5 | −2.0 | 165.3 | 0.7 | 147.4 | 0.1 |
| 2012 | 2,870.8 | 9.5 | 2,815.6 | −2.9 | 166.3 | 1 | 147.5 | 0.1 |
| 2013 | 2,881.5 | 10.7 | 2,813.6 | −2.0 | 167.2 | 0.9 | 147.6 | 0.1 |
| 2014 | 2,892.7 | 11.2 | 2,814.2 | 0.6 | 168 | 0.8 | 147.7 | 0.1 |
| 2015 | 2,904.1 | 11.4 | 2,819.2 | 5 | 168.6 | 0.6 | 148 | 0.3 |
| 2016 | 2,918.9 | 14.8 | 2,830.8 | 11.6 | 169.2 | 0.6 | 148.4 | 0.4 |
| 2017 | 2,938.7 | 19.8 | 2,847.9 | 17.1 | 170.1 | 0.9 | 149.2 | 0.8 |
| 2018 | 2,959.6 | 20.9 | 2,867.1 | 19.2 | 171 | 0.9 | 150.1 | 0.9 |
| 2019 | 2,977.7 | 18.1 | 2,884.9 | 17.8 | 171.8 | 0.8 | 150.9 | 0.8 |
| 2020 | 2,989.3 | 11.6 | 2,897.6 | 12.7 | 172.2 | 0.4 | 151.5 | 0.6 |
| 2021 | 2,988.5 | −0.8 | 2,905.4 | 7.8 | 171.7 | −0.5 | 151.7 | 0.2 |
| 2022 | 2,986.4 | −2.1 | 2,910.2 | 4.8 | 170.9 | −0.8 | 151.9 | 0.2 |
| 2023 | 3,013.7 | 27.3 | 2,912.9 | 2.7 | 171.4 | 0.5 | 151.8 | 0.2 |
Δ indicates absolute annual change relative to the preceding year. M: male; F: female.
In 2023, the age-standardized death rate from all forms of diabetes was 37.2 per 100,000 people. Substantial regional variations existed in mortality and overall burden (Tables S1–4). Urbanized regions like Addis Ababa and agrarian regions like Sidama exhibited the highest prevalence and YLD rates. In contrast, premature mortality (YLLs) was disproportionately high in the South West region (1,139.6 per 100,000), Harari, and Afar.
The national age-standardized DALY rate was 1,124.2 per 100,000 (95% UI: 855.5–1,429.2), with YLDs at 295.7 per 100,000 and YLLs at 828.5 per 100,000. The spatial distribution of these burden metrics is summarized in Figure 3.
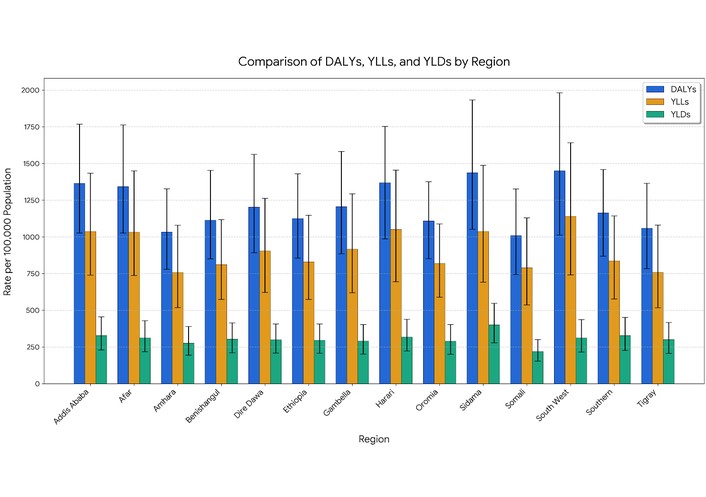
Age-standardized summary of DALYs, YLDs, and YLLs rates per 100,000 population due to diabetes mellitus by region/city administration in Ethiopia, 2023.
Metabolic risks accounted for the vast majority of attributable DALYs. High fasting plasma glucose was the leading proximal risk factor (1,124.2 DALYs per 100,000 people). However, high body mass index (BMI) was the leading upstream modifiable risk factor (264.1 DALYs per 100,000), followed by environmental/occupational risks (~241 DALYs per 100,000) and low physical activity (41.3 DALYs per 100,000) (Table S5). A similar pattern was observed for risk-attributable deaths, where higher BMI contributed substantially (6.89 deaths per 100,000) (Table S6).
This study provides the most comprehensive and updated assessment of the diabetes burden in Ethiopia using GBD 2023 data. Our findings reveal several critical insights. First, the overwhelming dominance of T2DM (> 99%) aligns with the broader African context, where rapid urbanization, dietary transitions toward high-calorie processed foods, and decreasing physical activity outpace the genetic or autoimmune etiology of T1DM [9, 10]. Second, the stark regional disparities, such as Somali’s prevalence being 45% lower than Sidama’s, highlight profound inequalities. This 45% difference translates into approximately 1,823 excess cases per 100,000 population in Sidama compared to Somali, representing a substantial disparity that demands geographically differentiated health planning and resource allocation. These variations likely reflect divergent socio-demographic trajectories rather than genetic differences. Sidama and Addis Ababa have higher urbanization rates and greater exposure to obesogenic environments, consistent with subnational evidence showing that urban populations in Ethiopia exhibit significantly higher metabolic risk factors than rural populations [2, 3, 11]. Conversely, the lower prevalence in Somali may be influenced by pastoralist lifestyles associated with higher physical activity, though severe underdiagnosis in these remote, under-resourced areas cannot be ruled out [12]. Third, regarding sex differences, prevalence and incidence remained consistently higher in males than in females. This persistent male predominance is likely driven by biological factors (e.g., higher visceral obesity rates in males) and differential healthcare-seeking behaviors, though the narrowing gap by 2023 suggests female metabolic risk exposures are rising rapidly as their socio-economic roles and urbanization rates change [13, 14].
Interestingly, regions like the South West and Afar exhibited the highest YLLs despite not having the highest prevalence. This suggests a “mortality penalty” driven by poor healthcare access, delayed diagnosis, and a lack of essential diabetes medications (insulin and oral hypoglycemic) in these peripheral regions [15, 16]. Evidence from Ethiopian clinical settings indicates that a majority of patients present with advanced complications and poor glycemic control due to late detection, directly translating into the high premature mortality observed in these specific regions [15, 16].
In this context of limited access to conventional pharmacotherapy, it is also important to recognize the widespread reliance on herbal medicine and natural products for diabetes management. In Ethiopia and similar settings, patients frequently turn to traditional remedies due to cultural acceptability, affordability, and accessibility. Typical herbal medicines such as mulberry (Morus spp.) and tea (Camellia sinensis) have garnered attention for their potential anti-diabetic properties. Mulberry leaves contain bioactive compounds like 1-deoxynojirimycin (DNJ), which inhibit carbohydrate-hydrolyzing enzymes and may reduce postprandial hyperglycemia [17]. Similarly, polyphenols found in tea have been associated with improved insulin sensitivity and a reduced risk of type 2 diabetes development in systematic reviews [18]. Acknowledging the role of these natural products is vital for a comprehensive understanding of diabetes management strategies in resource-limited settings, although further rigorous evidence is needed to standardize their integration with standard care and avoid potential interactions.
The observed decline in age-standardized YLLs from 1990 to 2023 represents a nuanced epidemiological shift. Ethiopia has historically battled high infectious disease mortality; however, recent declines in these competing causes of death (e.g., malaria, tuberculosis) would theoretically unmask diabetes deaths, which would act to increase YLLs [19, 20]. Therefore, the declining age-standardized YLLs we observed likely reflect genuine improvements in diabetes survival in urbanized areas due to better detection and access to care, alongside the mathematical effects of age-standardization removing the demographic shift of a youthful population aging over time [20].
While high fasting plasma glucose is a definitional proximal risk factor for diabetes, the critical policy message lies in upstream drivers. High BMI contributed substantially to attributable DALYs, acting as the primary modifiable precursor to insulin resistance. Temporal analyses of GBD data indicate that age-standardized DALYs attributable to high BMI and dietary risks have increased concurrently with diabetes prevalence over the past three decades globally and within Ethiopia [7, 21]. The interaction between these metabolic risks is critical: urbanization drives sedentary behavior and dietary shifts, which increase BMI, ultimately precipitating high fasting plasma glucose [2, 22].
These findings necessitate a shift from uniform national strategies to localized interventions. High-prevalence regions requiring obesity prevention include Sidama, Addis Ababa, and Harari, while high-mortality regions such as South West, Afar, and Harari need urgent health system strengthening to improve diabetes diagnosis and management. Specifically, in high-prevalence areas, interventions should focus on urban health policies: regulating processed food marketing, creating walkable urban environments, and integrating NCD screening into primary care [23, 24]. Conversely, in high-mortality regions, the priority must be strengthening health system capacity: ensuring the availability of essential medicines, training healthcare workers in peripheral health posts, and implementing task-shifting strategies for diabetes management [11, 25].
This study has limitations. As a GBD analysis, it relies on predictive modeling, which may not capture recent, acute changes in healthcare policy [26]. Furthermore, the analysis is ecological; we did not directly analyze regional covariate data (e.g., regional food security indices or local health expenditure), which limits our ability to definitively quantify the drivers of regional heterogeneity.
The growing burden of diabetes mellitus in Ethiopia, driven predominantly by type 2 diabetes and modifiable risk factors like high BMI, highlights the need for evidence-based strategies. Addressing profound regional disparities through tailored interventions for obesity prevention in high-prevalence urban centers and enhanced clinical capacity in high-mortality pastoral regions is essential. These targeted actions will mitigate the future impact of diabetes and support Ethiopia’s alignment with global Sustainable Development Goal targets for NCDs [27, 28].
BMI: body mass index
DALYs: disability-adjusted life years
EAPC: estimated annual percentage change
EPHI: Ethiopian Public Health Institute
GBD: Global Burden of Disease
IHME: Institute for Health Metrics and Evaluation
NCD: non-communicable disease
T1DM: type 1 diabetes mellitus
T2DM: type 2 diabetes mellitus
UI: uncertainty intervals
YLDs: years lived with disability
YLLs: years of life lost
The supplementary tables for this article are available at: https://www.explorationpub.com/uploads/Article/file/1001416_sup_1.pdf.
We are grateful for the collaboration between the National Data Management and Analytics Centre (NDMC) at the Ethiopian Public Health Institutes, the Institute for Health Metrics and Evaluation (IHME) at the University of Washington, and the GBD Collaborators Network of Experts, and Hawassa University for the Ethiopia national and subnational burden of disease analysis.
KTB, WA, JB, and AM: Conceptualization. KTB, WA, JB, YAJ, SM, ST, A Walker, MN, A Worku, TM, AEA, AY: Data curation. KTB, WA, AEA: Formal analysis. WA, JB, YAJ, SM, ST, A Walker, MN, A Worku, TM, AEA, AY, CM: Investigation. KTB, A Walker, MN, AM, A Worku, TM, AEA, AY: Methodology. AM: Project administration. A Walker, MN, AM: Resources. KTB, A Walker, MN: Software. A Walker, MN, A Worku: Supervision. A Walker, MN, AM: Validation. KTB, CM: Visualization. KTB, A Worku: Writing—original draft. KTB. WA. JB. YAJ. SM. ST. A Walker. MN. A Worku. TM. AEA. AY. CM. AM: Writing—review & editing. All authors read and approved the submitted version.
The authors declare that they have no competing interests.
The manuscript used open-access GBD 2023 secondary data from the Institute for Health Metrics and Evaluation (IHME), University of Washington Health Data portal. As secondary, de-identified data were used, formal ethics approval was not required.
As secondary, de-identified data were used, informed consent was not required.
Not applicable.
The datasets generated and/or analyzed during the study are available in the IHME Global Burden of Disease Data Exchange repository and can be accessed directly from: http://ghdx.healthdata.org/gbd-results-tool. The data will be made available, without undue reservation, to any qualified researcher.
The Bill and Melinda Gates Foundation funds national and subnational burden of disease studies (Grant Number: OPP1152504). The funder had no role in study design, data collection, analysis, interpretation, or writing of the report.
© The Author(s) 2026.
Open Exploration maintains a neutral stance on jurisdictional claims in published institutional affiliations and maps. All opinions expressed in this article are the personal views of the author(s) and do not represent the stance of the editorial team or the publisher.
Copyright: © The Author(s) 2026. This is an Open Access article licensed under a Creative Commons Attribution 4.0 International License (https://creativecommons.org/licenses/by/4.0/), which permits unrestricted use, sharing, adaptation, distribution and reproduction in any medium or format, for any purpose, even commercially, as long as you give appropriate credit to the original author(s) and the source, provide a link to the Creative Commons license, and indicate if changes were made.



View: 1443
Download: 81
Times Cited: 0


