 Original Article

Affiliation:
1Division of Rare Cancer Research, National Cancer Center Research Institute, Tokyo 104-0045, Japan
ORCID: https://orcid.org/0009-0001-3339-2587
Affiliation:
1Division of Rare Cancer Research, National Cancer Center Research Institute, Tokyo 104-0045, Japan
2Department of Pharmacology, Tokyo Women’s Medical University, Tokyo 162-8666, Japan
ORCID: https://orcid.org/0000-0003-1180-2394
Affiliation:
3Department of Pharmaceutical Microbiology, Faculty of Life Sciences, Kumamoto University, Kumamoto 862-0973, Japan
ORCID: https://orcid.org/0000-0003-4634-7133
Affiliation:
1Division of Rare Cancer Research, National Cancer Center Research Institute, Tokyo 104-0045, Japan
Email: takondo@ncc.go.jp
ORCID: https://orcid.org/0000-0001-6405-7792
Affiliation:
4Medical Seeds Discovery Project, Tochigi Cancer Center Research Institute, Tochigi 320-0834, Japan
Email: yuyoshim@tochigi-cc.jp
ORCID: https://orcid.org/0000-0003-0913-3507
Explor Med. 2026;7:1001403 DOI: https://doi.org/10.37349/emed.2026.1001403
Received: September 30, 2025 Accepted: April 07, 2026 Published: May 17, 2026
Academic Editor: Weihong Tan, Hunan University, China
Aim: Myxofibrosarcoma (MFS) is characterized by high local recurrence and complex microenvironmental interactions. Although three-dimensional (3D) culture systems better mimic in vivo tumor architecture than conventional two-dimensional (2D) monolayer cultures, the global proteomic consequences of dimensionality in MFS remain incompletely defined.
Methods: We performed quantitative mass spectrometry-based proteomic profiling of eight independently established patient-derived MFS cell lines cultured under 2D monolayer and 3D spheroid conditions. Differential protein expression and pathway enrichment analyses were conducted to delineate dimensionality-driven molecular programs.
Results: Culture dimensionality emerged as the principal determinant of proteomic variation across all cell lines. Compared with monolayers, 3D spheroids exhibited significant enrichment of hypoxia response, autophagy-related processes, extracellular matrix organization, and PI3K-Akt signaling pathways. In contrast, 2D cultures preferentially upregulated DNA replication, RNA processing, and cell-cycle-associated pathways. These findings indicate that 3D architecture alone is sufficient to induce coordinated stress-adaptive and survival-oriented proteomic reprogramming in MFS cells.
Conclusions: This study provides a comprehensive proteomic atlas defining dimensionality-dependent molecular states in MFS. While functional validation was beyond the scope of this work, the pathway rewiring identified here establishes a mechanistic framework for future hypothesis-driven investigations targeting autophagy- and PI3K-Akt-associated vulnerabilities in 3D MFS models.
Two-dimensional (2D) monolayer culture has long been the standard in vitro model in cancer research and drug discovery. Historically, 2D cultures have played a central role in functional studies of genes and proteins, as well as in the development of anticancer drugs, and they continue to serve as indispensable tools even in the era of cutting-edge multi-omics technologies. A comprehensive transcriptomic evaluation of 1,000 human cancer cell lines—spanning 22 tumor types—demonstrated the extensive use of 2D systems to interrogate gene expression landscapes across cancer types [1]. Similarly, large-scale proteomic mapping of 949 cancer cell lines revealed that 2D cultures remain a cornerstone for protein-level studies, enabling the identification of biomarkers and the integration of multi-omics data [2]. While technically straightforward and reproducible, 2D cultures fail to recapitulate the complex tumor microenvironment, including three-dimensional (3D) architecture, oxygen and nutrient gradients, and cell-cell/cell-extracellular matrix (ECM) interactions that are present in vivo. In contrast, 3D spheroid cultures better replicate these conditions, including hypoxia and nutrient limitations, which can profoundly influence cellular behaviors such as proliferation, stress adaptation, and treatment responses [3]. The advantages of spheroid-based models are increasingly recognized and are now widely incorporated into drug discovery pipelines [4]. A thorough understanding of the unique characteristics of both culture systems and the careful selection of the most appropriate model for specific research goals remain critical for advancing cancer research efficiently. Thus, establishing a molecular-level understanding of the phenotypic divergence between 2D and 3D cultures is essential. Across multiple cancer types, comparative studies have consistently shown that 3D culture systems induce profound transcriptional and proteomic reprogramming relative to 2D monolayers, affecting hypoxia signaling, metabolic adaptation, autophagy, epithelial-mesenchymal transition, and therapeutic resistance. These changes arise largely from diffusion gradients, altered mechanical constraints, and enhanced cell-cell and cell-ECM interactions that are absent in planar cultures. Recent studies comparing 2D and 3D culture models have highlighted substantial differences in gene and protein expression profiles across various cancer cell lines. Proteomic and phosphoproteomic analyses have revealed marked alterations in signaling pathways [5], metabolic states [6], and drug resistance mechanisms [7] between 2D and 3D conditions [8]. Because these studies are based on comprehensive datasets, they provide valuable insights when designing experimental systems. However, such comparative analyses remain relatively limited in scope and have not yet been extended to rarer malignancies such as myxofibrosarcoma (MFS).
MFS is a malignant soft tissue sarcoma characterized by an infiltrative growth pattern, a high risk of local recurrence, and typically presents as a slow-growing, painless mass, most commonly arising in the extremities of older adults [9]. A recent comprehensive review further highlights that high-grade MFS exhibits complex cytogenetic alterations, grading correlates with metastatic potential and mortality, and treatment options—particularly for advanced disease—remain markedly limited [10]. Treatment generally involves wide surgical resection, often combined with adjuvant radiotherapy, but recurrence remains common and outcomes may improve when managed at specialized sarcoma centers. Given the lack of effective systemic therapies and the high recurrence potential, more robust disease models are critically needed to facilitate biological studies and therapeutic development. To this end, our laboratory has established multiple patient-derived MFS cell lines to serve as experimental models [11–17]. Utilizing this comprehensive panel enables both mechanistic investigations into MFS pathobiology and the development of experimental platforms aimed at accelerating novel therapeutic strategies. Despite these advances, systematic proteomic comparisons between 2D and 3D culture systems have rarely been performed in sarcomas, and to our knowledge, have not been reported for MFS. Given the infiltrative growth pattern and strong microenvironmental dependency of MFS, evaluating dimensionality-driven proteomic states is particularly relevant for this disease. In the present study, we employed several patient-derived MFS cell lines to conduct a comprehensive comparative proteomic analysis of cells cultured under 2D monolayer and 3D spheroid conditions using data-independent acquisition mass spectrometry (DIA-MS).
DIA-MS has emerged as a powerful proteomic strategy that enables comprehensive, reproducible, and quantitative profiling of complex biological samples without the stochasticity of traditional data-dependent acquisition (DDA), thereby improving proteome coverage and quantification accuracy [18–20]. Our results revealed a striking dichotomy: Stress response-related pathways, such as hypoxia and autophagy, were markedly upregulated in spheroid cultures, whereas proliferation-related pathways, including cell cycle progression and DNA replication, were preferentially enhanced in monolayer cultures. In addition, we performed scanning electron microscopy (SEM) to examine the morphology of MFS spheroids, providing a detailed structural assessment that complements the proteomic findings.
A total of eight patient-derived MFS cell lines—NCC-MFS1-C1, NCC-MFS2-C1, NCC-MFS3-C1, NCC-MFS4-C1, NCC-MFS5-C1, NCC-MFS6-C1, NCC-MFS7-C1, and NCC-MFS8-C1—were used in this study [11–17]. All cell lines were originally established from surgically resected MFS tumors at the National Cancer Center Hospital, Tokyo, Japan, and have been fully characterized in previous reports. These cell lines have been deposited in public cell banks and are available for academic research. We clarified that the models used in this study are patient-derived MFS cell lines that have been stably maintained and characterized in previous publications, rather than primary short-term cultures.
Cells were maintained in Dulbecco’s Modified Eagle Medium/Nutrient Mixture F-12 (DMEM/F-12; Gibco, Grand Island, NY, USA) supplemented with 5% heat-inactivated fetal bovine serum (FBS; Gibco), 100 μg/mL penicillin and 100 μg/mL streptomycin (Nacalai Tesque, Kyoto, Japan), 0.4 µg/mL hydrocortisone (Sigma-Aldrich, St. Louis, MO, USA), 5 ng/mL epidermal growth factor (EGF; Sigma-Aldrich), 10 ng/mL basic fibroblast growth factor (bFGF; Sigma-Aldrich), 5 µg/mL insulin (Sigma-Aldrich), and 10 µM Y-27632 (Selleck Chemicals, Houston, TX, USA) at 37°C in a humidified atmosphere with 5% CO2. All cell lines were authenticated by short tandem repeat (STR) profiling prior to use. STR analysis was performed using a commercial human STR profiling service, and the resulting profiles were confirmed to match the reference profiles of the original cell lines. No evidence of cross-contamination or misidentification was detected.
For 3D spheroid cultures, single-cell suspensions were seeded into ultra-low attachment 96-well V-bottom plates (Sumitomo Bakelite Co., Ltd., Osaka, Japan) at a density of 5,000 cells/well in the same DMEM/F-12-based medium described above. Plates were incubated at 37°C under 5% CO2, and under these conditions, compact spheroids formed within 48 hours and were cultured for a total of 5 days before harvesting for proteomic analyses. The spheroid size and morphology were monitored using a phase-contrast microscope (Invitrogen EVOS imaging systems), and only uniformly shaped spheroids were used for subsequent experiments.
All cell lines were routinely tested for mycoplasma contamination using the MycoAlert Mycoplasma Detection Kit (Lonza) prior to experiments, and only mycoplasma-negative cultures were used in this study.
For H&E staining of spheroids, samples were embedded in iPGell (GenoStaff, Tokyo, Japan) and fixed in 10% neutral-buffered formalin, followed by replacement with 70% ethanol. Dehydration, xylene substitution, paraffin embedding to prepare (formalin-fixed paraffin-embedded) FFPE blocks, sectioning, and H&E staining were outsourced to Bioalch Co., Ltd. (Tokyo, Japan). Whole-slide images were acquired using a NanoZoomer system (Hamamatsu Photonics, Hamamatsu, Japan).
SEM analysis was performed following a previously published protocol [21] with minor modifications. MFS spheroids were fixed overnight at 4°C in 2.5% glutaraldehyde prepared in 0.1 M phosphate buffer (pH 7.4). After fixation, the spheroids were washed with phosphate-buffered saline (PBS) and postfixed in 1% osmium tetroxide (OsO4) for 30 min at room temperature. The samples were then dehydrated through a graded ethanol series, suspended in 100% ethanol, and air-dried. Dried samples were coated with a thin platinum layer using an MSP-1S sputter coater (Shinku Device, Ibaraki, Japan). The MFS spheroids were examined and imaged using a Phenom Pro desktop scanning electron microscope (Thermo Fisher Scientific, Waltham, MA, USA).
Cells cultured under 2D and 3D conditions were harvested, washed twice with ice-cold PBS, and lysed in 100 mM Tris-HCl (pH 8.5) containing 4% sodium dodecyl sulfate (SDS; Fujifilm Wako Pure Chemical Corp.). Samples were sonicated on ice using a Bioruptor II (SONIC Bio Co., Saitama, Japan) at high intensity with 30 s on/off cycles for 30 min. Lysates were clarified by centrifugation at 20,000 × g for 15 min at 4°C, and the supernatant was collected. Protein concentrations were determined using a NanoDrop spectrophotometer (Thermo Fisher Scientific).
For protein reduction, 2 μL of 200 mM tris(2-carboxyethyl)phosphine (TCEP; Thermo Fisher Scientific) was added to 40 μL of protein extract and incubated at 80°C for 10 min. Alkylation was performed by adding 2 μL of 375 mM iodoacetamide in 200 mM triethylammonium bicarbonate (TEAB) and incubating for 30 min at room temperature in the dark.
Protein cleanup and digestion were performed using the single-pot, solid-phase-enhanced sample preparation (SP3) method with minor modifications. Briefly, 20 μL of magnetic beads were added to each alkylated sample, followed by ethanol to a final concentration of 75% (v/v). After mixing for 10 min, the beads were washed twice with 800 μL of 80% ethanol. Beads were resuspended in 100 μL of 50 mM Tris-HCl (pH 8.0) containing 200 ng sequencing-grade trypsin (Promega) and 200 ng lysyl endopeptidase (Fujifilm Wako Pure Chemical Corp.) and incubated at 37°C for 18 h.
Peptides were desalted using MonoSpin C18 columns (GL Sciences, Tokyo, Japan), eluted with 50% acetonitrile (ACN) containing 0.1% trifluoroacetic acid (TFA), and vacuum dried. Dried peptides were resuspended in 20 μL of 3% ACN with 0.1% formic acid using vortexing and ultrasonic agitation (30 s on 30 s off, 10 min, 4°C).
Peptide separation was performed on an Ultimate 3000 RSLCnano system (Thermo Fisher Scientific). Samples were loaded onto a 75 μm × 30 cm nanoLC column (CoAnn Technologies, Richland, WA, USA) maintained at 50°C. A linear gradient was applied using solvent A (0.1% formic acid in water) and solvent B (0.1% formic acid in 80% ACN) at a flow rate of 150 nL/min: 0 min, 5% B; 86 min, 33% B; 92 min, 70% B; and 100 min, 70% B.
Eluted peptides were analyzed using a ZenoTOF 7600 mass spectrometer (SCIEX, Framingham, MA, USA) operated with the narrow Zeno SWATH acquisition method.
Raw data were analyzed using DIA-NN (version 1.9.1) in library-free mode. An in silico spectral library was generated from the UniProt human proteome database (Proteome ID: UP000005640; 20,591 entries; downloaded March 2024). Database searching was performed assuming trypsin specificity, allowing up to two missed cleavages and restricting peptide lengths to 7–45 amino acids. Precursor charges of +2 to +4 were considered, with precursor m/z values ranging from 495 to 865 and fragment ion m/z values from 200 to 1,800. Carbamidomethylation of cysteine was set as a fixed modification, while oxidation of methionine and N-terminal acetylation were treated as variable modifications.
A false discovery rate (FDR) threshold of 1% was applied at both the peptide and protein levels. Only proteins quantified in at least 80% of samples within each condition were retained for downstream analyses.
Protein intensities were log2-transformed. Missing values were imputed as zero for statistical testing. For paired comparisons between 2D and 3D cultures, samples from the same cell line (NCC-MFS1-C1 to NCC-MFS8-C1) were treated as matched pairs. Differentially expressed proteins (DEPs) were identified using the limma package with a paired design, where proteins with unadjusted p < 0.05 were considered significant. Principal component analysis (PCA) and hierarchical clustering of Pearson correlation heatmaps were performed to evaluate overall proteomic patterns. Volcano plots and heatmaps were generated in R v4.3.1 with ggplot2 and pheatmap. For rank-abundance analysis, protein abundance was calculated as the median intensity across samples within each culture condition, log10-transformed, and ranked in descending order. FDA-approved actionable cancer-related targets detected in the proteomic dataset were highlighted on the abundance curves. For functional enrichment, gene set enrichment analysis (GSEA), including Gene Ontology (GO) biological process (BP), molecular function (MF), and cellular component (CC) terms, as well as Kyoto Encyclopedia of Genes and Genomes (KEGG) pathways, was conducted on the full proteome. Protein groups were mapped to gene symbols and converted to ENTREZ IDs, with duplicates collapsed by mean. Log2 fold change (3D-2D) was used as the ranking metric. Analyses were performed with clusterProfiler v4.8.1 (gseGO for GO BP/MF/CC, gseKEGG for KEGG, and GSEA with TERM2GENE for MSigDB Hallmark and Reactome), using OrgDb = org.Hs.eg.db, minGSSize = 10, maxGSSize = 500, Benjamini-Hochberg adjustment, and an FDR threshold of 0.25.
To investigate morphological differences between 2D monolayer and 3D spheroid cultures, we examined eight patient-derived MFS cell lines using phase-contrast microscopy, H&E staining (Figure 1A), and SEM (Figure 1B). Under 2D conditions, all MFS cell lines formed adherent monolayers with elongated, spindle-shaped cells, consistent with previous reports on their fibroblast-like histology. In contrast, 3D spheroid cultures formed compact, uniformly sized aggregates within 48 hours after seeding, which were maintained over five days of culture. H&E staining revealed preserved cellularity and distinct peripheral compaction, mimicking in vivo tissue architecture. SEM further demonstrated tightly packed cellular arrangements and intercellular junctions in spheroids, suggesting enhanced cell-cell and cell-ECM interactions relative to 2D cultures.
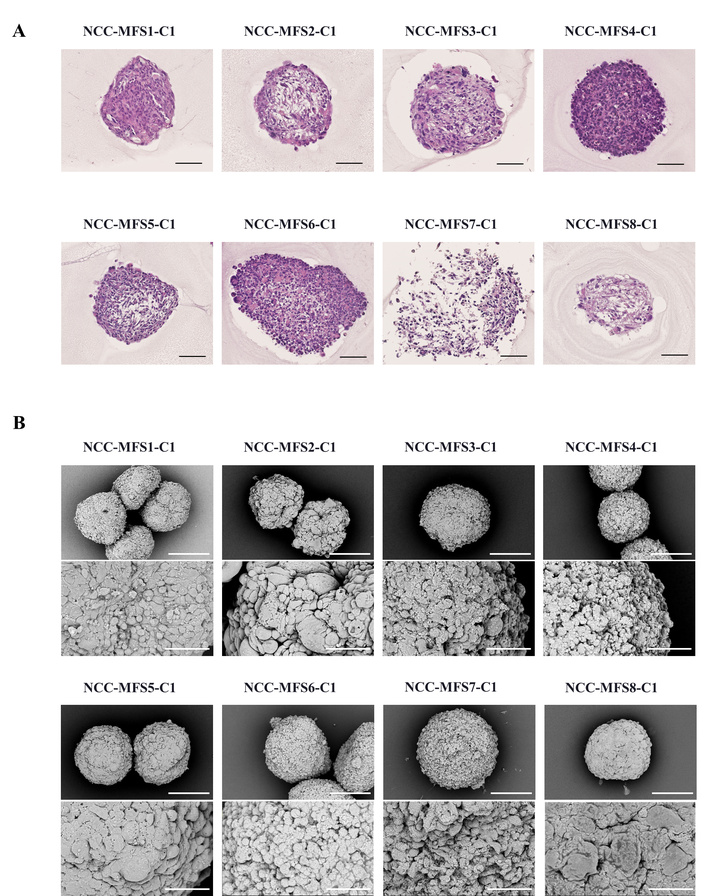
Morphological characterization of 3D tissue cultures of MFS cell lines. (A) Hematoxylin and eosin (H&E) staining of 3D tissue cultures derived from eight myxofibrosarcoma (MFS) cell lines (NCC-MFS1-C1 to NCC-MFS8-C1) cultured in ultra-low attachment V-bottom plates; scale bar 100 μm. (B) Scanning electron microscopy (SEM) images of 3D tissue cultures from all eight MFS cell lines (NCC-MFS1-C1 to NCC-MFS8-C1); upper panels: ×700 magnification, scale bars 200 μm; lower panels: ×3,000 magnification, scale bars 50 μm.
We next conducted DIA-MS to comprehensively profile the proteomes of 2D and 3D cultures across all eight MFS cell lines (Figure 2). On average, over 70,000 peptides were detected per sample (Figure 2A), contributing to the identification of 8,715 total unique proteins across both conditions, with 8,509 proteins shared between the two groups. The complete list of identified proteins and the corresponding raw intensity data for each 2D and 3D sample are provided in Table S1. Among these, an average of 5,456 proteins were consistently identified in 2D cultures and 4,969 proteins in 3D spheroids, demonstrating reproducible detection across biological replicates (Figure 2B). Cross-referencing with the Catalogue of Somatic Mutations in Cancer (COSMIC) database identified 456 cancer-associated proteins in 2D cultures and 454 in 3D spheroids, covering key oncogenic drivers and tumor suppressors relevant to soft tissue sarcomas (Figure 2C–E). These results confirm that DIA-MS provides a highly comprehensive and quantitative proteomic landscape of MFS cells under both culture conditions, establishing a robust baseline for comparative analysis.
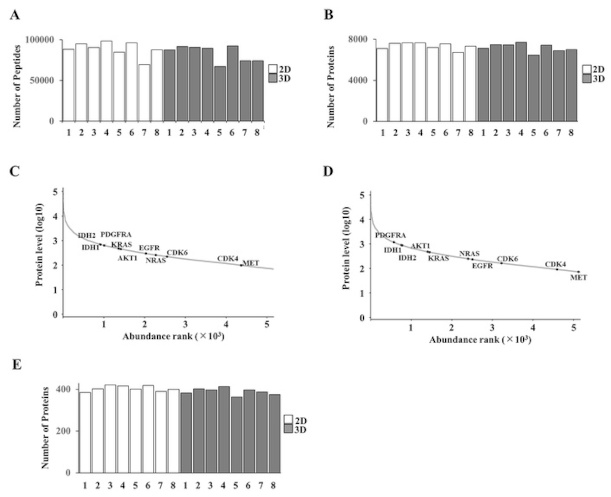
Overview of mass spectrometry-based proteomic profiling. (A) Number of peptides identified per sample across all MFS cell lines (1–8: NCC-MFS1-C1 to NCC-MFS8-C1) under 2D and 3D culture conditions. (B) Total number of proteins detected in 2D and 3D cultures across the eight cell lines. (C, D) Rank-abundance curves of quantified proteins in 2D (C) and 3D (D) cultures. Protein abundance was calculated as the median intensity within each condition and ranked in descending order. The y-axis shows log10-transformed protein levels, and FDA-approved actionable cancer-related targets are highlighted in black and labeled. (E) Number of COSMIC-defined cancer-related proteins identified in each cell line under both culture conditions. COSMIC: Catalogue of Somatic Mutations in Cancer; FDA: Food and Drug Administration.
We next investigated the overlap and exclusivity of proteins detected under 2D and 3D culture conditions (Figure 3). Venn diagram analysis of the total identified proteome (8,715 proteins) revealed that 8,509 proteins were commonly detected in both conditions, whereas 101 proteins were unique to 2D cultures and 105 proteins were exclusive to 3D spheroids (Figure 3A). When focusing on cancer-associated proteins defined by the COSMIC database, 453 proteins were shared, while 3 and 1 were unique to 2D and 3D cultures, respectively (Figure 3B). Functional annotation of these exclusive sets revealed a clear biological divergence: Proteins uniquely identified in 3D cultures were enriched for processes related to hypoxia response, autophagy, and ECM remodeling. In contrast, 2D-exclusive proteins were primarily associated with cell cycle regulation and RNA processing. These findings suggest that 3D spheroids selectively activate molecular programs for stress adaptation and microenvironmental interaction, whereas 2D cultures preferentially support proliferation-associated processes.
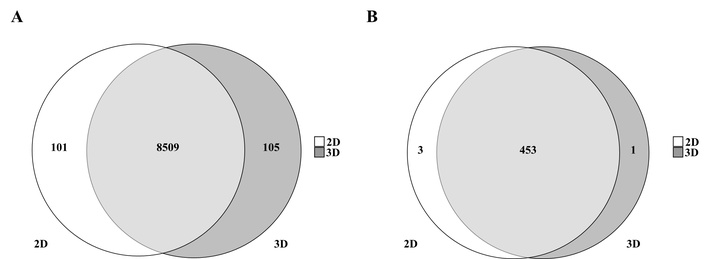
Proteins uniquely detected in each culture condition. (A) Venn diagram shows proteins uniquely or commonly observed in 2D and 3D tissue cultures. (B) Venn diagram of cancer-associated proteins, as defined in COSMIC, detected in 2D and 3D tissue cultures. COSMIC: Catalogue of Somatic Mutations in Cancer.
PCA based on all quantified proteins showed a clear tendency for separation between 2D and 3D cultures along the first principal component, while samples derived from the same patient remained closely clustered (Figure S1). A similar trend was observed when the analysis was restricted to COSMIC-defined cancer-associated proteins, further supporting the presence of global proteomic differences between culture conditions across MFS cell lines (Figure S2). Hierarchical clustering analysis also demonstrated that samples were grouped primarily according to culture condition rather than cell line, underscoring the dominant influence of 2D versus 3D environments on proteomic profiles (Figure 4C, D). Volcano plot analysis identified 286 proteins significantly upregulated in 3D spheroids and 439 proteins upregulated in 2D cultures (p < 0.05, |log2 fold change| ≥ 1) (Figure 4A). Among COSMIC-defined cancer-associated proteins, 6 were upregulated in 3D cultures and 20 in 2D cultures, further highlighting the distinct regulatory programs induced by different culture conditions (Figure 4B).
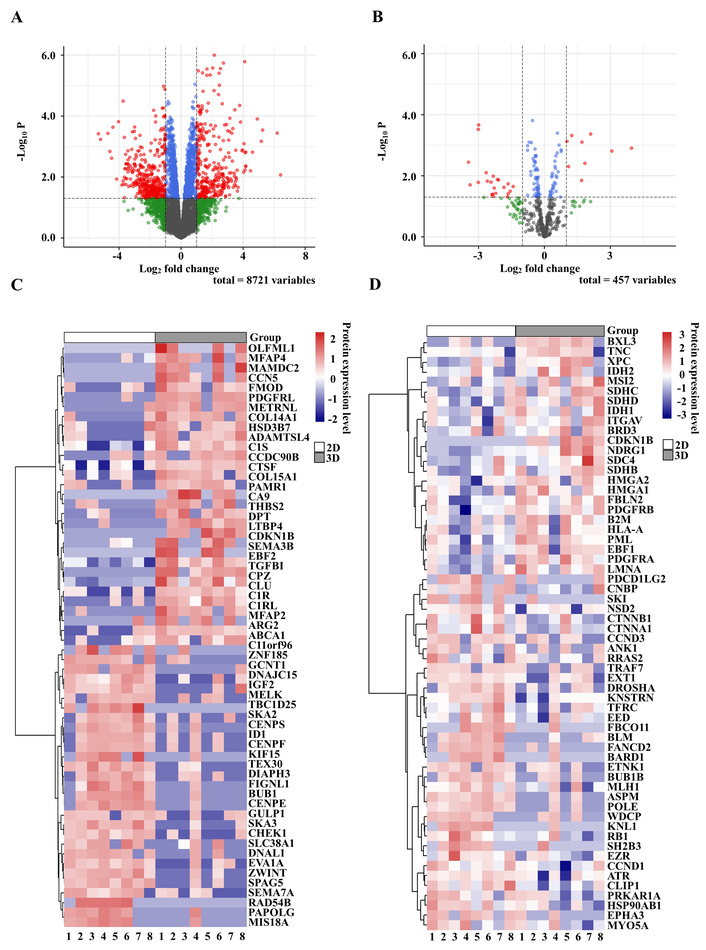
Differential protein expression between 2D and 3D cultures. (A) Volcano plot of all detected proteins (y-axis: –log10 p-value; x-axis: log2 fold change). Missing values were imputed as zero. Significance thresholds were set at p < 0.05 (horizontal dashed line) and |log2 fold change| ≥ 1 (vertical dashed lines). Gray: not significant; green: significant by log2 fold change only; blue: significant by p-value only; red: significant by both criteria. Proteins on the right side (positive log2 fold change) are upregulated in 3D culture, whereas those on the left side (negative log2 fold change) are upregulated in 2D culture. (B) Volcano plot of COSMIC-listed cancer-related proteins (y-axis: –log10 p-value; x-axis: log2 fold change), analyzed under the same conditions as in (A). (C) Heatmap of the top 30 differentially expressed proteins upregulated in each condition (rows: proteins; columns: samples; color scale: row-wise Z-score). (D) Heatmap of differentially expressed COSMIC-listed cancer-related proteins (rows: proteins; columns: samples; color scale: row-wise Z-score). Samples are labeled 1–8 corresponding to NCC-MFS1-C1 to NCC-MFS8-C1. COSMIC: Catalogue of Somatic Mutations in Cancer.
To gain biological insights into the observed proteomic differences, we performed functional enrichment analyses using multiple pathway databases (Figure 5; Figures S3–S6). Across all analyses, proteins upregulated in 3D cultures were consistently enriched in pathways related to ECM organization, cell-matrix interaction, hypoxia response, autophagy, and tumor-associated signaling pathways, including PI3K-Akt, TGF-β, and Hippo signaling. These features reflect enhanced microenvironmental adaptation and tumor-like phenotypes in 3D spheroids. In contrast, proteins upregulated in 2D cultures were predominantly associated with cell cycle progression, DNA replication, RNA processing, and MYC/E2F-driven transcriptional programs, consistent with their highly proliferative state.
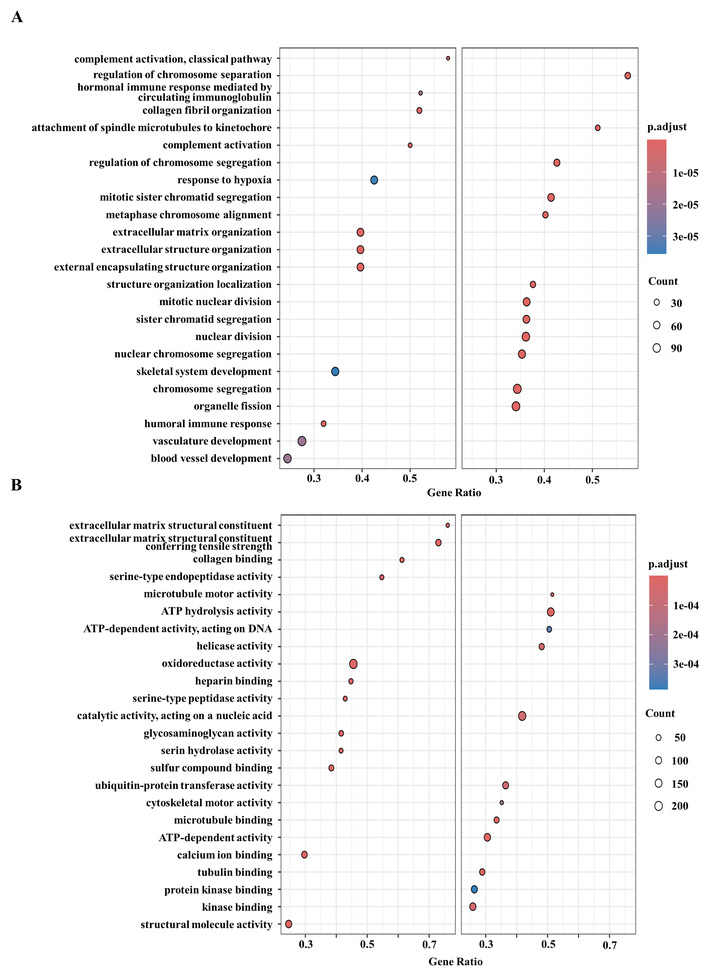
Functional enrichment analysis of differentially expressed proteins between 2D and 3D cultures. (A) Enriched Gene Ontology biological process (GO BP) terms. Left panel: pathways upregulated in 3D culture; right panel: pathways upregulated in 2D culture. (B) Enriched Gene Ontology molecular function (GO MF) terms. Left panel: pathways upregulated in 3D culture; right panel: pathways upregulated in 2D culture. Dot color indicates FDR (adjusted p-value, Benjamini-Hochberg correction), and dot size indicates the number of proteins mapped to each pathway (mapped genes via protein IDs). GSEA was performed using log2 fold change (3D-2D; positive values indicate higher expression in 3D) as the ranking metric, with duplicates collapsed by mean values. FDR: false discovery rate; GSEA: gene set enrichment analysis.
These trends were reproducible across GO, KEGG, Hallmark, and Reactome analyses (Figures S3–S6), indicating a robust and systematic rewiring of biological programs between 2D and 3D culture conditions. Taken together, these results demonstrate that 3D cultures more faithfully recapitulate tumor-relevant BPs, particularly ECM remodeling and microenvironmental adaptation, whereas 2D cultures primarily reflect proliferative cellular programs.
This study provides a systematic and multi-angle comparison of the proteomic programs operating in patient-derived MFS cell lines when grown as conventional 2D monolayers versus 3D spheroids. Across eight independently established lines, we observed a coherent and reproducible divergence between these culture contexts: Spheroids preferentially upregulated stress-adaptation and microenvironment-coupled pathways—including hypoxia responses, autophagy, ECM organization, angiogenesis, and epithelial-to-mesenchymal transition (EMT)—whereas monolayers favored proliferative circuitry encompassing DNA replication, RNA processing, and cell-cycle control. Morphological assessments by phase-contrast microscopy, H&E staining of spheroid sections, and SEM reinforced these proteomic distinctions, revealing compact tissue-like architecture with dense intercellular packing in spheroids in contrast to the spindle-like, adherent growth characteristic of 2D cultures. Together, these results indicate that culture dimensionality exerts a dominant and cell line-independent influence on the MFS proteome and, by extension, on the biological state captured in experimental sarcoma models.
In the broader cancer modeling field, extensive multi-omics catalogs derived from 2D cell lines have demonstrated substantial value for mechanistic studies and drug-screening applications [1, 2]. However, these systems often fail to reproduce key features of the tumor microenvironment, including spatial architecture, oxygen gradients, and cell-ECM interactions that strongly influence cellular behavior [3–6]. Previous studies in epithelial malignancies have documented pronounced proteomic and transcriptomic rewiring between 2D and 3D growth states, including changes in hypoxia signaling, autophagy, EMT, metabolic adaptation, and survival pathways [5–8]. In contrast, comparable systematic analyses in sarcomas remain scarce. To our knowledge, comprehensive proteomic profiling comparing 2D and 3D culture systems in MFS has not been previously reported. By demonstrating that MFS spheroids consistently display enhanced hypoxia-associated signaling, ECM remodeling, and metabolic adaptation-related features, while monolayers prioritize proliferative programs, our findings align with observations reported across other tumor types [7, 8, 10, 22] and extend these principles to a clinically challenging sarcoma. Importantly, the use of multiple independently derived patient lines indicates that culture dimensionality can override inter-line variability, emphasizing its fundamental role in shaping tumor cell state. Future integrative analyses comparing these proteomic signatures with publicly available transcriptomic datasets from MFS patient cohorts may further clarify the extent to which spheroid-derived stress-response programs mirror in vivo tumor biology.
The biological basis for these differences is consistent with well-established properties of 3D tumor growth. Spheroid architecture generates diffusion gradients that induce metabolic reprogramming, oxidative stress responses, autophagy activation, angiogenic factor secretion, and altered lactate metabolism [6, 22]. Hypoxia-induced autophagy has emerged as a central adaptive mechanism in many solid tumors, enabling survival under nutrient limitation and oxidative stress through regulation of the PI3K-Akt-mTOR signaling axis [23–27]. 3D tumor models frequently exhibit enhanced autophagic activity compared with monolayer cultures, reflecting cellular adaptation to spatial constraints and metabolic stress [22, 24, 26, 27]. In addition, ECM remodeling and enhanced cell-cell interactions within spheroids activate integrin signaling pathways that converge on focal adhesion kinase (FAK) and PI3K-Akt survival networks [5, 14]. While the present study was designed as a discovery-oriented proteomic analysis rather than a mechanistic perturbation study, the consistent activation of hypoxia- and autophagy-related pathways across multiple independent MFS lines provides a strong rationale for future functional interrogation of these signaling circuits in 3D sarcoma models.
These divergent proteomic states have important implications for experimental modeling and therapeutic exploration in MFS. The spheroid proteome—enriched for ECM organization, angiogenic signaling, and stress-adaptation pathways—may reflect biological features associated with the infiltrative growth pattern and recurrence-prone behavior characteristic of this sarcoma subtype [10, 16]. Among the cancer-associated proteins identified through COSMIC annotation, several components of the PI3K-Akt signaling network and autophagy regulatory machinery represent pharmacologically actionable targets currently under investigation in sarcoma and other solid malignancies. These observations raise the possibility that spheroid systems may reveal therapeutic vulnerabilities that remain masked in proliferation-dominated 2D cultures, including potential sensitivity to autophagy inhibition, angiogenic blockade, or integrin/FAK-directed therapies [14, 17, 26]. Conversely, monolayer cultures remain advantageous for high-throughput functional screening approaches, including genetic perturbation and small-molecule screening applications, where efficient cell expansion and assay scalability are important considerations [2].
From a translational perspective, an integrated experimental workflow may therefore be optimal. Initial discovery in 2D systems can enable scalable screening and rapid hypothesis generation, whereas subsequent validation in 3D spheroids provides a more physiologically constrained environment that captures hypoxia, structural organization, and stress adaptation. Incorporating morphology-aware endpoints—such as spheroid integrity, invasive behavior, and viability under hypoxic stress—may further improve the predictive value of preclinical testing [7, 28, 29].
Annotation of the proteomic dataset with COSMIC cancer-associated proteins also indicates that dimensionality-dependent rewiring extends into canonical oncogenic signaling networks rather than being restricted to general metabolic housekeeping pathways [2]. Environmental cues including oxygen availability, ECM composition, and mechanical tension, therefore appear capable of reshaping oncogenic signaling programs in a context-dependent manner. Such plasticity supports the concept that 3D culture systems may more faithfully capture context-specific oncogene dependencies and potential therapeutic windows than conventional monolayer models [5, 30, 31].
From a technical perspective, this study leveraged the depth and quantitative reproducibility of Zeno SWATH-DIA proteomics combined with library-free DIA-NN analysis and retention-time alignment strategies [18–20]. The high consistency observed across biological replicates enabled robust exploratory analyses—including PCA, hierarchical clustering, volcano plots, and pathway enrichment—while minimizing the risk of overfitting. Such analytical rigor is essential to confidently distinguish biologically meaningful state transitions from technical variation in large-scale proteomic datasets.
In this work, we deliberately employed single-cell-derived spheroids in order to isolate the intrinsic impact of culture dimensionality on tumor cell proteomic programs. While multicellular organoid systems incorporating stromal, immune, or endothelial compartments may more closely approximate the full tumor microenvironment, they also introduce additional biological complexity that can obscure tumor cell-autonomous signaling responses. The current approach therefore provides a controlled framework for defining how 3D growth alone reshapes the molecular state of MFS cells.
Several limitations should nevertheless be acknowledged. Although spheroids reproduce certain aspects of tumor microenvironmental stress, they lack immune components, vascular structures, and stromal heterogeneity and therefore capture only part of the tumor ecosystem [4, 32]. Co-culture models incorporating fibroblasts or endothelial cells, as well as organotypic ECM systems with defined stiffness, may provide improved representation of cell-cell signaling and matrix mechanics that contribute to MFS invasiveness [33, 34]. In addition, our analysis focused on steady-state proteomic profiles at a single time point. Temporal profiling during spheroid formation may reveal early adaptive responses and dynamic pathway activation preceding the proteomic landscape observed at later stages. Furthermore, post-translational regulatory layers—including phosphorylation, ubiquitination, and acetylation—likely play critical roles in modulating stress signaling and survival pathways [6, 18, 35]. Future phosphoproteomic or post-translational modification (PTM)-focused DIA workflows could therefore uncover additional regulatory dimensions [36]. Finally, although the use of eight patient-derived lines improves representativeness, stratification according to tumor grade, anatomical origin, or genomic background may reveal clinically relevant subtype-specific proteomic programs [9, 37].
Looking forward, several avenues for further investigation emerge from these findings. Mechanism-oriented perturbation studies—including targeted inhibition of the PI3K-Akt-mTOR axis or pharmacological modulation of autophagy—may clarify causal relationships between the pathways identified here and spheroid survival phenotypes. Integrating proteomic measurements with isotope-resolved metabolomics could further elucidate metabolic rewiring associated with 3D growth states [22]. Comparative testing of candidate therapeutic agents—including autophagy inhibitors, hypoxia-targeting compounds, CDK inhibitors, transcriptional modulators, and integrin/FAK/PI3K pathway inhibitors—across both 2D and 3D systems may help identify context-dependent vulnerabilities relevant for MFS therapy [17, 26, 38]. Ultimately, spatially resolved proteomic profiling of clinical tumor specimens could determine whether the 3D-enriched molecular signatures identified in this study localize to hypoxic or invasive tumor niches in vivo and whether their presence correlates with recurrence risk or therapeutic resistance [24, 27, 39].
In conclusion, culture dimensionality emerges as a first-order determinant of the proteomic landscape in MFS. 3D spheroid growth accentuates microenvironment-associated stress responses—including hypoxia adaptation, autophagy activation, and ECM remodeling—whereas monolayer culture preferentially supports proliferative programs. By combining deep quantitative proteomics with multiple patient-derived models, this study delineates complementary roles for 2D and 3D systems in sarcoma research and provides a resource for future mechanistic and therapeutic investigations aimed at bridging preclinical models and the complex tumor microenvironment of MFS.
2D: two-dimensional
3D: three-dimensional
ACN: acetonitrile
BP: biological process
CC: cellular component
COSMIC: Catalogue of Somatic Mutations in Cancer
DIA-MS: data-independent acquisition mass spectrometry
DMEM/F-12: Dulbecco’s Modified Eagle Medium/Nutrient Mixture F-12
ECM: extracellular matrix
EMT: epithelial-to-mesenchymal transition
FAK: focal adhesion kinase
FDR: false discovery rate
GO: Gene Ontology
GSEA: gene set enrichment analysis
H&E: hematoxylin and eosin
KEGG: Kyoto Encyclopedia of Genes and Genomes
MF: molecular function
MFS: myxofibrosarcoma
PBS: phosphate-buffered saline
PCA: principal component analysis
SEM: scanning electron microscopy
STR: short tandem repeat
The supplementary tables for this article are available at: https://www.explorationpub.com/uploads/Article/file/1001403_sup_1.xlsx. The supplementary figures for this article are available at: https://www.explorationpub.com/uploads/Article/file/1001403_sup_2.pdf.
The authors are deeply grateful to Dr. Toshiyuki Ishiwata (Division of Aging and Carcinogenesis, Research Team for Geriatric Pathology, Tokyo Metropolitan Institute for Geriatrics and Gerontology, Tokyo, Japan) for providing the protocol for scanning electron microscopy (SEM). The authors also thank Hiroshi Matsumoto and Shoko Wada (Jasco International Co., Ltd., Division II, Tokyo Service Center, Tokyo, Japan) for kindly allowing us to use the SEM instrument. In addition, we would like to thank Naoki Iwashita (Bioalche Inc., Tokyo, Japan) for performing hematoxylin and eosin staining.
YS: Conceptualization, Investigation, Data curation, Writing—original draft, Writing—review & editing. RN: Visualization, Writing—original draft, Writing—review & editing, Formal analysis. SO: Methodology, Data curation, Writing—original draft, Writing—review & editing. TK: Supervision, Resources, Writing—original draft, Writing—review & editing, Formal analysis. YY: Conceptualization, Funding acquisition, Supervision, Writing—original draft, Writing—review & editing, Formal analysis. All authors read and approved the submitted version.
The authors declare that they have no conflicts of interest.
Not required.
Not required.
Not required.
The mass spectrometry proteomic data have been deposited in the ProteomeXchange Consortium via the jPOST partner repository, with dataset identifiers PXD068856 for ProteomeXchange and JPST004096 for jPOST.
This research was supported by the internal research funding provided to Yuki Yoshimatsu by the Tochigi Cancer Center in fiscal year 2025. This work was supported by the Japan Agency for Medical Research and Development (AMED) under grant numbers [20ck0106537h] and [AMED-BINDS 25ama121018j], and partially by KAKENHI grants [22K09390] and [25K12471]. The funding sources had no role in the study design, data collection and analysis, decision to publish, or preparation of the manuscript.
© The Author(s) 2026.
Open Exploration maintains a neutral stance on jurisdictional claims in published institutional affiliations and maps. All opinions expressed in this article are the personal views of the author(s) and do not represent the stance of the editorial team or the publisher.
Copyright: © The Author(s) 2026. This is an Open Access article licensed under a Creative Commons Attribution 4.0 International License (https://creativecommons.org/licenses/by/4.0/), which permits unrestricted use, sharing, adaptation, distribution and reproduction in any medium or format, for any purpose, even commercially, as long as you give appropriate credit to the original author(s) and the source, provide a link to the Creative Commons license, and indicate if changes were made.

View: 575
Download: 16
Times Cited: 0
