Original Article

Affiliation:
1Department of Ophthalmology and Ross Eye Institute, Jacobs School of Medicine and Biomedical Sciences, University at Buffalo, State University of New York, Buffalo, NY 14203, United States
Affiliation:
2Neuroscience Program, Jacobs School of Medicine and Biomedical Sciences, University at Buffalo, State University of New York, Buffalo, NY 14203, United States
Affiliation:
3Department of Clinical Research, New York Ophthalmology Associates PLCC, New York, NY 10023, United States
Affiliation:
4Department of Ophthalmology and Flaum Eye Institute, University of Rochester, Rochester, NY 14642, United States
Affiliation:
1Department of Ophthalmology and Ross Eye Institute, Jacobs School of Medicine and Biomedical Sciences, University at Buffalo, State University of New York, Buffalo, NY 14203, United States
2Neuroscience Program, Jacobs School of Medicine and Biomedical Sciences, University at Buffalo, State University of New York, Buffalo, NY 14203, United States
Affiliation:
3Department of Clinical Research, New York Ophthalmology Associates PLCC, New York, NY 10023, United States
4Department of Ophthalmology and Flaum Eye Institute, University of Rochester, Rochester, NY 14642, United States
Email: Karen_Allison@urmc.rochester.edu
ORCID: https://orcid.org/0000-0003-3100-9545
Explor Med. 2025;6:1001329 DOI: https://doi.org/10.37349/emed.2025.1001329
Received: December 16, 2024 Accepted: April 17, 2025 Published: June 08, 2025
Academic Editor: Dimitra Skondra, University of Chicago, USA
Aim: There is a lack of access to eye care due to economic, cultural, and linguistic barriers in addition to insufficient accessibility of providers. By focusing on the main causes of blindness, we hope to bring awareness of the inequity in eye healthcare for racial and ethnic minorities. The purpose of this study is to determine the prevalence of diabetic retinopathy, glaucoma, and cataract in Erie and Monroe County, New York and highlight any association with variables such as age, race/ethnicity, gender, or health insurance.
Methods: Data from the Vision and Eye Health Surveillance System (VEHSS) was obtained to create comprehensive estimates of the prevalence of glaucoma, cataracts, and diabetic retinopathy from 2016 to 2018. Secondary data analysis for variables such as life expectancy and median household income was conducted with data from the Asset Limited, Income Constrained, Employed (ALICE) Threshold, American Community Survey, the United States Census Bureau, and the Health Resources and Services Administration.
Results: The prevalence rates of diagnosed cataracts and glaucoma in the Western New York regions of Erie and Monroe counties were lower than in New York State (NYS). The analysis highlighted that rates of diabetic retinopathy, glaucoma, and cataracts are higher in African Americans and Hispanics than the other races. Annual utilization of eye care in NYS was 49.2%, and Erie and Monroe County had lower utilization rates of 45.6% and 42.8% respectively.
Conclusions: The results suggest that utilization of eye care services in Western New York was lower than NYS, which is a possible contributor to worsened eye health outcomes of minorities. Hence, educating both patients and providers is an important step toward improving inclusivity and cultural competency in the healthcare environment. Promoting health literacy, screenings, and improving access to eye care can allow individuals to be more inclined to seek out regular eye examinations, resulting in improved community outcomes.
Over the last decade, the United States has experienced an increase in size, age, and diversity within its population. According to the United States Census Bureau, the United States population grew 7.3% over the last decade, reaching 309 million people in 2021 [1]. This growth has been accompanied by notable shifts in the ethnic and racial composition of the population. The White (non-Hispanic) group, while still the largest racial or ethnic group in the United States, has seen a decrease in its share of the population from 63.8% in 2010 to 59.3% in 2021. This reflection of the increasing heterogenous racial and ethnic make-up of the United States is also driven by the growth of other racial groups, particularly the Hispanic/Latino population which increased by almost 12 million individuals during the same time period, now accounting for 18.9% of the American population [1].
The aging of the American population is another significant trend, with the proportion of individuals over the age of 65-years-old increasing from 13.1% in 2010 to 16.8% in 2021 [1]. This demographic shift may be attributed to advancements in healthcare, science, and technology, leading to longer life expectancy and an aging population.
Similar population trends in regard to size, diversity, and age can be seen within the largest counties in Western New York: Erie and Monroe County. Over the last 10 years, the population in Erie County grew by 3.4% from 919,160 to 950,683, while Monroe County experienced a 1.4% increase from 744,344 to 755,160. These changes are indicative of population growth and dynamics within the region. The racial and ethnic composition of both counties has also evolved since 2010, with an increase in diversity. In Erie County, the White (non-Hispanic) group decreased from 77.8% to 74.4%. Between this time period, Asian (non-Hispanic) residents saw the most population growth compared to any other racial group, increasing from 1.6% to 4.2%. The Hispanic/Latino population also saw an increase from 4.6% to 6%. Similarly, in Monroe County in 2021, the White (non-Hispanic group) decreased from 72.9% to 69.8% while the Hispanic/Latino population grew the most of any other racial group, increasing from 7.3% to 9.6%. Of note, the Black and African American population remained steady within both Erie and Monroe County at 12.8% and 14.4%, respectively. These changes underscore the increasing diversity within the counties and align with the broader national demographic shifts [1]. The aging population trend is also evident in Erie and Monroe County, mirroring the national patterns. Within the last decade, the proportion of the population aged 65 and older increased from 15.7% to 18.7% in Erie County and from 14% to 18.3% in Monroe County [1].
As the country continues to evolve, understanding and adapting to these demographic shifts will be crucial for effective policymaking and for addressing the racial disparities in eye care. This study was designed to investigate the prevalence rates of chronic eye diseases such as cataracts, glaucoma, and diabetic retinopathy (DR) in the largest Western New York counties in New York State: Erie and Monroe counties.
DR is the 3rd leading cause of overall blindness in the United States and is the leading cause of blindness in working-aged adults around the world and in Americans 20–74 years old [2, 3]. DR is the primary retinal vasculature complication of Diabetes Mellitus (DM). The disease can be separated into non-proliferative DR (NPDR) and PDR. NPDR is characterized by microaneurysms, superficial and deep retinal hemorrhages, venous dilation, and cotton wool spots which are remnants of focal retinal nerve fiber layer ischemia. PDR begins with the angiogenesis of new blood vessels at the inner surface of the retina. These vessels are fragile and prone to rupture and leakage, leading to vitreous hemorrhage, fibrosis, scarring, and subsequent increased risk of tractional retinal detachments. Diabetic macular edema (DME), or leakage of intraretinal or subretinal fluid in the macula, is the most common cause of vision loss in patients with diabetes [4]. DME is caused by chronic hyperglycemia leading to subsequent damage to the vascular endothelium.
In the United States, approximately 11% (25.6 million) of people aged 20–74 years old have either been diagnosed or remain undiagnosed with diabetes [5]. The prevalence of DR in all adults over the age of 40-years-old in the United States is nearly 30%. By 2050, DR is expected to impact over 16 million people [6]. According to data from the Centers for Disease Control, 5 million patients have DR without DME, while an additional 8 × 10⁵ have DR with DME. Globally, the number of individuals affected by DR is expected to increase from 171 million in 2 × 10⁵ to 366 million in 2030 [7].
Racial and ethnic minorities are disproportionately affected by DR and are 2–3 times more likely to develop significant visual complications from diabetes [8]. However, these complications, including blindness, are preventable with early detection and treatment. African Americans had a 4-fold risk of visual loss compared to Whites in the Salisbury Eye Evaluation. The study also found that DR causes 17% of visual loss in African Americans as compared to 8% in non-Hispanic Whites [9–11]. The African American Eye Disease Study (AFEDS), a cross-sectional study of over 6 × 10³ African Americans in Inglewood, California, showed that these patients were at an increased risk of DR at presentation with 5.3% of participants having PDR and 7% having DME [12]. Although prevalence studies that focus on Native Americans are limited, existing estimates of DR prevalence in these populations have been reported as high as 45.3% [11, 13].
As of 2021, the proportion of the Latino/Hispanic population within the United States increased further to 18.9% [1], comprising the largest ethnic or racial minority group in the United States. The Los Angeles Latino Eye Study (LALES) investigated over 6 × 10³ Latino individuals over the age of 40 for risk factors for eye disease. The researchers found that one in five patients with diabetes was newly diagnosed during screening, with 25% percent already showing signs of retinopathy at their first exam. Latinos developed visual impairment and blindness at the highest rate of any ethnic group in the country, when compared with estimates from other United States population-based studies. Nearly 3% of Latinos developed visual impairment and 0.3% developed blindness in both eyes, with older individuals affected at a greater magnitude. Age was shown to be a risk factor of poorer prognosis. Of Latinos 80-years-old or higher, 19.4% became visually impaired and 3.8% became blind in both eyes [14]. Proyecto VER (Vision Evaluation and Research) also highlights these racial health disparities in DR. Researchers studied over 4 × 10³ Hispanic adults over the age of 40 living in Arizona and found a prevalence rate in this community of 48%, similar to the 46.9% prevalence rate seen in LALES and almost twice that of Caucasians in the study. Of the patients newly diagnosed with DM, 23% were identified as having some DR present and 9% were noted to have moderate to severe DR [14, 15].
Glaucoma is a group of chronic, progressive diseases characterized by atrophy of the optic nerve and subsequent vision loss. It is one of the leading causes of irreversible blindness worldwide [16]. There are two major types of glaucoma: primary and secondary. Both major groups can then be subdivided into two categories according to the underlying anatomy and pathophysiology: open-angle and angle-closure. The most common form, primary open angle glaucoma (POAG), is associated with increased intraocular pressure and resulting retinal ganglion cell degeneration and subsequent visual field defects.
Glaucoma has an estimated global prevalence of 57.5 million individuals and is projected to affect over 111.8 million people worldwide by 2040 [16, 17]. In the United States, POAG affected nearly 2.2 million Americans in 2004, with the prevalence increasing to over 3 million in 2020. This increasing prevalence rate and disease progression resulted in vision impairment for over 1.2 × 10⁵ individuals [18]. With an aging population, this number is expected to increase to over 3.36 million affected by POAG by 2030 [19].
According to the National Eye Institute, the prevalence rates of glaucoma indicate that the chronic disease is twice as prevalent in Black individuals over the age of 40-years-old. The Baltimore Eye Survey revealed that POAG is 6.6 to 6.8 times more prevalent among African Americans than Caucasians in some age groups. An additional finding from the survey found that African Americans were also afflicted by the disease at an earlier onset almost ten years earlier than Caucasians [20]. Furthermore, the LALES reported a prevalence rate of almost 5% among Latinos [14]. Additionally, although limited, estimated prevalence rates within the Native American/American Indian and Alaska Native (AIAN) populations ranged from 2.5% [21] to 6.2% [22].
Cataracts are a clouding of the lens in the eye, which is a significant cause of reversible blindness and visual impairment worldwide. Cataracts are the leading cause of blindness in both middle and low-resourced countries and are also a leading cause of low vision among adults over the age of 40-years-old in the United States [23]. Ocular symptoms of cataracts include double vision, halos in vision, light sensitivity, blurred vision, the need for additional light when reading, and frequent changes in prescription for contact lenses or glasses.
Cataracts are estimated to affect over 24 million Americans over the age of 40-years-old. By age 75, nearly half of all Americans have cataracts [24]. There is a clear association between cataract prevalence and age with prevalence rates increasing from 3.9% among 55–64 years to 92.6% among those 80 years and older [25]. Globally, cataracts caused blindness in 10.8 million people in 2010. By 2025, this prevalence is estimated to increase to over 40 million people due to the aging demographic [26, 27]. Epidemiological risk factors include age, gender, living in low-resourced areas, educational status, lower socioeconomic status, smoking status, and environmental factors such as increased sunlight exposure. The increasing global prevalence has also been associated with higher cataract burden in those of older age, female gender, and lower socioeconomic status [28].
With the increasing national and global burden of these diseases, it remains essential to conduct localized analyses to identify community-specific problems and burdens. As a result, this study will focus on prevalence rates of cataracts, glaucoma, and DR in addition to health and economic statistics for Erie and Monroe County. These results will be compared to New York State and national metrics to help identify disparities unique to each county, which may help guide future policy to create more equitable vision of healthcare in Western New York. Upon review of these prevalence rates and eye care utilization rates, public health interventions, health care access, and screening efforts should be reevaluated to improve quality of care for all populations, particularly for those at the highest risk of poor visual outcomes. In addition, an in-depth assessment of these counties may offer insight into the care of the country at large since the populations reflect the increasingly diverse and aging demographics of the United States.
This study was conducted using data from the Vision and Eye Health Surveillance System (VEHSS), which is a program developed by the Center for Disease Control Vision Health Initiative. The VEHSS compiles national, state, and county level data from multiple sources into a singular database, highlighting the burden of vision loss, ophthalmic eye disease prevalence, and available eye care services in the United States. VEHSS data is sourced from national surveys, administrative claims records, electronic health records, population-based studies, and other sources of public information. VEHSS was also chosen as the primary data source due to inclusion of variables such as race, age, gender, and insurance coverage.
With these estimates, statistical models integrate information across multiple data sources to create comprehensive estimates of the prevalence of the selected eye disease and service utilization. Of those sources, crude disease prevalence is reported by the American Academy of Ophthalmology Intelligent Research in Sight (IRIS) registry, which offers large scale clinical data sampled from a majority of United States ophthalmology practices. This data is then transparently displayed to the final VEHSS system.
Secondary data or “Descriptive Analyses” was collected from multiple publicly available resources. Data from the United States Census Bureau, the United States Department of Agriculture and Economic Research Service, United for ALICE (Asset Limited, Income Constrained, Employed), and the American Community Survey were used to construct a demographic profile of the counties of interest. Additional data about availability of healthcare providers is derived from the Health Resources and Services Administration and New York State Education Department.
The outcome variable for this study was the prevalence of the eye disease of interest (DR, glaucoma, cataracts). Potential risk covariates were then identified based on previously published literature and their availability through the VEHSS at the county level. In this study, the risk covariates included geographic region and race/ethnicity, which were categorized according to the predefined parameters of the VEHSS. Since the VEHSS database provides disease data based on Medicare claims, other potential risk covariates such as commercial medical insurance or Medicaid were not included, which was a limitation of the VEHSS database. In addition, disease prevalence and cataract surgery data were included in the analyses from 2014–2019, while data pertaining to disease prevalences based on race from the IRIS registry were assessed from 2016–2019 due to data availability.
Additional risk covariates that were considered for inclusion were the median household income by county, prevalence of persons in poverty, rate of income inequality, level of education completion, number of medical providers by county, and prevalence of uninsured persons per county. However, these ultimately could not be included in the data analysis as they were not variables included in the VEHSS system which defined the prevalence of the eye disease of interest. The potential risk covariates were nevertheless considered to be relevant and subsequently assessed through literature reviews and publicly available databases.
All statistical analyses were performed with GraphPad Prism version 10.0.3 for Mac (GraphPad Software, Boston, Massachusetts United States, https://www.graphpad.com/). Secondary data that compared more than two groups utilized either a one-way ANOVA or two-way ANOVA followed by Tukey’s or Sidak’s correction for multiple comparisons. Bartlett’s test and Brown-Forsythe’s test were used to assess variances across groups in our ANOVAs. Secondary data from two groups were analyzed with two-tailed unpaired t-tests and were checked for normality using the D’Agostino-Pearson omnibus test (K2). An F-test was used to compare variances across groups in t-tests. Where appropriate, data are presented as mean ± standard error. Data are also shown as mean ± standard deviation or mean ± upper/lower confidence limits. Standard deviation was calculated based on the sample size (n) and confidence intervals retrieved from the VEHSS database.
The final analysis determined disease prevalence in New York State, Erie County, Monroe County, and at the national level separately. In 2022, New York State had a population of 19,677,151 individuals with a population density as of 2020 at 428.7 persons per square mile. In contrast, Erie and Monroe County had populations of 950,312 and 752,035, respectively. The population density in Erie County was determined to be 915.1 while that of Monroe County was 1,156 persons per square mile (Table 1). New York State and Western New York racial and ethnic demographics and life expectancy based on race are shown in Tables 2 and 3. Data for economic and educational metrics are seen in Tables 4 and 5. Moreover, Erie County faces a greater primary care physician (PCP) shortage with 1 PCP per 1,250 individuals compared to Monroe County, which has 1 PCP for 910 individuals (Table 6). Monroe County had a slightly higher prevalence of people without health insurance at 10.8% compared to Erie County at 9.7% (Table 7).
New York State and Western New York population in 2022
| Location | Population (as of July 1, 2022) | Population per square mile (as of 2020) |
|---|---|---|
| NYS | 19,677,151 | 428.7 |
| Erie | 950,312 | 915.1 |
| Monroe | 752,035 | 1,156 |
Source: United States Census Bureau [1]. NYS: New York State
New York State and Western New York racial and ethnic demographics
| Location | AIAN | Asian | Black | Hispanic | White (not Hispanic or Latino) | Segregation index |
|---|---|---|---|---|---|---|
| NYS | 1.0% | 9.3% | 17.6% | 19.5% | 54.7% | 74 |
| Erie | 0.8% | 4.3% | 13.8% | 6.0% | 74.4% | 72 |
| Monroe | 0.5% | 3.7% | 16.1% | 9.6% | 69.8% | 64 |
Segregation index: New York had a segregation index of 74 for Black and white residents. This index can range from 0 to 100, with lower values representing less residential segregation and a value of 100 representing complete segregation. The 2023 County Health Rankings used data from 2015–2019 for this measure. AIAN: American Indian and Alaska Native; NYS: New York State
New York State and Western New York life expectancy by racial breakdown
| Location | Life expectancy | AIAN | Asian | Black | Hispanic | White |
|---|---|---|---|---|---|---|
| NYS | 80.3 | - | - | - | - | - |
| Erie | 78 | 74.3 | 87.6 | 72.4 | 79 | 78.9 |
| Monroe | 79.3 | 90.4 | 87.7 | 73 | 79.9 | 80.5 |
Source: University of Wisconsin Population Health Institute. County Health Rankings & Roadmaps 2023. -: no data. AIAN: American Indian and Alaska Native; NYS: New York State. https://www.countyhealthrankings.org/
New York State and Western New York median household income, income inequality, and persons in poverty
| Location | Median household income | Persons in poverty | Income inequality |
|---|---|---|---|
| NYS | $ 75,157 | 13.9% | 5.8 |
| Erie | $ 62,578 | 13.7% | 4.9 |
| Monroe | $ 66,317 | 13.3% | 4.9 |
Income inequality: in New York, households with higher incomes had incomes 5.8 times that of households with lower incomes. This inequality ranged from 3.9 to 9.3 times across counties in the state. The 2023 County Health Rankings used data from 2017–2021 for this measure. NYS: New York State
New York State and Western New York education completion (2017–2021)
| Location | Not completing high school | Completing high school only | Completing some college | Completing college |
|---|---|---|---|---|
| NYS | 12.6% | 25.2% | 24.1% | 38.1% |
| Erie | 7.9% | 26.2% | 30.0% | 35.9% |
| Monroe | 8.9% | 23.1% | 28.1% | 40.0% |
Source: Data retrieved from https://ers.usda.gov/data-products, United States Department of Agriculture, Economic Research Service. NYS: New York State
New York and Western New York, medical providers
| Location | Primary care physicians | Optometrists | Ophthalmologists (except pediatric) |
|---|---|---|---|
| NYS | 1 per 1,170 persons | 2,976 | 1,100 |
| Erie | 734 or 1 per 1,250 persons | 155 | 250 |
| Monroe | 815 or 1 per 910 persons | 134 | 30 |
Source: University of Wisconsin Population Health Institute. County Health Rankings & Roadmaps 2023. https://www.countyhealthrankings.org/. NYS: New York State
New York and Western New York, persons without health insurance
| Location | Persons without health insurance, under age of 65 years |
|---|---|
| NYS | 7.7% |
| Erie | 9.7% |
| Monroe | 10.8% |
Source: University of Wisconsin Population Health Institute. County Health Rankings & Roadmaps 2023. https://www.countyhealthrankings.org/. NYS: New York State
Analyses of variance were calculated to show the effects of the covariates, or independent variables, on disease prevalence. These covariates included geographic region, gender, race/ethnicity, and Medicare coverage. With the variability of the differences in population characteristics between the geographic regions of New York, these covariates could allow insight into what factors were associated with the diversity and trends of disease burden in specific regions. Many of these were significantly associated with disease burden and labeled as risk factors, while others were shown to have no significant association with the disease of interest.
Potential risk covariates included in the analysis and additional relevant variables that were examined through the initial literature review and publicly available data were all assessed in comparison to the disease of interest. These additional relevant variables include the number of physicians, median household income, and level of education completion from 2017–2021 (Tables 4, 5, and 6). However, as these are not included in the VEHSS system or IRIS registry, which defines the prevalence of disease, these were not included in the final data analysis.
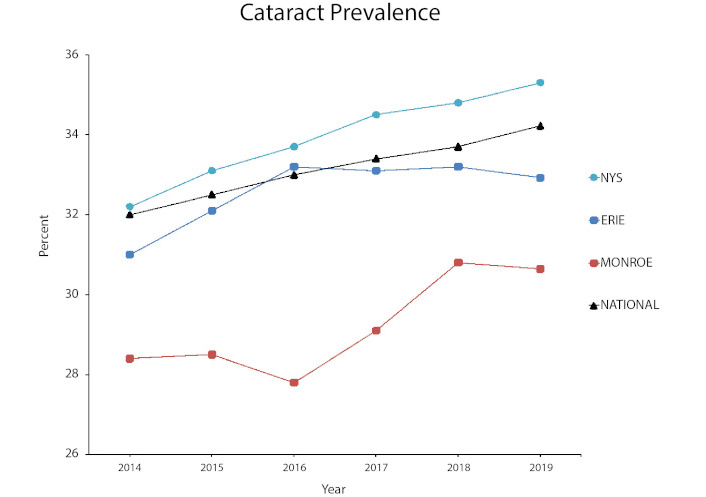
In our examination of cataract prevalence (assessed through Medicare data), a statistically significant interaction was observed, highlighting the joint impact of geographical location and calendar year on prevalence [F (15, 190266376) = 12.80, p < 0.0001]. Despite Monroe County having a significantly lower overall rate of cataract prevalence, there is a temporal increase in the percentage of individuals developing cataracts (Figure 1).
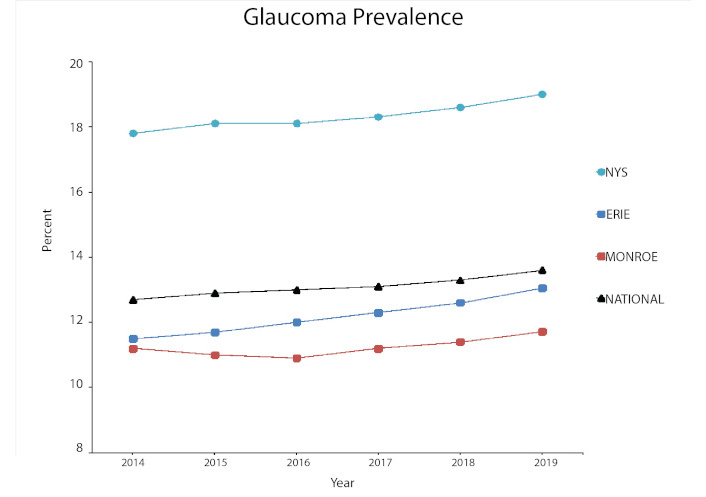
A statistically significant interaction was also observed during the analysis of glaucoma prevalence (assessed through Medicare data), revealing the effect of both geographical location and calendar year on prevalence [F (15, 190266376) = 2.867, p < 0.001]. Both Erie and Monroe County were found to have significantly lower overall rates of glaucoma prevalence when compared to the overall average of New York State (Figure 2).
In our evaluation of diabetic eye disease prevalence (assessed through Medicare data), a statistically significant interaction was once again observed between the impact of geographical location and calendar year on prevalence [F (15, 190266376) = 14.92, p < 0.0001]. Though there is a temporal decrease in prevalence amongst all groups, New York State has a significantly higher prevalence than the national average (Figure 3).
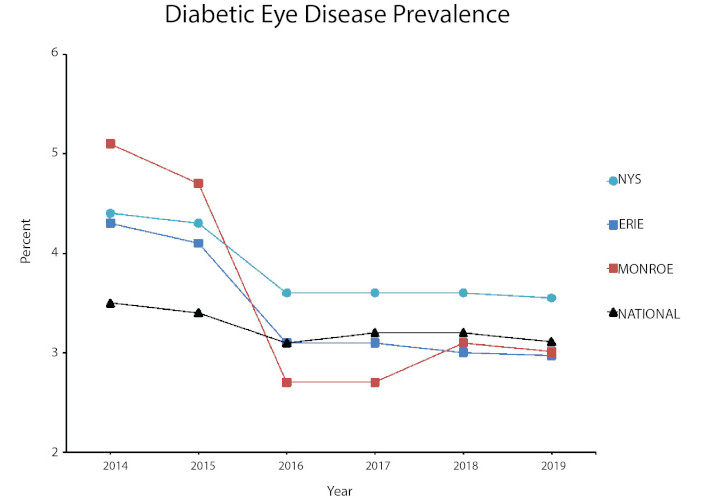
Diabetic eye disease prevalence in New York compared to national metrics. NYS: New York State
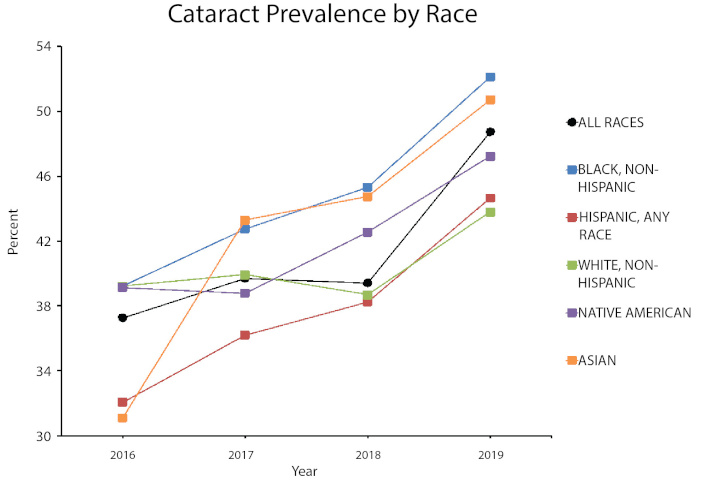
In our examination of cataract prevalence by race (assessed through IRIS registry state-wide data), there was no statistically significant interaction observed between self-identified race/ethnicity and year [F (5, 18) = 0.7651, p = 0.587]. Though there was no statistically significant outcome, there was an increase in the percentage of individuals with cataract disease over time (Figure 4).
For glaucoma prevalence by race (assessed through IRIS registry state-wide data), a statistically significant interaction was observed, highlighting the interaction of self-identified race/ethnicity with calendar year [F (5, 18) = 11.89, p < 0.0001]. Further, Black, non-Hispanics have significantly higher rates of prevalence than any other race in New York State (Figure 5).
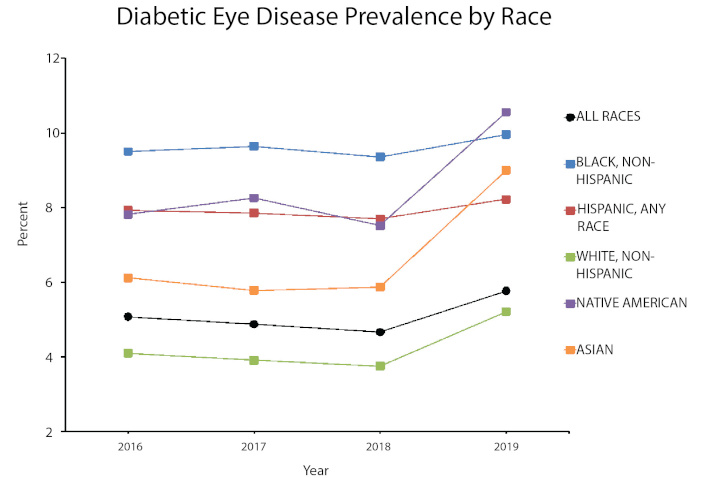
In our analysis of diabetic eye disease prevalence by race (assessed through IRIS registry state-wide data), a statistically significant interaction was observed, revealing the joint impact of self-identified race/ethnicity and calendar year [F (5, 18) = 36.75, p < 0.0001]. Individuals identifying as Native American, Black, non-Hispanic, Asian, and Hispanic, any race have significantly higher disease burden in New York State (Figure 6).
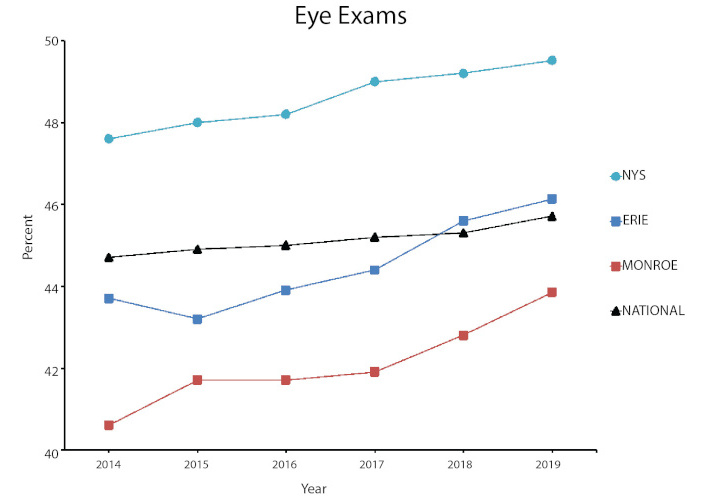
A statistically significant interaction was observed in the utilization of eye exams assessed through Medicare data, highlighting the dual impact of geographical location and calendar year [F (15, 190266376) = 18.85, p < 0.0001]. Both Erie and Monroe County have significantly lower overall rates of eye exams when compared to the overall average of New York State (Figure 7).
In our analysis of cataract surgery (assessed through Medicare data), a statistically significant interaction was measured, highlighting the joint impact of geographical location and calendar year [F (20, 67178570) = 4.854, p < 0.0001]. Although Erie and Monroe County have similar rates to New York State, the percentages of cataract surgery in these areas are significantly lower than both the national rate and high-volume states such as Florida (Figure 8).
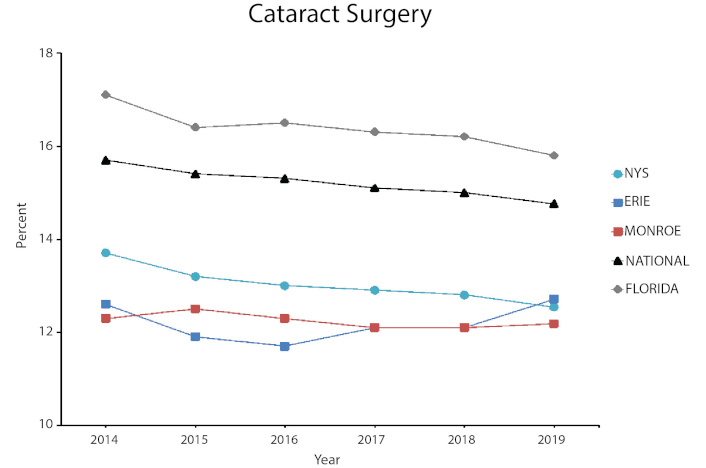
Rates of cataract surgery in New York, Florida, and the United States. NYS: New York State
The incidence of cataracts is on an upward trajectory, as illustrated in Figure 1. Given the escalating median age of our population, this pattern is anticipated to persist. By 2025, projections indicate that over 40 million individuals will be affected by cataracts due to the aging demographic. Consequently, healthcare professionals must be equipped to assess, diagnose, and provide surgical solutions to prevent visual impairment and vision loss. Interestingly, while New York State demonstrates higher cataract prevalence rates compared to the national average, its rate of cataract surgeries remains below the national average. This disparity is mirrored in our local regions of Erie and Monroe County. Despite the absence of significant racial or ethnic disparities in cataract prevalence within these counties, the mounting challenge posed by an aging demographic suggests that the existing ophthalmology workforce might face constraints in addressing this surge effectively (Table 6) [29]. Moreover, the lack of meaningful increase in residency programs for all medical specialties, including ophthalmology, will exacerbate the current burden of lack of primary and specialist care.
While glaucoma prevalence rates in New York State surpass the national average, the rate of increase is slower than that seen in cataract disease. However, upon further inspection of glaucoma prevalence in Western New York, there is a concerning picture of potential gaps and underutilization in eye care services. Specifically, both Erie and Monroe County consistently report lower rates of glaucoma prevalence when compared with the broader New York State averages. Such findings raise concerns for possible underdiagnosis or limited accessibility to essential eye care services within these specific regions. Our data on eye care services, specifically eye exams, further supports this notion. Although New York State surpasses the national average of percentage of eye exams, both Erie and Monroe County fall significantly below the state’s average. This reduced utilization of routine eye examinations could contribute to the underdiagnosis of ocular pathology and subsequent lower prevalence rates found in our analysis. This concern is further compounded by the disproportionate disease burden faced by certain racial and ethnic groups in New York State. Notably, Black, non-Hispanic populations in New York State experience significantly higher rates of glaucoma prevalence compared to their counterparts from other racial backgrounds. This disparity highlights potential systemic challenges that are prevalent throughout the United States such as lack of healthcare access, transportation, and resources that may be inhibiting these communities from accessing timely and essential eye care.
In our comprehensive analysis of diabetic eye disease within Western New York, disparities in eye care reaffirmed the urgency for rethinking access and delivery to eye care. In our examination of prevalence of diabetic eye disease, the overall New York State prevalence was significantly higher than the national average. Again, as with cataract and glaucoma prevalence, both Erie and Monroe County exhibited lower disease prevalence rates when compared to the state average. This concerning trend is further complicated by the racial and ethnic disparities revealed in our analysis. Specifically, Native American, Black, non-Hispanic, Asian, and Hispanic individuals in New York State shoulder a disproportionately higher burden of diabetic eye disease.
Such significant differences in eye disease prevalence alongside racial and ethnic disparities suggest intricate intersections of race, ethnicity, and systemic factors that amplify the disease’s impact on our local communities. Furthermore, consistently lower rates of eye care utilization in both Erie and Monroe County when compared to New York State’s broader averages signal potential barriers to early detection and intervention in these regions. Addressing these disparities demands a multifaceted approach such as integrating enhanced screening initiatives, increasing emphasis on preventative care, promoting education and community outreach, and tailoring interventions to mitigate the profound impact of eye disease on vulnerable populations.
Minority and disadvantaged populations face higher susceptibility to developing DR, glaucoma, and cataract disease, leading to poorer visual health outcomes. Oftentimes, disadvantaged populations lack the access and resources to attend regular eye exams, resulting in individuals presenting with more severe stages of these diseases and worse outcomes.
This vulnerability is further increased by inadequate screening in these high-risk groups. Less than half of all United States adults adhere to guideline-recommended eye screenings, with racial and ethnic minorities being screened less often than white patients [30, 31]. Evidence regarding the importance of timely detection and screening for PDR and DME was shown years ago in the DR Study and the Early Treatment of Diabetic Study [32, 33]. However, delayed diagnosis still remains a concern among Black and Hispanic patients with diabetes, who are more likely to present at advanced stages of DR, which may lead to poorer visual outcomes [8].
For instance, Hispanic and Latino Americans have higher risks of clinically significant macular edema (CSME) [34], with prevalence in the Beaver Dam Eye Study being twice as high as that of the White population [35–37]. The Veterans Affairs Diabetes Trial yielded similar results, with 15.6% of African Americans having CSME compared to 6.3% of non-Hispanic Whites [38]. The underlying causes of these disparities remain complex with studies pointing to differences in pathogenesis, genetic susceptibility to CSME, and also delayed detection and screening.
Individuals with lower education and those who lack insurance are less likely to undergo screening. In fact, those without health insurance are twice as likely to have not seen a doctor in the previous year [9, 39]. Despite recommendations for routine annual dilated exams, only 33–68% of individuals of adults with diabetes follow-up for their yearly exams, and these screening rates are even lower in Blacks and Latinos [40].
Hence it is critical to address the barriers to eye screening and eye care utilization faced by minority populations, including disparities in access, education, and awareness in order to improve visual health outcomes and reduce the burden of ocular disease in our communities of color.
Insufficient patient education by healthcare providers poses a significant barrier to the utilization of eye care services [41, 42]. Patient education is particularly important in chronic disease management. For instance, diabetic patients with a longer duration of disease are more likely to develop DR. The rate of development of DR in a patient with no previous retinopathy on exam one year prior is reported to be between 5 and 10%. However, studies such as LALES and Proyecto VER have shown that 18% of Hispanic patients with diabetes lasting over 15 years developed PDR [14, 15].
In addition to the duration of diabetes, there are several modifiable risk factors that should be closely monitored by the primary care team, such as hyperglycemia, hyperlipidemia, hypertension, and higher total serum cholesterol levels. Regular monitoring of hemoglobin A1c (HbA1c) and blood pressure readings is essential in managing these associated comorbidities [43–46]. This highlights the importance of interprofessional collaboration and the role of primary care providers in screening for eye disease [47]. An initial strategy to improve follow-up and strengthen the physician-patient relationship is to enhance cultural competency among providers. Cultural competency can help increase understanding and respect for other cultures, races, and languages to deliver the best care for all individuals. This initiative may help create a more inclusive healthcare environment, which can address racial disparities and increase the number of ethnic minority patients who are screened [48, 49].
Educating primary care providers on screening guidelines for DR may indirectly contribute to patient education and health literacy [50]. By raising awareness among both patients and primary care providers, the significance of regular screenings for chronic eye disease can be emphasized, ultimately leading to improved eye care utilization and better eye care outcomes.
Public health structures play a crucial role in addressing health disparities and improving access to eye care services. These structures can be leveraged to implement interventions and policies that address the specific needs of marginalized populations. One approach to target high risk groups with lower rates of follow-up is to integrate eye care services into existing public health programs. This can involve collaborations between eye care professionals, primary care providers, medical schools, and public health agencies to establish comprehensive screening programs and referral systems [51]. By incorporating eye screenings into routine health check-ups, especially for high-risk populations, we can look to increase detection and timely intervention for ocular diseases.
Other initiatives such as mobile clinics and telehealth initiatives can be utilized to overcome geographical and logistical barriers. These outreach initiatives may better serve individuals in remote areas and those with limited physical mobility or lack of transportation [52]. Additional interventions may include the development of targeted education campaigns, which can focus on raising health literacy in vulnerable communities [53]. Subject matter may include the importance of regular eye exams, dispelling common misconceptions surrounding eye health, and the promotion of culturally sensitive health literacy materials [54]. Increasing eye care knowledge may empower individuals to prioritize their eye health, leading to improved long term outcomes for communities. Through education and prevention, poor prognoses of chronic preventable eye disease in high-risk groups (regardless of geographic region) may begin to change.
The global population is projected to increase significantly from 7.3 billion in 2015 to 9.7 billion by 2050, with a larger proportion of older individuals by 2050. Within the last decade, the United States population has also increased in size, age, and diversity. Within New York State and Western New York, the growing diversity of the population has highlighted the long-standing disparities in access to eye care and subsequent poor visual outcomes in minority populations. As the risk of eye conditions and prevalence of visual impairment rises with age, it is crucial to address the growing burden of ocular diseases [55]. Given the demographic shifts, the prevalence of ocular diseases is evident and will continue to rise and disproportionately affect minority communities unless proactive measures are taken.
To address racial health disparities in ocular diseases such as DR, glaucoma, and cataracts, it is crucial to increase awareness, promote screening, and provide support and encouragement. Additionally, conducting research on disease prevalence, especially in growing and diverse communities, while considering the social determinants of health model and modifiable risk factors is essential for guiding public health education and interventions to improve clinical management of ocular diseases. To further reduce disparities, research efforts should continue to concentrate on identifying and addressing specific factors that hinder access to eye care services. It is equally important to develop and implement strategies that enhance the overall health literacy of these communities at high risk. By increasing health literacy, individuals will gain skills necessary to recognize the importance of regular eye exams and may be more likely to seek care when needed.
Population-based studies that incorporate both individual and environmental data can help further investigate the impact of race and ethnicity on the prevalence of ocular diseases. Ensuring access to healthcare services and implementing public health policies that prioritize adequate care are fundamental in preventing blindness in our patients.
CSME: clinically significant macular edema
DME: diabetic macular edema
DR: diabetic retinopathy
IRIS: Intelligent Research in Sight
LALES: Los Angeles Latino Eye Study
NPDR: non-proliferative diabetic retinopathy
PCP: primary care physician
PDR: proliferative diabetic retinopathy
POAG: primary open angle glaucoma
VEHSS: Vision and Eye Health Surveillance System
VER: Vision Evaluation and Research
AJM: Investigation, Data curation, Writing—original draft, Writing—review & editing. TS: Formal analysis, Validation, Writing—review & editing. DP: Conceptualization, Formal analysis, Resources. AV: Writing—review & editing, Validation. MD: Formal analysis, Writing—review & editing. KA: Conceptualization, Investigation, Writing—review & editing, Project administration, Resources, Supervision. All authors read and approved the submitted version.
Margaret DeAngelis who is the Associate Editor of Exploration of Medicine had no involvement in the decision-making or the review process of this manuscript. The other authors declare that there are no conflicts of interest.
Not applicable.
Not applicable.
Not applicable.
Publicly available datasets from Vision and Eye Health Surveillance System (VEHSS), United States Census Bureau, University of Wisconsin Population Health Institute, the United States Department of Agriculture, and Economic Research Service.
Not applicable.
© The Author(s) 2025.
Open Exploration maintains a neutral stance on jurisdictional claims in published institutional affiliations and maps. All opinions expressed in this article are the personal views of the author(s) and do not represent the stance of the editorial team or the publisher.
Copyright: © The Author(s) 2025. This is an Open Access article licensed under a Creative Commons Attribution 4.0 International License (https://creativecommons.org/licenses/by/4.0/), which permits unrestricted use, sharing, adaptation, distribution and reproduction in any medium or format, for any purpose, even commercially, as long as you give appropriate credit to the original author(s) and the source, provide a link to the Creative Commons license, and indicate if changes were made.

View: 2654
Download: 22
Times Cited: 0