 Original Article

Affiliation:
1Dipartimento di Chimica, Università degli Studi di Bari Aldo Moro, Campus Universitario, Via E. Orabona 4, 70126 Bari, Italy
2Current address: S.C.A. Servizi Chimici Ambientali s.r.l. Via Francesco Franco, BR 72023 Mesagne, Italy
Affiliation:
1Dipartimento di Chimica, Università degli Studi di Bari Aldo Moro, Campus Universitario, Via E. Orabona 4, 70126 Bari, Italy
3Centro interdipartimentale S.M.A.R.T., Università degli Studi di Bari Aldo Moro, Campus Universitario, Via E. Orabona, 4, 70126 Bari, Italy
Email: cosimadamiana.calvano@uniba.it
ORCID: http://orcid.org/0000-0001-8832-7072
Affiliation:
1Dipartimento di Chimica, Università degli Studi di Bari Aldo Moro, Campus Universitario, Via E. Orabona 4, 70126 Bari, Italy
3Centro interdipartimentale S.M.A.R.T., Università degli Studi di Bari Aldo Moro, Campus Universitario, Via E. Orabona, 4, 70126 Bari, Italy
Affiliation:
1Dipartimento di Chimica, Università degli Studi di Bari Aldo Moro, Campus Universitario, Via E. Orabona 4, 70126 Bari, Italy
Affiliation:
1Dipartimento di Chimica, Università degli Studi di Bari Aldo Moro, Campus Universitario, Via E. Orabona 4, 70126 Bari, Italy
3Centro interdipartimentale S.M.A.R.T., Università degli Studi di Bari Aldo Moro, Campus Universitario, Via E. Orabona, 4, 70126 Bari, Italy
Affiliation:
1Dipartimento di Chimica, Università degli Studi di Bari Aldo Moro, Campus Universitario, Via E. Orabona 4, 70126 Bari, Italy
3Centro interdipartimentale S.M.A.R.T., Università degli Studi di Bari Aldo Moro, Campus Universitario, Via E. Orabona, 4, 70126 Bari, Italy
Email: tommaso.cataldi@uniba.it
Explor Foods Foodomics. 2023;1:83–100 DOI: https://doi.org/10.37349/eff.2023.00008
Received: April 06, 2023 Accepted: June 09, 2023 Published: June 30, 2023
Academic Editor: Jose Antonio Mendiola, Institute of Food Science Research (CIAL-CSIC), Spain
Aim: This study aims to develop sensitive and reliable analytical technologies to enable the distinction between wild-caught and farmed fish through appropriate molecular markers to protect consumers from fraudulent fish labelling. Gilthead sea bream, Sparus aurata L. (S. aurata L.), is a very common fish used as foodstuff worldwide and globally produced in aquaculture in the Mediterranean basin. Wild-caught and farmed species are very different in feed and lifestyle and the quality and safety of these products strongly depend on fish growth, processing history, and storage conditions.
Methods: Hydrophilic interaction liquid chromatography (HILIC) coupled with electrospray ionization (ESI) and Fourier-transform mass spectrometry (FTMS; HILIC-ESI-FTMS) was employed to discriminate the phospholipidome profiles of fillets extracts of wild-caught from farmed gilthead sea breams.
Results: The untargeted approach led to the annotation of a total of 216 phospholipids (PLs), namely 65 phosphatidylethanolamines (PEs), 27 lyso-PEs (LPEs), 61 phosphatidylcholines (PCs), 34 lyso-PCs (LPCs), and 29 sphingomyelins (SMs). Untargeted lipidomics data were investigated by principal component analysis (PCA) and K-means clustering. Lyso-PLs (LPLs) of PEs and PCs including ether-linked side chains were found as discriminating markers between the two types of fish samples. The PLs that were most responsible for distinguishing between the lipid extracts of farmed and wild S. aurata fillets were successfully characterized by tandem mass spectrometry (MS/MS). The analysis revealed that wild fillet lipid extracts contained some PE exhibiting ether bonds (PE P-), viz. 16:0, 18:0, 18:1, and 18:2 and polyunsaturated fatty acyl chains (i.e., 22:6 and 22:5). In farmed species, the estimated abundance ratios of fatty acyl chains 20:4/18:2 and 22:6/20:5 were 0.9 and 0.05, respectively. However, in wild-caught fish, these ratios were found to be two-fold higher and four-fold higher, respectively.
Conclusions: This work demonstrates that the combination of HILIC-ESI-FTMS and chemometrics can serve as a valuable tool for evaluating fish authenticity and assessing quality concerns by monitoring specific lipid ratios.
Gilthead sea bream [Sparus aurata (S. aurata)] is a highly valued commercial fish in the Mediterranean fishery with significant production for human consumption from capture-based aquaculture [1, 2]. In the last thirty years, the global aquaculture production of S. aurata has increased exponentially with Turkey (50%) being the largest producer followed by Greece (28%), Tunisia (7%), and Croatia (4%) [3]. Artificial breeding of gilthead sea bream was introduced in Italy in the early 1980s, which led to large-scale production in the Mediterranean basin within the decade. This was possible due to the species’ high adaptability to intensive rearing conditions, both in ponds and cages. In the wild, sea bream is mainly a carnivorous fish, consuming a variety of prey, with crustaceans, molluscs, polychaetes, teleosts, and echinoderms as the major dietary groups, but may also eat benthic plants [4]. As with other fish, the nutrition of aquaculture sea bream relies on specially formulated feedstuffs containing fish oil, crude fibre, like soybean, carbohydrates from various seeds, protein supplements from animal sources, as well as vitamins, minerals, and additives such as antibiotics, colouring materials, flavours, and hormones. As a result, wild and farmed sea breams differ significantly in their diet and lifestyle, as well as in their selling price. Unfortunately, incorrect labeling of farmed fish, considered less healthy and environmentally sustainable, and wild fish, which can undermine the guarantee of fish quality for consumers, has been reported in the markets [5]. Several studies compared wild and farmed S. aurata, their modification with growth variables such as feed, salinity, etc., based on the proximate analysis of constituents, viz. proteins, fats, and ash [6], or on their fatty acid (FA) profile [7–11]. Compared to farmed species, wild S. aurata exhibits lower lipids and higher water content. Furthermore, how FAs are incorporated and stored in sea breams, as well as in other fish, is heavily influenced by their dietary history, showing strong seasonal and spatial variations. Previous studies have looked at different ways of distinguishing between farmed and wild S. aurata [8, 11, 12]. Despite this, there are only a few reliable and robust methods to distinguish farmed from wild fish to combat mislabelling, which are based on proteomics or fatty acidomics [12–14] while no studies were focused on phospholipids (PLs). PLs are abundant in fish muscles and can be used as potential molecular markers of fish status, being influenced by factors such as feed, water temperature, and salinity. Indeed, changes in their lipid composition occur when cellular membranes need to adapt to new environmental conditions [15, 16]. Fishes living in colder temperatures (5°–10°C) accumulate higher amounts of polyunsaturated FAs (PUFAs) compared to those living in warmer waters (25°–27°C). Furthermore, there appears to be an accumulation of oleic acid in phosphatidylethanolamines (PEs) in cold-adapted fish [17]. Analysing PLs instead of just FAs provides additional information useful for understanding the organism under investigation. For instance, comparing the PL profile of fish stored under different conditions can reveal not only the final effects of the storage process, such as the hydrolysis of FAs from lipids but also the extent to which different fish species are affected. A recent study [18] demonstrated that analysing the total FA profile alone was not sufficient to distinguish between different types of shellfish. When combined with PL data, it was possible to classify them into different fish genera or groups.
Shotgun lipidomics strategies have been used to study the composition of PLs in fisheries waste and in the muscles of Ctenopharyngodon idellus (grass carp) [19], thus assessing its variation with storage over time [20]. While this approach may be faster than a chromatographic method, it may not be able to provide a detailed representation of a PL class composition in complex mixtures. This is because there can be competition for ionization and ambiguities in assignments of isobaric and isomeric PL species.
Hydrophilic interaction liquid chromatography (HILIC) coupled with electrospray ionization (ESI) and tandem mass spectrometry (MS/MS; ESI-MS/MS) has been recently applied for profiling PLs and their lyso forms in food products of different origins, like sea breams and mussels [21–23], lupin seeds [24], and strawberries pulp and seeds [25]. The use of HILIC in combination with mass spectrometric detection based on the Fourier-transform (FT) Orbitrap analyser can provide a separation of PL classes, which eliminates inter-class co-elution issues and decreases ionization competition, suppression, and ambiguities in the identification of isomeric co-eluting lipids. Untargeted lipidomics by HILIC-ESI and Fourier-transform mass spectrometry (FTMS; HILIC-ESI-FTMS) allowed the characterization of PLs in lipid extracts obtained from farmed and wild sea breams with high resolution and accuracy. Collected data of PLs from fillets of farmed and wild sea breams were compared by multivariate data analysis based on principal component analysis (PCA). Our preliminary findings illustrate as some PL ratios can be useful markers to distinguish between farmed and wild fish.
Pure water (product number 1153332500), methanol (product number 1060352500), chloroform (product number 650498-1L), acetonitrile (product number 1000292500), and ammonium acetate (product number 73594-25G-F) were obtained from Sigma-Aldrich (Milan, Italy). All solvents used were liquid chromatography (LC)-mass spectrometry (MS; LC-MS) grade except chloroform (LC grade). Standard solutions (product number 88324 and 88322) for mass spectrometer calibrations in positive and negative polarity were purchased from Thermo Scientific (Waltham, Massachusetts, United States).
Sixteen specimens of gilthead sea bream (S. aurata), of which 14 were farmed (labelled as F) and 2 wild-caught (labelled as W), were obtained from three different countries, namely, Italy, Greece, and Turkey. In detail, 8 samples were obtained from a sea ranching aquaculture plant located in the Ionic Sea, along the coast of Taranto (Apulia, Italy). Animals were caught and slaughtered by immersion in ice water (hypothermia), the brains were removed immediately (samples labelled as TAf) or after approximately one hour (samples labelled as TA), and then they were gutted, filleted, and frozen at –20°C. Two other Italian fish samples (one farmed and one wild, labelled as ME) were obtained from the Tyrrhenian Sea, along the coast of Messina (Sicily, Italy); in this case, the individuals were caught and slaughtered by immersion in ice water, then they were stored in ice, gutted, filleted and frozen at –20°C. The same treatment was adopted for the last Italian sample, a wild gilthead sea bream captured along the Adriatic Sea coast in Southern Apulia (labelled as BR). The farmed fish from Greece (labelled GR) was bought from the fish market of a commercial chain, to have certainty of the geographical origin. Finally, four fish samples from Turkey (labelled as TR) were bought in a local market as frozen fillets sold in closed packs.
A volume of 120 µL of water was added to a 200 mg aliquot of fish fillet and the mixture was homogenized in a Potter-Elvehjem homogenizer (product number P7734-1EA). Lipids were extracted according to the Bligh and Dyer protocol [26], i.e., by adding 200 µL of chloroform and 400 µL of methanol and vortex mixing for 5 min. Afterwards, chloroform (200 µL) was added and then vortex-mixed for 30 s. Finally, pure water (200 µL) was added and the solution was centrifuged for 5 min at 1,000 rpm. The final biphasic system could thus be separated into two layers and the lower phase was collected. The lipid extract was dried, and the residue was weighed and dissolved in chloroform-methanol (1:1 v/v) to a final concentration of 10.000 ppm (w/v). A working solution of 100 ppm of total lipids was finally obtained, by subsequent dilutions of the stock solution with chloroform-methanol (1:2 v/v), and then analysed by ESI-LC-MS (ESI-LC-MS).
LC-MS measurements under high mass resolving power and accuracy conditions were performed using an ultra-high performance LC (UHPLC) system Ultimate 3000 (Thermo Scientific, Waltham, MA, USA) coupled with a Q-Exactive mass spectrometer (Catalog number: IQLAAEGAAPFALGMBDK, Thermo Scientific, Waltham, MA, USA), a hybrid instrument including a quadrupole connected to an Orbitrap analyser. LC separations were performed at ambient temperature on a narrow-bore Ascentis Express HILIC column (150 mm × 2.1 mm internal diameter, 2.7 µm particle size) equipped with an Ascentis Express HILIC (5 mm × 2.1 mm ID) security guard cartridge (Supelco, Bellefonte, PA, USA). A volume of 5 µL of lipid extract was injected into the column using the Reproducible sample Autosampler included in the Ultimate 3000 apparatus (Thermo Scientific, Waltham, MA, USA). The following binary elution program, based on methanol (solvent A) and acetonitrile (solvent B), both containing 10% (v/v) of water and 1 mmol/L of ammonium acetate, was adopted for the separation of PLs: 0−6 min, isocratic at 90% solvent B; 6–15 min, linear gradient from 90% to 60% solvent B; 15−25 min, isocratic at 60% solvent B; 25−30 min, return to the initial composition, followed by 10 min equilibration time. The operating flow was 0.3 mL/min.
The column effluent was transferred into the Q-Exactive spectrometer through its heated ESI (HESI) interface. The main electrospray and ion optics parameters adopted during LC-MS acquisitions were the following: sheath gas flow rate, 35 (arbitrary units); auxiliary gas flow rate, 15 (arbitrary units); spray voltage, ±3.5 kV (positive/negative polarity); capillary temperature, 320°C; S-Lens radio frequency level, 60 (arbitrary units). mass spectra were acquired in the m/z range of 120–1,200, after setting a mass resolving power of 70,000 (measured at m/z 200). The Orbitrap fill-time was set to 200 ms and the automatic gain control (AGC) level was set to 5 ’ 105. Before proceeding with the LC-MS acquisitions the Q-Exactive spectrometer was calibrated using a solution containing caffeine, the methionine-arginine-phenylalanine-alanine (MRFA) peptide, and Ultramark, provided by Thermo Scientific. Accuracies obtained at the end of calibration ranged between 0.15 ppm and 0.16 ppm in positive polarity and between 0.43 ppm and 0.74 ppm in negative one.
To retrieve structural information on the separated PL, additional MS acquisitions were performed during each HILIC chromatographic run. In particular, the so-called MS/all-ion fragmentation (AIF)/ neutral loss (NL) data-dependent (dd)-MS2 workflow, one of those enabled by the Q-Exactive instrumentation, was adopted. In this sequence, a high-resolution MS full scan is first performed, followed by an AIF acquisition, i.e., a scan of product ions generated by transferring and fragmenting all the ions arising from the HESI source into the higher-energy collisional dissociation (HCD) cell. Spectra obtained from these two events are rapidly compared by the software, and when a user-defined m/z NL is found the corresponding precursor ion is subjected to a dd-MS2 acquisition. The AIF spectra were acquired with the same resolving power, trap-fill time, and AGC value adopted for MS acquisitions. Due to the high accuracy provided by the Q-Exactive instrument, a very strict tolerance (1 ppm) could be set for NL recognition. A normalized collision energy (NCE) of 35% was adopted during AIF measurements. During dd-MS2 acquisitions, a resolving power of 35,000 (at m/z 200), an Orbitrap fill-time of 100 ms, and an AGC value of 5 ’ 105 were adopted; the isolation window for precursor ions was 1.0 m/z unit wide and a stepped NCE (10%, 20%, 30%) was set. Under these conditions, the instrument performs a stepwise fragmentation on the precursor ions; then, all fragments created in the steps are collected and sent to the Orbitrap analysers for single scan detection. The confirmation of single PL species individuated after elaborating data arising from the MS/AIF/NL dd-MS2 sequence was obtained during further LC-MS runs using targeted-MS2 acquisitions. In this case, the exact m/z values of the desired precursor ions were introduced into an inclusion list, each with a tolerance of 10 ppm, and a stepped NCE (10%, 20%, 30%) was adopted.
During the present investigation, LC-MS measurements were also performed, under medium resolving power and mass accuracy conditions, using another UHPLC system Ultimate 3000 (Thermo Scientific, Waltham, MA, USA) coupled with a Velos Pro mass spectrometer (Thermo Scientific, Waltham, MA, USA), equipped with a linear ion trap (LIT) analyser and an identical HESI interface. The following values were adopted for the electrospray interface and ion optics parameters: sheath gas flow rate, 25 (arbitrary units); auxiliary gas flow rate, 10 (arbitrary units); spray voltage, 4 kV (positive/negative polarity); capillary temperature, 275°C; S-Lens RF Level, 60 (arbitrary units). MS full scan runs were performed in positive and negative ion mode, in the m/z range of 50−2,000. Subsequently, MS/MS acquisitions were carried out on targeted precursor ions for selected lipids. Only the M isotopologue of each precursor ion was isolated before fragmentation, using a 1 m/z unit wide window centred on its m/z ratio. The collision energy was varied according to the ion of interest and was typically 35% (in this case a 400% value corresponds to a 100 V excitation voltage). The control of the LC-MS instrumentation including the Velos Pro spectrometer and the first processing of data was performed by the Xcalibur software 4.2 (Thermo Scientific).
After the first processing, mass spectrometric raw data provided by the two described LC-MS systems were imported, further elaborated, and finally turned into figures by the SigmaPlot 11.0 software (Systat Software, Inc., London, UK). The ChemDraw Pro 8.0.3 software (CambridgeSoft Corporation, Cambridge, MA, USA) was employed to draw chemical structures.
A preliminary identification of PL extracted from S. aurata fillets was performed using the freely accessible Online Lipid Calculator (www.mslipidomics.info/lipid-calc/) or the LipidMaps tool (http://www.lipidmaps.org/tools/ms/LMSD_search_mass_options.php). Given a certain m/z value and tolerance, the Online Lipid Calculator retrieves the possible candidate structures among several lipid classes, and the m/z values relevant to different positively or negatively charged adducts are also calculated. LipidMaps enables a search based on a specific type of charged adduct against those referred to thousands of different lipids. Accurate m/z ratios, with a tolerance of ±0.005 m/z units from FTMS, were used as input values.
Statistical treatment of the data was performed using an Excel additional component, namely XLMstat software (Microsoft Corporation, Redmond, Washington, USA). Normalized intensity values obtained after using an untargeted approach on all LC-MS data sets of the 16 investigated samples were used as input values for a PCA performed using XLMstat software. Intensity data were obtained upon averaging those resulting from a triplicated analysis of each sample. K-means clustering was subsequently done on data.
Lipid extracts from farmed and wild-caught fish were first analysed by HILIC-ESI-FTMS in positive ion mode. Compared to normal-phase (NP) chromatography, HILIC has the advantage to enhance electrospray-MS detection because its eluents are ESI-compatible. The total ion current (TIC) chromatograms of both types of fish achieved within a total run time of 15 min are shown in Figure 1. As previously reported [22], the extraction of ion currents (EIC) of diagnostic fragments enabled the identification of the PL classes and their retention time windows. This allowed us to distinguish phosphatidylcholines (PCs), lyso-PCs (LPCs), and sphingomyelins (SMs), i.e., PLs that contain a choline moiety in the polar headgroup. The recognition of these and other PL classes was also carried out by AIF acquisitions in negative ion mode. To obtain regiochemical information on PL containing choline, the generation of [M-CH3]– ions was enhanced by applying a preliminary source-induced dissociation (SID) at 40 eV of collisional energy. The EIC chromatograms exhibiting nearly the baseline separation of the PL classes of farmed and wild fish lipid extracts are respectively shown in Figures S1 and S2. The deprotonated form of N,N-dimethylphosphoethanolamine (i.e., [C4H11NO4P]–, monoisotopic m/z 168.0431), whose structure is shown in the inset of Figure S1A, is generated from the NL of the diacyl-glycerol group from the [M-CH3]– precursor ion [22]. As shown in both Figures S1A and S2A, three clusters of peaks/bands, corresponding to PCs, SMs, and LPCs, respectively, were observed in the EIC trace obtained for m/z 168.0431 (extraction window width 0.0024 m/z units). The other product ion related to the choline polar head, i.e., [C7H15NO5P]– (monoisotopic m/z 224.0693), to which EIC chromatograms of Figures S1B and S2B are referred (extraction window width 0.0022 m/z units), might arise from diacyl-PC through NL of both acyl chains, one as ketene (KE) and the other one as a FA, and from LPC through loss as FA of the residual acyl chain [22]. Notably, some alternative isomeric structures might be proposed for the product ion at m/z 224.0693 [27] even though it cannot be generated from SM [M-CH3]– ions. The EIC chromatogram of the product ion at m/z 196.0380 (0.0020 m/z units), i.e., [C5H11NO5P]– [28], is related to PEs and lyso-PE (LPEs, see plots C of both Figures S1 and S2) since it includes the phosphoethanolamine headgroup [22, 29]. By exploiting the diagnostic ions of AIF scans, it was possible to ascertain the occurrence of PEs, LPEs, PCs, LPCs and SMs as the main species detected in fillet samples of both farmed and wild-caught S. aurata (Figure 1). Moreover, for PC and LPC classes, the chromatographic resolution achieved by using a narrow-bore column (2.1 mm ID) packed with fused-core particles (2.7 µm) led also to a partial separation of different species belonging to the same PL class.
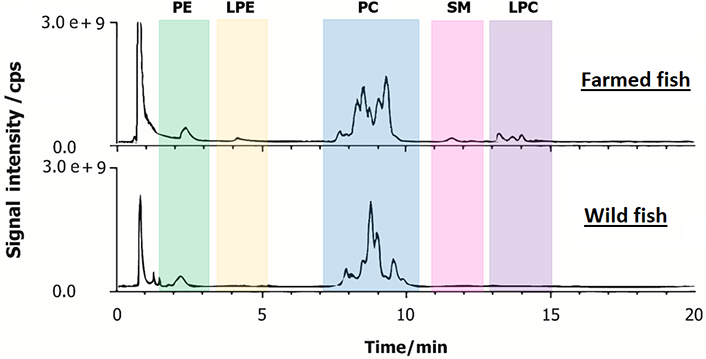
Representative TIC chromatograms obtained by HILIC-ESI(+)-FTMS of polar lipids extracted from fillets of farmed (on the top) and wild (on the bottom) S. aurata
Interestingly, a different trend of relative abundance between classes was observed when comparing farmed and wild gilthead sea breams. To quantify these features, the area under the chromatographic band related to each PL class was integrated and the area ratios PE/LPE, PC/LPC, PC/SM, and PC/PE were calculated (see Table S1). Since similar ionization yields were found for different PLs belonging to the same class during a recent study based on HILIC-ESI-MS [30], a preliminary comparison of all detected PL classes was performed using the corresponding MS responses. Indeed, the area related to each PL class in the HILIC-ESI-MS chromatogram was considered proportional to the overall concentration of compounds in that class.
Due to the possibility of lipolysis occurring in fish after death and during storage, PLs may be converted to lyso-PLs (LPLs) as a result of the phospholipase activity [16, 31]. To estimate the extent of this effect and the consequent lipidome alteration, the PL/LPL ratio can be used as a reliable parameter. The quantitative ratios were analyzed using the XLMstat software and statistically evaluated. To reduce the multidimensional data into a lower-dimensional subspace, an unsupervised PCA was applied, followed by applying K-means clustering in the subspace [32].
A biplot of the first two principal components (PC1, PC2) obtained from the PCA, which accounts for 84.53% of the total variance, chosen to investigate the lipidome of extracted sample fillets from wild-caught and farmed gilthead sea breams is displayed in Figure 2. Four clusters were identified in the biplot of Figure 2 using the K-mean method: green (3 samples, F_TAf1, F_TAf2, and F_TAf3), red (6 samples, F_TA3, F_TA4, F_TA5, W_ME, F_TR1, F_TR4), orange (2 samples, F_TR2, F_TR3) and blue (2 samples, F_ME, F_TA2); an unpaired sample (W_BR) was also inferred. The green cluster includes samples with less altered features, as they showed higher values for the PC/LPC and PE/LPE ratios. Conversely, the orange and blue clusters contain more degraded samples, the former including Turkish and Greek samples (F_TR2, F_TR3, F_GR), along with one of the Italian samples (F_TA1), and the latter including two other Italian products (F_ME and F_TA2). As emphasised in Figure 2, samples in the orange cluster were characterized by a lower PC/PE ratio, while those in the blue cluster showed a lower PC/SM ratio. This suggests the preferential involvement of lipolytic reactions on PC species as a significant trait.
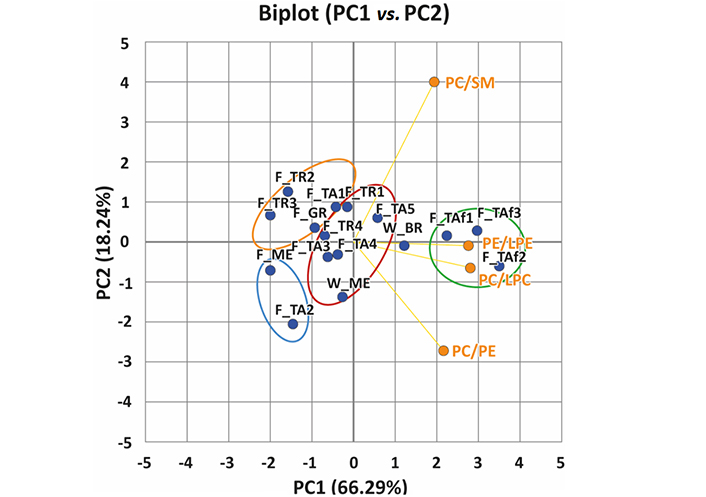
Biplot obtained after applying PCA to PE/LPE, PC/LPC, PC/PE, and PC/SM class MS response ratios calculated for all different samples of wild or farmed gilthead sea bream fillets. Clusters emphasized in the plot were inferred using K-means clustering
It should be noted that the three fish samples belonging to the green cluster (F_TAf) were caught and killed by immersing them in ice-cold water (i.e., by hypothermia). The fish were then filleted and frozen on the boat immediately after the brains were removed, resulting in the least affected samples in terms of storage. In contrast, the other fish caught from the same aquaculture plant (labelled as F_TA4) was killed in the same manner but stored for approximately one hour before being handled and frozen. Interestingly, the small variation in the PC/LPC and PE/LPE ratios between the TA samples and those from other aquaculture plants (GR and TR) or the wild fish (W_ME) suggested a similar storage protocol. According to Kolakowska et al. [16], the breakdown of PLs during freezing follows a first-order reaction, and temperature is a crucial factor that affects the quality of the process. As water freezes, the concentration of substrate and phospholipases A (PLA) increases, but once the temperature of 0°C is reached the formation of ice slows down the reaction. Therefore, the most effective way to prevent changes in the lipid composition is to freeze the fillets immediately after catching the fish.
Initially, an untargeted lipidomic approach was employed to analyse the data attained from HILIC-ESI-FTMS in positive ion mode. The lipid composition for each PL class was inferred from the FTMS spectra averaged across the HILIC band of each class [33]. In Figure S3, the averaged spectra for each PL class are shown for two representative gilthead sea bream samples, one farmed (plots A–E) and one wild-caught (plots F-J). Both samples exhibited similar detected peak signals, but differences were observed in the intra-class relative abundance distributions. To highlight these features more clearly, the m/z ratios of peak signals having a relative abundance of at least 20% were marked in bold (see Figure S3).
All PLs were identified, in terms of sum composition (i.e., number of radyl carbons), by either the Online Lipid Calculator (http://www.mslipidomics.info/lipid-calc/) or the LipidMaps database using the accurate m/z values obtained in positive ion mode and a tolerance of ±0.005 m/z units. The HILIC separation was important in correctly assigning identities to isobars from different PL classes, including PCs and PEs. PL annotations that required a mass accuracy higher than 5 ppm were skipped because the Q-Exactive mass spectrometer is expected to have at least that level of accuracy with external calibration, as reported by Holčapek et al. [34]. Tables S2–S6 provide detailed lists of the PLs identified for the main classes in both gilthead sea bream samples. In total, 216 PLs were identified in the lipid extracts of the fish fillets, consisting of 65 PE, 27 LPE, 61 PC, 34 LPC, and 29 SM. The total composition of each PL species’ side chains, including the number of radyl carbons and C=C bonds, could be determined easily based on accurate m/z ratios. Additionally, the presence of PE and PC ethers, which are PLs with one side chain linked to glycerol through an ether bond, was also ascertained. For the sake of simplicity, unless it was identified that a vinyl ether was present in the structure, PL ethers were generally labelled using the O-C:D notation proposed by Liebisch et al., with C and D indicating, respectively, the total numbers of carbon atoms and the double bond equivalents [35].
A multivariate data analysis was performed to compare the distributions of PL species between farmed and wild-caught gilthead sea bream samples. The relative abundances of each lipid species, inferred from PL class-related spectra (like those reported in Figure S3), were used as input variables, and PLs with an abundance of at least 20% were considered. The top three principal components, which accounted for 79.52% of the total variance, were picked to characterize the investigated samples. The resulting three-dimensional (3D) PCA score plot, reported in Figure 3A, showed a well-defined clustering of the S. aurata fish samples, with a significant separation between wild and farmed samples. Further separation was observed among the farmed samples, with the TAf samples grouped in red, the F_ME and F_TR3 samples grouped in the orange cluster, and all the other samples, except for F_TR2, grouped in yellow.
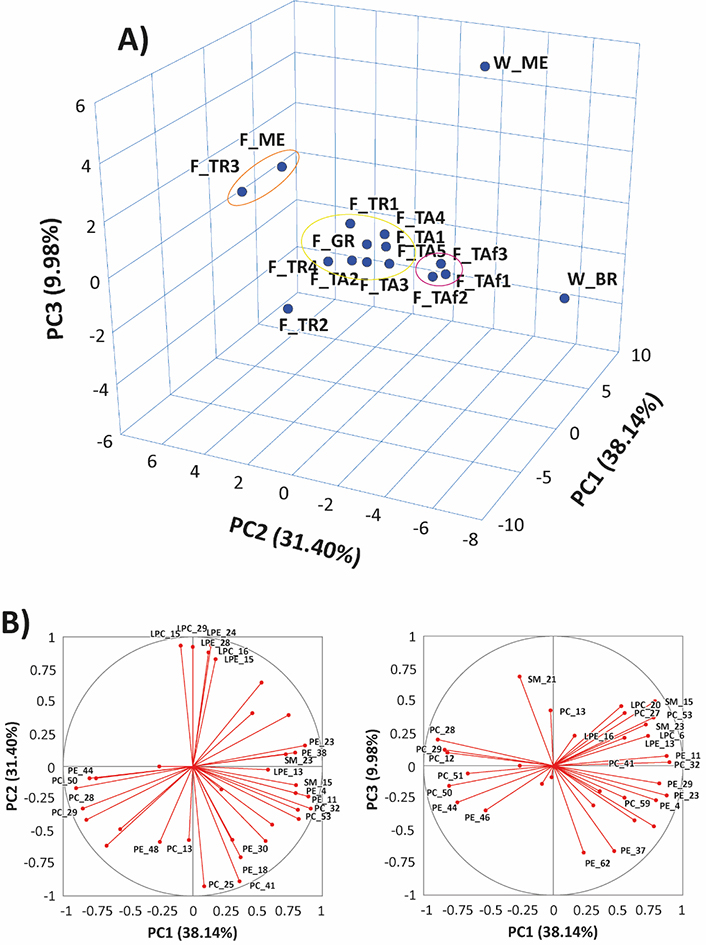
Results of PCA based on the percentual relative abundance of peak signals related to the main compounds detected in MS spectra averaged for each of the investigated PL classes for 16 samples of farmed or wild gilthead seabreams. A) 3D score plot referred to PC1, PC2, and PC3; B) loadings plots for PC1 vs. PC2 and PC1 vs. PC3. See text for interpretation. For the sake of clarity, PL species with lower statistical significance were left unlabeled; the other species were labelled according to the numeration reported in Tables S1–S6. Clusters emphasized in the 3D score plot were inferred using K-means clustering
It is also worth noting that samples in the orange cluster exhibited a low PC/LPC ratio on the PC2 (see Figure 2). Moreover, a higher abundance could be inferred from the high loadings of LPCs 18:2, 18:1, 22:5, and 22:6 and LPEs 22:6 and 20:4 on the same PC2 component (see plot B, Figure 3), while samples in the red cluster contained higher amounts of PCs 36:5 and 38:6, and PEs 36:4 and 38:6. The PC1 component was maximized positively by PE and PC ethers (Figure 3B), such as PEs O-34:2, O-36:5, O-38:7, O-40:7, and PC O-38:7, and by two SMs, SMs 40:2;2 and 41:2;2, which were more abundant in wild samples. Conversely, PL species including side chains related to PUFA, such as PE 40:8 and PC 40:8, along with PCs 36:3, and 36:2, contributed to negative values of PC1.
We acknowledge that having only two samples of wild fish may not provide a comprehensive representation. However, the clustering analysis demonstrates a distinct separation between farmed and wild-caught gilthead sea bream samples. In the 3D score plot (Figure 3A), the two wild specimens were captured from distant geographical areas and appear as isolated data points. Despite this, both points in the plot are noticeably different from those within the primary cluster of farmed fish. While these results are preliminary, they indicate the potential effectiveness of the model by expanding the population of wild samples and including those obtained from remote geographical areas.
The examined PL species of wild-caught and farmed S. aurata is presented in Figure 3. The relevant precursor ions, either positive or negative, were subjected to MS/MS analysis using the HCD cell of the Q-Exactive spectrometer, and the resulting structural assignments were listed in Table 1. As previously mentioned, and based on the degree of lipolysis, the percentual relative abundances of the primary lipids in each class were subjected to PCA, which revealed that LPCs 18:2, 18:1, 22:6, and 22:5, as well as LPEs 22:6 and 20:4, were the most significant species for discriminating the samples along PC2. When considering LPLs, it is important to note that there might be two regioisomeric identities for each of them, differing only for the location of a single fatty acyl chain on the sn-1 or sn-2 position of the glycerol moiety. We previously demonstrated that a HILIC silica-based column packed with fused-core particles is capable of separating LPL regioisomers, with sn-1 isomers being more retained than sn-2 ones [22]. The confirmation of LPL regiochemistry was inferred by MS/MS measurements. In Figure S4 the positive polarity MS/MS spectra of regioisomers for two representative LPLs, namely LPC 22:6, detected at m/z 568.34 (A, B), and LPE 22:6, detected at m/z 526.29 (C, D) were displayed. The diagnostic phosphocholine ion of PCs and LPCs at m/z 184.07 was observed in both spectra. The ion arising from the water loss ([M+H-H2O]+) was detected for both regioisomers of LPC 22:6 (m/z 530.33) and one of the two regioisomers of LPE 22:6 (m/z 508.28). To determine the regiochemistry of LPC species detected as protonated molecules, [M+H]+, we used the m/z 104.11 ion, which is a key product ion of the choline head observed preferentially for sn-1 regioisomers (i.e., LPC 22:6/0:0, as shown in plot B of Figure S4). Although both regioisomers were present in the examined samples, only the more abundant LPCs are listed in Table 1. Regarding LPEs, when the sn-2 regioisomer was fragmented, the PE diagnostic ion, corresponding to the loss of phosphoethanolamine (i.e., [M+H–141]+), prevailed, as evidenced by the peak signal at m/z 385.27 in Figure S4C. In the case of sn-1 LPEs, the product ion resulting from the loss of neutral water and the ethanolamine ion were observed (see peak signals at m/z 508.28 and 62.06 in Figure S4D). The ethanolamine ion can thus be considered a marker product ion for distinguishing between regioisomers.
PLs indicated by PCA as the most significant features in terms of discrimination between farmed and wild samples of S. aurata, identified by HILIC-ESI-FTMS/MS analysis of their lipid extracts in positive ion or negative ion mode
| Experimental m/z | Adduct | Speciesa | Molecular formula |
|---|---|---|---|
| LPLs | |||
| 520.3395 | [M+H]+ | LPC 0:0/18:2 | [C26H51NO7P]+ |
| 522.3551 | [M+H]+ | LPC 0:0/18:1 | [C26H53NO7P]+ |
| 568.3393 | [M+H]+ | LPC 0:0/22:6 | [C30H51NO7P]+ |
| 570.3552 | [M+H]+ | LPC 0:0/22:5 | [C30H53NO7P]+ |
| 524.2754 | [M+Na]+ | LPE 0:0/20:4 | [C25H44NO7PNa]+ |
| 526.2933 | [M+H]+ | LPE 0:0/22:6 | [C27H45NO7P]+ |
| PEs and PCs | |||
| 786.5080 | [M-H]– | PE 18:2/22:6 PE 20:4/20:4 | [C45H73NO8P]– |
| 768.5547 | [M-CH3]– | PC 18:1/18:2 | [C43H79NO8P]– |
| 770.5704 | [M-CH3]– | PC 18:1/18:1 PC 18:0/18:2 | [C43H81NO8P]– |
| 814.5392 | [M-CH3]– | PC 18:2/22:6 PC 20:4/20:4 | [C47H77NO8P]– |
| 816.5547 | [M-CH3]– | PC 18:1/22:6 | [C47H79NO8P]– |
| 838.5392 | [M-CH3]– | PC 22:6/20:4 | [C49H77NO8P]– |
| Plasmenyl/plasmanyl-PLs | |||
| 702.5437 | [M+H]+ | PE exhibiting ether bonds (PE P-)16:0/18:1 PE P-18:0/16:1 | [C39H77NO7P]+ |
| 724.5276 | [M+H]+ | PE P-18:2/18:2 | [C41H75NO7P]+ |
| 748.5278 | [M+H]+ | PE P-16:0/22:6 | [C43H75NO7P]+ |
| 776.5583 | [M+H]+ | PE P-18:0/22:6 PE P-18:1/22:5 | [C45H79NO7P]+ |
| 774.5428 | [M-CH3]– | PC O-16:1_22:6 | [C45H77NO7P]– |
| SMs | |||
| 769.6214 | [M-CH3]– | SM d16:1/24:1 SM d18:1/22:1 | [C44H86N2O6P]– |
| 783.6269 | [M-CH3]– | SM d17:1/24:1 SM d18:1/23:1 | [C45H90N2O6P]– |
a The acyl chain composition is indicated by the number of carbon atoms in the acyl chain followed by a colon and the number of double bonds (e.g., C:D). The use of a separator _ means that the location of fatty acyl chains on the glycerol sn-positions is unknown
In Figure 4A, the HCD-MS/MS spectrum of the [M-H]– ion of PE 40:8, representing one of the significant features that emerged from the PCA, is displayed as an example of PE fragmentation in negative polarity. The main peak signals, observed at m/z 279.23, 303.23, and 327.23, corresponded to the carboxylate anions of 18:2, 20:4, and 22:6 fatty acyl chains, respectively. Additionally, the signal labelled with a dot, detected at m/z 283.24, derive from the gas-phase loss of CO2 from the carboxylate of FA 22:6 [36]. The presence of these product ions suggests the occurrence of two co-eluting PE 40:8 isomers, namely PE 20:4/20:4 and PE 18:2_22:6. The peak signals used for the regiochemical assignment of the latter species were related to the NL of acyl chains as KEs from the deprotonated molecule, [M-H]–, considering that the peak signal intensity of the [M-H-R2CH=C=O]– product ion is known to be slightly higher than that of the [M-H-R1CH=C=O]– one [37]. As shown in Figure 4A, the signal detected at m/z 500.28 is due to the loss of the 20:4 acyl chain as a KE, occurring from both chains of PE 20:4/20:4. However, only one further signal in the spectrum, the one detected at m/z 476.26, could be related to the loss as KE of a FA, namely the 22:6 chain. The signal intensity of the loss as a KE of the other chain, 18:2, from the PE 18:2_22:6, expected at m/z 524.28, was scarcely detectable. In agreement with the previously established fragmentation rule, this result indicated that the second PE, co-eluting with PE 20:4/20:4, was identified as 18:2/22:6. Notably, there were no considerable signals for the loss of the fatty acyl chains as carboxylic acids, which are frequently observed in MS/MS of PEs obtained at lower collisional energy regimes.
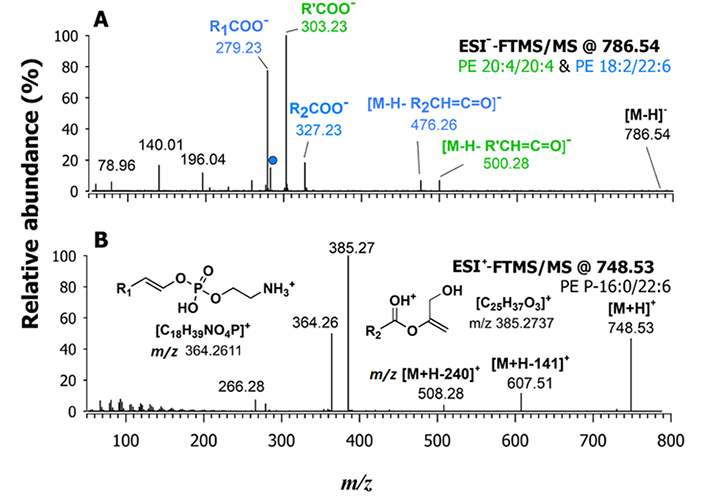
A) FTMS/MS spectrum of two deprotonated co-eluting isomeric species of PE 40:8 at m/z 786.54 (i.e., PE 20:4/20:4 and 18:2/22:6) observed in the lipid extract of a fillet sample of wild gilthead sea bream. The peak signal labelled with a dot in plot (A), at m/z 283.24, is due to the gas-phase loss of CO2 from the carboxylate anion of the fatty acyl chain 22:6 (m/z 327.23); B) FTMS/MS spectrum of the protonated adduct ([M+H]+) ion at m/z 748.53 assigned as PE O-16:0/22:6. A 20% NCE was applied [36]
PLs with ether bonds between glycerol and long-chain alkyl or alkenyl moieties, as well as ester bonds with FAs, are common in nature as constituents of membrane lipids. In particular, the ether bond is usually located in the sn-1 position of the glycerol moiety of PE ethers in animal organisms, including fish. These subclasses of nonhydrolyzable ether-linked chains are called “plasmanyl-PE”, if there is not a C=C bond adjacent to the ether oxygen atom, otherwise, they are called “plasmenyl-PE” or “plasmalogens”, which thus correspond to PE vinyl ethers. According to the nomenclature proposed by Liebisch et al. [35], the PE O- notation should be generally used for ether PE, but the PE P- should be adopted for PE vinyl ethers. Notably, the double bond of the alkenyl moiety adjacent to the ether oxygen atom in PE P- has a Z (or cis) configuration. Besides, in the conventional nomenclature adopted for PE P-, the C=C bond is not explicitly counted.
The HCD-MS/MS spectra obtained for ether PEs that emerged as relevant variables in the PCA were consistent with the fragmentation mechanisms proposed by Zemski Berry and Murphy for PE P- species [38]. For instance, the HCD-MS/MS spectrum shown in Figure 4B, annotated as a PE ([M+H]+) at m/z 748.53, is virtually generated by PE O-38:7 and/or PE P-38:6. In this case, the NL of phosphoethanolamine, leading to an m/z 607.51 ion, was not a major fragmentation pathway, whereas peaks detected at m/z 385.27 and 364.26 were prevailing. Therefore, these two product ions were diagnostic of PE P-16:0/22:6 [38]. As emphasized by structures reported in Figure 4B, the m/z 364.26 ion resulted from a migration of the alkenyl chain on the phosphoethanolamine headgroup. The m/z 385.27 ion included only the fatty acyl chain, being generated through losses of the headgroup (after a proton transfer towards the carbonylic O atom of the acyl chain) and of the alkenyl chain as an alcohol. In the present case, two further product ions were detected, although with weak signals. The one at m/z 266.28 is consistent with the loss of H3PO4 from the diagnostic product ion at m/z 364.26 and corresponds to an ammonium ion including the alkenyl moiety and a vinyl moiety linked to nitrogen. The product ion at m/z 508.28 is most likely generated from the precursor ion through the loss of the alkenyl chain as an alcohol having a nominal mass of 240 Da, a process creating a double bond between C-1 and C-2 on the glycerol backbone (like in the structure of the m/z 385.27 ion). Notably, the PE O- does not exhibit a characteristic couple of product ions described before for PE P- in their MS/MS spectra. Indeed, the PE O- MS/MS spectra are dominated by the product ion generated through the NL of phosphoethanolamine, which is the only common fragment with PE P- [38]. By following these rules, all the significant PE in terms of discrimination between farmed and wild-caught gilthead sea bream were identified, and the results are resumed in Table 1; PE ethers among them, found to be abundant in the lipid extract of wild S. aurata, were referred to as PE P- and couples of compositional isomers were also ascertained for some of them. In principle, PE O- isobaric, and partially co-eluting, with PE P- might be also present in the lipid extracts, although their concentration can be expected to be low, based on the low abundance of their characteristic product ion in MS/MS spectra.
While PEs can be fragmented in positive or negative ion mode for useful molecular data, relevant structural information on PCs and SMs can be obtained by fragmenting the corresponding [M-CH3]– ions. When acetate anions are present in the mobile phase, the generation of demethylated ions may occur already in the ESI source, starting from [M+CH3COO]– and [M+H+CH3COO-CH3]– ions, where M is the zwitterionic form of the PC or SM species. However, when an in-source fragmentation voltage is applied, as in the present case, the abundance of the [M-CH3]– ions is increased. The fragmentation of the demethylated ion of PCs is well-described in the literature [27, 39] and, as for PEs, it leads to the preferential loss of fatty acyl chains as KEs, with the intensity relationship of resulting ions being [M-H-R2’CH=C=O]– > [M-H-R1’CH=C=O]–. It is reported in Figure S5A, as an example, that the ESI-FT-MS/MS spectrum of the [M-CH3]– ion at m/z 814.54, corresponding to the partially co-eluting PC 18:2/22:6 and PC 20:4/20:4. The fragmentation pattern observed for these PCs was similar to that of the corresponding PE species (as shown in Figure 4A). In detail, the carboxylate anions of the three acyl chains involved were the main signals detected in the spectrum. Product ions related to KE losses were observed with a very low abundance only for the 20:4 (m/z 528.31) and 22:6 (m/z 504.31) chains, which allowed for the identification of the regiochemistry of PC 18:2/22:6. A summary of the other PCs that were identified in the gilthead seabream extracts, including a PC O-16:1_22:6 is provided in Table 1. This nomenclature indicates that it was not possible to ascertain the regiochemistry of this compound from MS/MS spectrum, neither it was possible to understand if a C=C bond was adjacent to the ether O atom.
In contrast to other PL classes, low-energy collisional induced dissociation (CID) was used for the MS/MS analysis of SMs, thus employing the Velos Pro LIT spectrometer. This was done to obtain more informative spectra compared to the HCD-MS/MS ones, which were mainly distinguished by polar head-related ions. As an example, Figure S5B shows the ESI-LIT-MS/MS spectrum of the [M-CH3]– at m/z 769.5. The most significant peak signals observed in the spectrum were still related to the dimethyl-ammino polar head fragment of the [M-CH3]– ion. Precisely, ions at m/z 698.6, corresponding to the NL of N,N-dimethyl-ethenylamine, and at m/z 680.5, resulting from consecutive NLs of this molecule and water from the sphingoid moiety, were detected. When the zwitterionic form of the SM is indicated as M, the two ions can be explained with NLs from it of choline and choline plus water, respectively. In addition, the product ions at m/z 449.3 and m/z 421.3 were related respectively to the loss of N-linked acyl chains 22:1 and 24:1. The presence of these chains was confirmed by the detection of the corresponding carboxylate anions, at m/z 365.2 (FA 24:1) and m/z 337.2 (FA 22:1). Note that the difference between the precursor ion and those resulting from the KE loss also allowed for the identification of the sphingoid base, that represents the ceramide backbone of SMs [40]. Therefore, two SM were successfully identified, i.e., d18:1/22:1 and d16:1/24:1.
The regiochemistry of lipid species that were expressed differently between farmed and wild fishes was established by MS/MS analyses. This finding indicates that these lipid species could serve as potential markers of fish authenticity, and the results are summarized in Table 1. The analysis showed significant differences in the fatty acyl chains of PLs in fillets of farmed and wild S. aurata. The ratio of PUFA to saturated FAs (SFA, PUFA/SFA) and the ratio of docosahexaenoic acid (DHA, 22:6) to eicosapentaenoic acid (EPA, 20:5) were significantly higher in the fillets of wild gilthead sea bream compared to the farmed ones. These findings are consistent with previous reports on Argyrosomus regius (salmon-bass or stone bass) [41]. The farmed gilthead seabream exhibited a lower incidence of FA 20:4, presumably corresponding to arachidonic acid (ARA), and a higher content of FAs 18:2 compared to the wild ones. For instance, Figure 5 shows the MS/MS spectra obtained in negative polarity for PC 40:8 and PE 40:8 of a farmed sample. The evident occurrence of signals related to carboxylate anions of the 18:2 and 22:6 acyl chains (m/z 279.23 and m/z 327.23, respectively) in Figure 5A suggests that PC 20:4/20:4, which was observed as the prevailing species in the wild fish (see Figure S5A), was completely absent in farmed fish, where only PC 18:2/22:6 was detected. A similar trend was observed for PE 40:8, as depicted by comparing MS/MS spectra reported respectively in Figures 4A and 5B corresponding to wild and farmed fish. It is worth noting that species belonging to the LPC and SM classes of farmed fish also contained 18:2 acyl chains. These differences in the fatty acyl chains of PLs between farmed and wild gilthead seabreams could potentially serve as markers of fish authenticity.
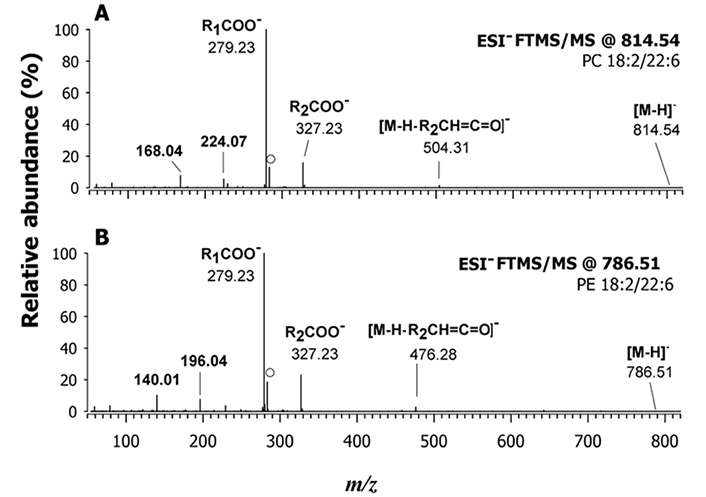
A) MS/MS spectrum obtained using a Q-Orbitrap FTMS on the deprotonated form ([M-H]–) of PC 18:2/22:6 at m/z 814.54; B) FTMS/MS spectrum at m/z 786.54 assigned as PE 18:2/22:6. The peak signal labelled with a dot in both plots at m/z 283.24 is due to the gas-phase loss of CO2 from the fatty acyl chain 22:6. Both spectra were obtained from farmed fish fillets. HCD with 20% NCE was employed
To estimate the distribution of fatty acyl chains in the PLs of gilthead sea breams, AIF MS acquisitions in negative polarity were exploited on lipid extracts from farmed and wild fishes [29]. The EIC chromatograms obtained by HILIC-ESI-FTMS AIF of four fatty acyl chains (FA 22:6, FA 20:5, FA 20:4, and FA 18:2) were examined. These acyl chains were present in most PL classes, resulting in bands aligned with those typical of PEs, LPEs, PCs, SMs, and LPCs in EIC traces. Assuming that the yield of fragmentations leading to acyl chain carboxylate anions is comparable for major PL species, such as PCs and PEs, the ratios of overall EIC peak areas measured for two different carboxylates after AIF MS acquisitions could be used to estimate the relative incidence of the corresponding acyl chains of PLs in the samples. The following FA 20:4/FA 18:2 (ARA/LA) and FA 22:6/FA 20:5 (DHA/EPA) ratios were obtained: 0.9 and 0.05, respectively, for farmed fish, and 1.98 and 3.87 for wild fish. These values confirmed the qualitative trend observed from regiochemistry assignments. The acyl chain composition reflects the natural life cycle of fishes. EPA and DHA FAs are the major PUFA in cell membranes, and they are involved in maintaining their structure and function. During ovary fish maturation, EPA is catabolized to provide energy, which can result in a reduced amount compared to DHA [42]. ARA 20:4 is the precursor of a group of highly biologically active compounds known as eicosanoids, which play a crucial role in fish reproduction; these eicosanoids have various functions, such as pheromonal attraction, steroid transport, and oocyte maturation [43].
Plasmalogens are a type of dietary PLs that have no reported side effects and are known for their anti-inflammatory properties. Their occurrence in wild gilthead sea breams can thus be considered a marker of quality. The ether-linked PLs found in these fish have more unsaturated FAs compared to the commonly found diacyl PLs. Including these dietary ether-linked PLs in a person’s diet could positively impact the lipid composition and biological responses of the host tissues [44]. Thus, the PLs identified in this preliminary study can act as quality markers for fish and should be investigated further for validation.
Using an untargeted LC-MS lipidomic approach, the lipid extracts of farmed and wild-caught S. aurata fillets were investigated. Despite the limited availability of wild fish samples, multivariate data analysis suggested that the latter might be distinguishable from farmed ones. PEs, most of which bore polyunsaturated acyl chains, were the main discriminating variables along with a high abundance of LPLs. Differences were also observed among farmed samples, as a significantly lower incidence of lyso forms of PCs and PEs was detected in fillets of farmed gilthead sea breams that were frozen soon after capture and slaughtering. This outcome implied that the partial degradation of the PL profile in farmed fish subjected to delayed freezing was likely due to lipolytic processes triggered by endogenous phospholipases. We have demonstrated that the integration of HILIC-ESI-MS with chemometrics holds great promise as an analytical approach for addressing authenticity and quality concerns in gilthead sea bream and other commercially significant fish species. The observed ratios of fatty acyl chains 20:4/18:2 and 22:6/20:5 were found to be two-fold and four-fold higher in wild-caught fish compared to farmed species. These findings should raise awareness about fraudulent practices in the industry that aim to mislead and deceive consumers.
3D: three-dimensional
AGC: automatic gain control
AIF: all-ion fragmentation
ARA: arachidonic acid
dd: data-dependent
DHA: docosahexaenoic acid
EIC: extraction of ion currents
EPA: eicosapentaenoic acid
ESI: electrospray ionization
FA: fatty acid
FTMS: Fourier-transform mass spectrometry
HCD: higher-energy collisional dissociation
HESI: heated electrospray ionization
HILIC: hydrophilic interaction liquid chromatography
KE: ketene
LC: liquid chromatography
LPCs: lyso-phosphatidylcholines
LPEs: lyso-phosphatidylethanolamine
LPLs: lyso-phospholipids
MS/MS: tandem mass spectrometry
MS: mass spectrometry
NCE: normalized collision energy
NL: neutral loss
PCA: principal component analysis
PCs: phosphatidylcholines
PE-P: PE exhibiting ether bonds
PEs: phosphatidylethanolamines
PLs: phospholipids
PUFAs: polyunsaturated fatty acids
S. aurata: Sparus aurata
SMs: sphingomyelins
The supplementary material for this article is available at: https://www.explorationpub.com/uploads/Article/file/10108_sup_1.pdf.
This work was supported by the following projects: PONa3_00395/1 “BIOSCIENZE & SALUTE (B&H)” of Italian Ministero per l’Istruzione, l’Università e la Ricerca (MIUR). Pietro Azzone is gratefully acknowledged for his help in running some experiments.
SG: Conceptualization, Investigation, Formal Analysis, Writing—original draft. CDC: Validation, Data curation, Writing—original draft. GV: Validation, Visualization, Data curation. AC: Writing—review & editing. IL: Validation, Writing—review & editing. TRIC: Funding acquisition, Writing—review & editing, Supervision. All authors read and approved the submitted version.
The authors declare that have no conflicts of interest.
Not applicable.
Not applicable.
Not applicable.
Not applicable.
This work was supported by the project [PON Ricerca E Innovazione 2014-2020 – Azione IV.6 “Contratti di ricerca su tematiche Green”] – [PONa3_00395/1 “BIOSCIENZE & SALUTE (B&H)”] of
© The Author(s) 2023.
Copyright: © The Author(s) 2023. This is an Open Access article licensed under a Creative Commons Attribution 4.0 International License (https://creativecommons.org/licenses/by/4.0/), which permits unrestricted use, sharing, adaptation, distribution and reproduction in any medium or format, for any purpose, even commercially, as long as you give appropriate credit to the original author(s) and the source, provide a link to the Creative Commons license, and indicate if changes were made.

View: 4358
Download: 57
Times Cited: 0
