 Original Article


Affiliation:
1Department of Medicine, Division of Endocrinology, Faculty of Medicine and Health Sciences, Université de Sherbrooke, Sherbrooke, QC J1H 5N4, Canada
Email: christophe.richer.dit.lafleche@usherbrooke.ca
ORCID: https://orcid.org/0009-0003-8609-2398


 ,
,
Affiliation:
2School of Human Kinetics, Faculty of Health Sciences, University of Ottawa, Ottawa, ON K1N 6N5, Canada
ORCID: https://orcid.org/0000-0001-5269-7207
,
Affiliation:
3Pennington Biomedical Research Center, Baton Rouge, LA 70808, United States of America
ORCID: https://orcid.org/0000-0002-7267-7374
,
Affiliation:
4Department of Internal Medicine, Faculty of Health Sciences, University of Manitoba, Winnipeg, MB R3T 2N2, Canada
ORCID: https://orcid.org/0000-0001-6947-6400
,
Affiliation:
1Department of Medicine, Division of Endocrinology, Faculty of Medicine and Health Sciences, Université de Sherbrooke, Sherbrooke, QC J1H 5N4, Canada
5Centre de Recherche du Centre Hospitalier Universitaire de Sherbrooke, Sherbrooke, QC J1H 5N4, Canada
ORCID: https://orcid.org/0000-0002-1336-081X
,
Affiliation:
2School of Human Kinetics, Faculty of Health Sciences, University of Ottawa, Ottawa, ON K1N 6N5, Canada
Email: kadamo@uottawa.ca
ORCID: https://orcid.org/0000-0001-7925-1889
Explor Digit Health Technol. 2026;4:101197 DOI: https://doi.org/10.37349/edht.2026.101197
Received: January 14, 2026 Accepted: April 07, 2026 Published: July 09, 2026
Academic Editor: Atanas G. Atanasov, Medical University of Vienna, Austria
Aim: Evaluate the associations between usage of the standalone SmartMoms Canada mHealth intervention, and gestational weight gain (GWG) guideline adherence and lifestyle improvements in pregnant individuals in the context of a pragmatic study.
Methods: Participants (18–40 years, BMI 18.5–39.9 kg/m2) were recruited into a single-arm trial conducted in Winnipeg and Ottawa, Canada. All participants were provided with the app, a Fitbit® tracker, and a smart scale. Participants were assessed in early, mid-, and late pregnancy. Physical activity was measured with the Godin Leisure Time Exercise score, and the Fitbit® tracker (steps and time in physical activity). Fitbit® app was used to measure dietary intake. App usage and GWG were monitored. GWG guideline adherence was compared with data from the Statistics Canada Maternal Experiences Survey (MES). GWG adherence and lifestyle changes were compared between app usage groups (≥ median weekly app usage vs. < median) with multinomial logistic regressions or t tests. Trajectories in lifestyle changes were compared between groups with repeated measure analyses.
Results: Of the 75 participants recruited in early pregnancy, 51 were followed through pregnancy (32% drop out). Overall app usage was low (median 1.30 min/wk). Adequate GWG was achieved by 35.7% (95% CI: 23.2–48.2) of participants vs. 32.6% in the MES; while excessive GWG occurred in 50.0% (95% CI: 36.9–63.1) vs. 48.7%. GWG adherence was not different between usage groups (P = 0.399), but a higher mean weekly app usage (continuous) was associated with lower odds of insufficient GWG (OR = 0.01, P = 0.035). There were no significant associations between app usage and changes in physical activity, but a lower increase in carbohydrate intake was observed in the higher usage group.
Conclusions: Few associations were found between app usage and GWG or lifestyle outcomes. Lack of significant results could relate to low protocol and intervention adherence (Trial registration: http://www.isrctn.com/ISRCTN16254958).
Gestational weight gain (GWG) within a recommended range is an important contributor to a healthy pregnancy. Exceeding GWG targets has been associated with numerous short- and long-term health risks for both mother and child. For example, excessive GWG, independent of pre-pregnancy body mass index (BMI), is associated with increased odds of gestational hypertension [1], caesarean birth (planned or unplanned) [2, 3], and higher weight retention that is maintained over 15 years following the birth [4, 5]. For offspring, excessive GWG increases the odds of being born large for gestational age (LGA), regardless of maternal pre-gravid BMI [3, 6]. This association is particularly concerning, as each incremental kilogram of birth weight raises the odds of overweight in adolescence by 20–60% [7], a strong predictor of adulthood obesity [8], thereby perpetuating the intergenerational cycle of obesity [9].
In the face of rising obesity rates, the IOM published updated GWG guidelines in 2009, which specify target ranges differing based on pre-pregnancy BMI [10]. Adhering to these GWG recommendations can prove challenging, especially for those entering pregnancy with overweight or obesity [2, 11]. Nearly half (48.7%) of Canadian women with singleton pregnancies experience excessive GWG [2, 12], with comparable prevalence rates observed internationally [13]. Suboptimal patient education offered by perinatal providers could contribute to low adherence, as demonstrated by a 2011 Ontario study where just 28.5% of pregnant women recalled receiving guidance about recommended pregnancy weight gain during prenatal care [14]. While evidence shows that lifestyle interventions reduce the prevalence of excessive GWG by 13% to 27% [15], and support the well-established physical and psychological benefits of behavioural interventions including prenatal physical activity (PA) for mother and her child [16–21], adherence remains concerningly low. Canadian data reveal that only 54% of pregnant participants in the first trimester meet the recommended 150 minutes of moderate-intensity PA per week [22]—a rate that declines to 23% by the third trimester [23]. Potential barriers to an adequate PA level in pregnancy include interpersonal factors such as lack of time and energy [24]. Despite the vast majority of pregnant women reporting a desire to receive lifestyle counselling from their healthcare provider [25], a gap in the delivery of patient education remains. However, traditional, in-person, preventive lifestyle interventions require significant financial and human resources, which limit their feasibility at a large scale.
Hybrid (electronic + in person) lifestyle interventions have been shown to improve patient education and adherence to PA and GWG recommendations in a scalable manner [26–30], evidence on the efficacy of fully digital (mHealth) interventions appears promising, but inconsistent [31]. Our group has developed a novel standalone mHealth intervention, the SmartMoms Canada app, an evidence-based program designed to promote healthful behaviours—particularly those linked to GWG guideline adherence—such as PA, healthy eating, sleep hygiene, and stress and mood management. The app is adapted from the original US-version, SmartMoms, which was shown to improve GWG adherence among pregnant women with overweight [32]. Unlike the U.S. version, SmartMoms Canada does not include telehealth support, thereby enhancing its scalability.
The aim of our real-world, engagement-outcome association study was to explore the relationship between SmartMoms Canada app usage and GWG in women. Since the intervention has a strong emphasis on supporting a healthy lifestyle with potential effects on GWG adherence, we also conducted exploratory analyses assessing associations between app usage and changes in dietary, and physical activity. Moreover, we aimed to compare adherence to GWG recommendations between our participants and a historical control group from the Canadian Maternity Experiences Survey (MES) [12]. To our knowledge, this study is the first to investigate dose-response relationships between engagement with an mHealth intervention and GWG or lifestyle outcomes.
Exploratory effectiveness analyses were conducted in the context of the initial phase of a non-controlled feasibility trial using the β-version of the SmartMoms Canada app. The protocol [33] and preliminary, short-term results [34] have been previously published, and the trial is registered at http://www.isrctn.com/ISRCTN16254958. Participants were recruited in the provinces of Ontario and Manitoba (Canada) from February 2021 to October 2022. Ethical approval was obtained at each research site (University of Ottawa REB H-09-19-4795, University of Manitoba REB HS23407-H2019:448), and all participants provided written informed consent to participate in the study. The study conformed to the ethical principles of the Declaration of Helsinki.
Recruitment was carried out online through advertisements disseminated on various social media platforms, including outside of the study sites’ respective cities. Pregnant women were eligible if they were 12–20 weeks of gestation at inclusion, had a singleton pregnancy, a pre-pregnancy BMI of 18.5–39.9 kg/m2, and were 18 to 40 years of age. Exclusion criteria were consumption of alcohol, tobacco or other drugs in pregnancy, gestational diabetes requiring insulin treatment, uncontrolled hypertension, having a contraindication to PA in pregnancy according to the 2019 Canadian guidelines [22], positive screening for antenatal depression (Edinburgh Postnatal Depression Scale score > 13 [35]), a severe fetal congenital anomaly, and any other medical conditions known to affect the weight of the mother or the fetus. Women who did not speak English or French and those who planned to put up their baby for adoption were also excluded.
Participants were instructed to download the β-version SmartMoms Canada mobile app (available in English and French) on their personal iOS or Android smartphones. Participants were also provided through mail with a Wi-Fi enabled scale and an activity tracker, along with the Fitbit® and Withings® companion apps, which they could keep at the end of the study. The provision of these devices served a dual purpose of feeding built-in app features and research data collection. The installation process was done by participants but was guided by research staff through remote meetings.
A more detailed description of the app’s features is provided in the study protocol [33]. In brief, the SmartMoms Canada app is based on behavioural theory and is aimed at allowing for the reciprocal delivery of metrics and health-related information between the app and the user in a continuous feedback loop, all of which are evidence-based. These interactions were present in the various pages of the app:
Core Health Tracking Feature: The app’s central “Health” page enables real-time self-monitoring of key metrics:
GWG displayed in kg/lbs with a visual indicator categorizing progress as inadequate, adequate, or excessive relative to trimester-specific guidelines [10].
Daily step counts, caloric intake, resting heart rate, and previous night’s sleep duration.
A feedback system generated personalized recommendations using a validated mathematical model of energetic metabolism in relation to GWG [36], while an interactive graph plotted users’ GWG trajectory against recommended ranges throughout pregnancy.
Evidence-based Guidance Hub: The “SmartTips” page provided weekly, clinically vetted advice on:
Nutrition tailored to pregnancy stages.
Safe PA guidance/tools/programs.
Mood regulation and sleep optimization.
Motivational strategies for maintaining healthy habits.
Exercise Resources:
A curated database of pregnancy-safe workouts with video/photo demonstrations.
Updated Canadian guidelines for PA throughout pregnancy [22].
Developmental Tracking Tool:
The “Your Baby” page visualized fetal growth using fruit/vegetable comparisons alongside weekly updates about developmental milestones.
Weekly push notifications were sent to users’ smartphones encouraging them to adopt or maintain healthy behaviours, which acted as reminders to use the app. Participants were instructed to continue appropriate prenatal care with their respective healthcare providers. There was no control group.
Participants completed 3 assessments during pregnancy over the course of their participation in the study: one at inclusion (early pregnancy, ≤ 20 weeks of gestation), and twice during pregnancy (mid pregnancy, 24–28 weeks, and late pregnancy, 36–40 weeks). During assessments, which were carried out remotely, participants completed questionnaires and food logs, but app usage, weight, and PA measures were continuously monitored.
Mean overall app usage was calculated by dividing the total app usage time (compiled in minutes; precise to the millisecond) by the total usage duration during pregnancy (in weeks; from the first login to the last app use). Google Firebase® (Google, Mountain View, USA) services were used to monitor user analytics for both the Android and iOS app versions. It was also possible to measure the number of times (frequency) participants opened each page on the app, but not the time spent on each page. These data were password-protected, and access was restricted to research staff requiring access.
Since the trial did not include a usual care comparator group, participants were divided into groups based on the median mean app usage time to compare a lower usage group and a higher usage group. Grouping was performed separately for each outcome to maintain balanced group sizes.
The number of times participants opened each page was also measured through the same system, which made it possible to calculate a mean weekly “Health” page usage variable (times per week). Since the “Health” page is the app’s flagship feature, GWG adherence analyses were also conducted for this variable.
At inclusion, participants were also asked to complete a study-specific sociodemographic questionnaire and the Edinburgh Postnatal Depression Scale (EPDS) questionnaire [35].
Participants were instructed to use the connected Withings® Body + weight scale (Cat #WBS05, Withings, Issy-les-Moulineaux, France) at least weekly, which allowed the app to calculate a mean GWG for each gestational week. Measured GWG were then compared to IOM guidelines to assess recommended GWG adherence at each timepoint based on GWG velocity and by accounting for pre-pregnancy BMI categorization. Pre-pregnancy BMI was self-reported by participants. For our analyses, the last registered weight was used to determine a participant’s GWG recommendation adherence.
Participants were provided with a Fitbit® Charge 2 or Fitbit® Luxe (Cat. #FB407SBKL and #FB422BKBK-FRCJK respectively, Google, Mountain View, USA) fitness tracker [37]. Based on the tracker’s accelerometer sensor data, Fitbit® computes the daily time spent in vigorous, moderate, and light PA (VPA, MPA, and LPA, respectively), and sedentary time, as well as the total daily step count [38]. Moderate-to-vigorous PA (MVPA) time was calculated as the sum of VPA and MPA. Weekly PA variables per time point were computed by averaging daily values for days with steps > 1,000, over the week following each assessment, except for the early pregnancy assessment period, which started on the first complete day to account for delays between assessment and device usage initiation (0 to 2 weeks). Within assessment periods, days where step counts were lower than 1,000 were considered as missing [39–42], because it indicated that participants did not wear the tracker during the whole day.
The Godin Leisure Time Exercise (GLTE) questionnaire was also used to quantify the self-reported PA level of participants [43]. Participants were requested to provides the number of times they performed VPA, MPA, and LPA for at least 15 minutes in the last 7 days, and each intensity level is weighted nine, five, and three times respectively. A higher score indicates a higher frequency and/or intensity of PA.
Participants were instructed to fill out a food log on the Fitbit® mobile application for at least 3 days (2 weekdays and 1 weekend day) within the week following each assessment. Participants indicated all the food and liquids that were consumed within a given day, after which the Fitbit® app calculated daily intake of carbohydrates, lipids, proteins, fibres, sodium, and energy based on participant data. It was then possible to calculate the ratio between energy intake and estimated energy requirements based on published equations specific to pregnancy [44] and the percentage of energy intake attributable to carbohydrates, proteins and lipids. Any available data points were then used to calculate a daily average intake of each nutrient over the assessment week.
Descriptive statistics were presented as means ± standard deviation (SD) for continuous variables following a symmetrical distribution, as median (interquartile range [IQR]) for continuous variables following a non-normal distribution, and as proportions for categorical variables. For inferential analyses, non-normally distributed variables were transformed (log or inversed).
Our sample proportions of insufficient, adequate, or excessive GWG were compared with Statistics Canada’s MES results [12], treated as fixed reference values, by assessing whether the 95% confidence intervals (95% CI) of each proportion included the corresponding MES estimate. GWG adherence was compared between app usage groups with multinomial logistic regressions with the likelihood ratio test, and odds ratios (OR) were presented if the likelihood ratio test was significant. Longitudinal, continuous outcome measures were compared between groups using 2 methods: t tests for differences in early-to-late pregnancy changes (late pregnancy measure minus early pregnancy measure), and mixed linear regression analyses for repeated measures (which included all measures for participants with ≥ 2 time point measures) with group, time main, and interaction as independent parameters. When possible (based on sample size), all analyses, except for repeated measure analyses, were also adjusted for potential confounders. Potential confounders were baseline measures that were statistically, or visually different between groups. To conserve statistical power, education was dichotomized as university vs. not, and ethnicity was dichotomized as European descent vs. not when included as covariates. Variables that were selected as potential confounders are specified in the legend of results table where sample size was sufficient (≥ 10 per group), and baseline characteristics in subgroups are presented in Supplemental tables.
In dietary measure analyses specifically, because t test and repeated measure analyses cannot account for categories of adherence to nutritional recommendations (under, within, or above, according to Health Canada [45]), further analyses were conducted if main results were significant. Proportions of participants per category of adherence to recommendations at various time points were then compared with the Fisher test.
Statistical significance was established at an α of 5%. Statistical analyses were conducted in R version 4.4.0 (R Foundation, Indianapolis, USA), and SPSS version 28.0 (IBM, Armonk, USA).
It was predetermined that a sample size of 100 participants would provide sufficient power to estimate a GWG adherence proportion of 50% with ± 10% margin error (95% CI) [33]; however, this target was not achieved in the present study, and was even lower for each secondary outcome analysis. Additional recruitment is underway in a second phase of the trial. However, the study was adequately powered to detect an absolute increase of 21% adherence proportion, compared to the 32.6% proportion used as a point of comparison (for 56 participants and 90% statistical power, calculated with G*Power version 3.1.9.6 [46]). Accounting for lost to follow-up and missing data, the study was not sufficiently powered to detect small-to-moderate effect sizes in lifestyle outcome analyses (minimum Cohen’s d between 0.92 and 2.03 for 80% statistical power depending on outcomes).
The study flow is presented in Figure 1, and baseline characteristics of participants are shown in Table 1 (lower n reflect non-response). In total, 75 eligible participants were recruited to participate in the study (an additional 13 ineligible candidates were excluded), and 24 (32%) were lost to follow-up. Attrition was not random: individuals lost to follow-up before the final pregnancy assessment had lower mean app usage (P = 0.003), higher rates of pre-pregnancy obesity (P = 0.015), and tended to report higher baseline carbohydrate intake (P = 0.052), and lower PA levels (P = 0.054) compared to those who completed follow-up. Participants who remained in the study were also more likely to be of European ethnicity (P = 0.039). As expected, last measured GWG and the corresponding gestational week were lower among those lost to follow-up (both P < 0.001).
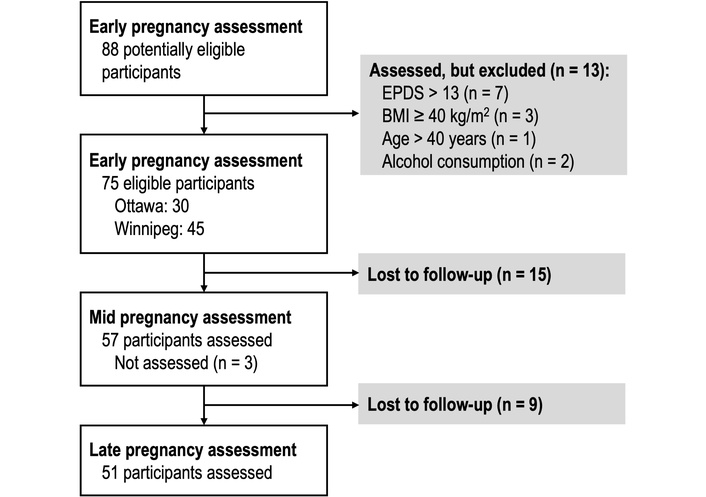
Study flowchart. BMI: body mass index; EPDS: Edinburgh Postnatal Depression Scale score.
Baseline participants’ characteristics including stratification for lost to follow-ups.
| Characteristic | All | n | Completed | n | Lost to follow-up | n | |||
|---|---|---|---|---|---|---|---|---|---|
| Mean app usage time (min/wk) | 1.30 (0.68–2.93) | 75 | 1.77 (1.05–3.45) | 51 | 0.62 (0.00–1.20) | 24 | |||
| Research site | |||||||||
| Ottawa | 35 [46.7] | 29 [56.7] | 6 [25.0] | ||||||
| Winnipeg | 40 [53.3] | 22 [43.1] | 18 [75.0] | ||||||
| Gestational weight gain at inclusion (kg) | 3.34 ± 3.79 | 60 | 3.43 ± 3.40 | 43 | 3.05 ± 4.67 | 17 | |||
| Gestational week at inclusion | 17.9 ± 2.9 | 60 | 18.1 ± 2.6 | 43 | 17.5 ± 3.4 | 17 | |||
| Last gestational weight gain measure (kg) | 11.87 ± 6.46 | 56 | 13.86 ± 5.66 | 40 | 6.49 ± 5.18 | 16 | |||
| Gestational week at last weight measure | 34.5 ± 6.4 | 56 | 36.8 ± 4.9 | 40 | 27.9 ± 6.3 | 16 | |||
| Age (years) | 32.3 ± 3.9 | 68 | 32.6 ± 3.3 | 48 | 31.7 ± 5.2 | 20 | |||
| Body-mass index (kg/m2) | 25.3 ± 4.2 | 68 | 24.7 ± 3.6 | 50 | 26.8 ± 5.6 | 18 | |||
| 18.5–24.9 kg/m2 | 39 [56.5] | 29 [58.0] | 10 [52.6] | ||||||
| 25.0–29.9 kg/m2 | 23 [33.3] | 19 [38.0] | 4 [21.1] | ||||||
| 30.0–39.9 kg/m2 | 7 [10.1] | 2 [4.0] | 5 [26.3] | ||||||
| Nulliparous | 15 [38.5] | 39 | 10 [45.5] | 22 | 5 [20.8] | 17 | |||
| Annual household income | |||||||||
| < $CA 30,000 | 1 [1.5] | 0 [0.0] | 1 [5.0] | ||||||
| $CA 30,000–59,999 | 6 [9.1] | 2 [4.3] | 4 [20.0] | ||||||
| $CA 60,000–89,999 | 3 [4.5] | 2 [4.3] | 1 [5.0] | ||||||
| $CA 90,000–119,999 | 19 [28.8] | 15 [32.6] | 4 [20.0] | ||||||
| $CA 120,000–150,000 | 12 [18.2] | 8 [17.4] | 4 [20.0] | ||||||
| ≥ $CA 150,000 | 20 [30.3] | 16 [34.8] | 4 [20.0] | ||||||
| Refuse to answer | 5 [7.6] | 3 [6.5] | 2 [10.0] | ||||||
| Highest level of education | |||||||||
| Primary/secondary | 4 [6.1] | 3 [6.5] | 1 [5.0] | ||||||
| Vocational or college | 13 [19.7] | 6 [13.0] | 7 [45.0] | ||||||
| University or higher | 49 [74.3] | 37 [80.4] | 12 [60.0] | ||||||
| Ethnicity | |||||||||
| European descent | 46 [69.7] | 36 [78.3] | 10 [50.0] | ||||||
| East/Southeast Asian | 10 [15.2] | 4 [8.7] | 6 [30.0] | ||||||
| Indigenous | 4 [6.1] | 2 [4.3] | 2 [10.0] | ||||||
| Latino | 3 [4.5] | 2 [4.3] | 1 [5.0] | ||||||
| Other | 3 [4.5] | 2 [4.3] | 1 [5.0] | ||||||
| Godin Leisure-Time Exercise score | 25.0 (11.8–40.0) | 68 | 28.5 (12.8–44.3) | 48 | 17.0 (9.0–31.5) | 20 | |||
| Daily step counts | 6,507 ± 2,680 | 35 | 6,817 ± 2,711 | 28 | 5,269 ± 2,327 | 7 | |||
| VPA time (min/d) | 9.29 (2.57–20.50) | 35 | 10.5 (2.96–22.6) | 28 | 4.00 (1.33–12.36) | 7 | |||
| MVPA time (min/d) | 23.0 (6.6–33.4) | 35 | 23.4 (6.85–34.9) | 28 | 17.1 (5.8–25.3) | 7 | |||
| MPA time (min/d) | 11.9 (3.5–15.8) | 35 | 11.9 (2.66–16.4) | 28 | 11.9 (4.48–13.6) | 7 | |||
| LPA time (min/d) | 224 ± 94 | 35 | 226 ± 100 | 28 | 220 ± 72 | 7 | |||
| Sedentary time (min/d) | 745 ± 225 | 35 | 735 ± 237 | 28 | 786 ± 177 | 7 | |||
| Energy intake (kcal/d) | 1,696 ± 497 | 16 | 1,769 ± 507 | 13 | 1,377 ± 353 | 3 | |||
| % of estimated energy requirements | 58.6 ± 17.0 | 13 | 59.5 ± 18.3 | 11 | 53.9 ± 7.37 | 2 | |||
| Lipids (g/d) | 65.1 ± 19.8 | 16 | 66.3 ± 21.9 | 13 | 59.9 ± 3.46 | 3 | |||
| Lipids (% of energy intake) | 35.2 ± 7.7 | 16 | 33.7 ± 5.2 | 13 | 41.6 ± 14.3 | 3 | |||
| Carbohydrates (g/d) | 213 (164–254) | 16 | 228 (183–260) | 13 | 131 (90.2–131) | 3 | |||
| Carbohydrates (% of energy intake) | 46.6 ± 9.8 | 16 | 49.2 ± 6.3 | 13 | 35.5 ± 15.7 | 3 | |||
| Fibres (g/d) | 19.3 ± 7.2 | 16 | 18.9 ± 7.3 | 13 | 21.1 ± 7.6 | 3 | |||
| Sodium (mg/d) | 2,542 ± 852 | 16 | 2,667 ± 874 | 13 | 2,001 ± 565 | 3 | |||
| Proteins (g/d) | 79.6 ± 28.1 | 16 | 76.3 ± 27.9 | 13 | 94.1 ± 29.2 | 3 | |||
| Proteins (% of energy intake) | 19.0 ± 5.0 | 16 | 17.2 ± 3.0 | 13 | 27.1 ± 3.5 | 5 | |||
Values are presented as mean ± standard deviation, n [%], or median (1st quartile–3rd quartile). Differences in n are due to some data not being reported by participants, regardless of whether or not they were lost to follow-up. GLTE: Godin Leisure Time Exercise questionnaire; LPA: light physical activity; MPA: moderate physical activity; MVPA: moderate-to-vigorous physical activity; VPA: vigorous physical activity.
Mean weekly app usage (in log (min/wk + 3)) was most highly correlated with mean weekly “Health” page usage (in log (times/week + 1)) (R2 = 0.712, P < 0.001), but was also strongly and significantly correlated with the other pages (Figure S1). The three most frequently accessed pages were the “Health”, the “Your Baby”, and the “SmartTips” pages, while the “Exercise” page and its subsections were accessed less than 0.5 times per week on average (Figure S2).
Adherence to the study protocol is summarized in Table 2. Notably, 20% of participants never used the provided connected scale, 8% never completed the self-reported PA questionnaire, 53.3% never used the provided fitness tracker, and 66.7% did not complete the required food logs. In addition, 7 participants (9.3%) never opened the app.
Adherence rates to the protocol out of included 75 participants.
| Adherence rates to the protocol | |||
|---|---|---|---|
| Weight measures and gestational weight gain | |||
| Weighed themselves at least once | 60 [80.0%] | ||
| Weighed themselves at least twice (GWG calculated) | 56 [74.7%] | ||
| Last measure was recorded at least at 37 weeks of gestation | 34 [45.3%] | ||
| Lifestyle measures | |||
| GLTE | Fitbit tracker | Food logs | |
| At least one measure | 69 [92.0%] | 35 [46.7%] | 25 [33.3%] |
| Early-pregnancy | 56 [74.7%] | 22 [29.3%] | 13 [17.3%] |
| Mid-pregnancy | 56 [74.7%] | 20 [26.7%] | 18 [24.0%] |
| Late-pregnancy | 46 [61.3%] | 17 [22.7%] | 15 [20.0%] |
| Both early and late | 42 [56.0%] | 17 [22.7%] | 10 [13.3%] |
Values are presented as n [%]. GLTE: Godin Leisure Time Exercise questionnaire.
Overall, 14.3% (95% CI: 5.1–23.5) of participants had an inadequate GWG vs. 18.7% in the MES, 35.7% (95% CI: 23.2–48.2) gained an adequate amount of weight vs. 32.6% (MES), and 50.0% (95% CI: 36.9–63.1) exceeded GWG recommendations vs. 48.7% of MES respondents (Figure 2A). As indicated, these proportions were not significantly different from results reported in Statistics Canada’s MES.
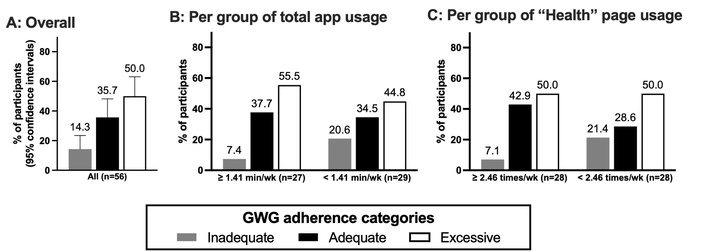
Proportions of participants within each category of GWG adherence according to 2009 IOM guidelines. (A) Proportions for all participants, where error bars represent the 95% confidence intervals. (B) Proportions for each mean weekly app usage group, divided through its median. (C) Proportions for each mean weekly “Health” app usage group, also divided through its median.
Adherence rates to GWG recommendations did not significantly differ between app usage groups (likelihood ratio test, P = 0.399; Figure 2B). However, sensitivity analyses using log-transformed continuous app usage (in min/wk) revealed a significant association between higher app usage and reduced odds of inadequate GWG (OR = 0.01, P = 0.035), but not excessive GWG (P = 0.599; whole model likelihood ratio test P = 0.041). Notably, the association with inadequate GWG was slightly attenuated and no longer significant after adjusting for the site, university education, and European descent (OR = 0.03, P for app usage = 0.22), which significantly differed between app usage groups for these analyses (Table S1).
When considering mean weekly “Health” page usage as the independent variable, the likelihood ratio test was not significant either (P = 0.235; Figure 2C).
Changes in measures from early-to-late pregnancy are presented in Table 3 with app usage grouping cutoffs specified for each outcome. No significant associations were observed between mean weekly app usage groups and changes in PA measures in either univariate, or adjusted analyses when possible. For dietary measures, participants with a mean app usage of ≥ 3.12 minutes per week had a significantly greater reduction in carbohydrate intake relative to total energy intake across pregnancy. However, no between-group differences were found in adherence to carbohydrate intake recommendations at either the early or late pregnancy time point (Figure 3).
Associations between app usage levels and early-to-late pregnancy changes in lifestyle measures.
| Outcome measures | Early-to-late pregnancy changes | n | P-value | Adjusted P* | |
|---|---|---|---|---|---|
| GLTE score | |||||
| ≥ 1.97 min/wk | –4.60 ± 17.95 | 20 | 0.756 | 0.517 | |
| < 1.97 min/wk | –6.32 ± 17.63 | 22 | |||
| Daily step counts | |||||
| ≥ 3.29 min/wk | 444 (–351–1,508) | 9 | 0.147 | N/A | |
| < 3.29 min/wk | –425 (–1,404– –79) | 8 | |||
| VPA time (min/d) | |||||
| ≥ 3.29 min/wk | –6.94 ± 6.40 | 9 | 0.184 | N/A | |
| < 3.29 min/wk | –14.60 ± 15.07 | 8 | |||
| MVPA time (min/d) | |||||
| ≥ 3.29 min/wk | –4.86 (–16.50–6.18) | 9 | 0.326 | N/A | |
| < 3.29 min/wk | –10.71 (–20.45– –0.57) | 8 | |||
| MPA time (min/d) | |||||
| ≥ 3.29 min/wk | 0.62 ± 8.50 | 9 | 0.893 | N/A | |
| < 3.29 min/wk | 1.12 ± 6.03 | 8 | |||
| LPA time (min/d) | |||||
| ≥ 3.29 min/wk | 16.5 ± 83.5 | 9 | 0.693 | N/A | |
| < 3.29 min/wk | 30.4 ± 53.5 | 8 | |||
| Sedentary time (min/d) | |||||
| ≥ 3.29 min/wk | –1.56 ± 146.25 | 9 | 0.303 | N/A | |
| < 3.29 min/wk | –97.34 ± 220.44 | 8 | |||
| Energy intake (kcal/d) | |||||
| ≥ 3.12 min/wk | 266 ± 904 | 5 | 0.357 | N/A | |
| < 3.12 min/wk | –183 ± 487 | 5 | |||
| % of estimated energy requirements | |||||
| ≥ 3.12 min/wk | 10.0 ± 43.2 | 5 | 0.328 | N/A | |
| < 3.12 min/wk | –12.1 ± 16.6 | 5 | |||
| Lipids (g/d) | |||||
| ≥ 3.12 min/wk | –5.71 ± 24.99 | 5 | 0.698 | N/A | |
| < 3.12 min/wk | –12.27 ± 26.64 | 5 | |||
| Lipids (% of energy intake) | |||||
| ≥ 3.12 min/wk | –4.5 ±12.4 | 5 | 0.599 | N/A | |
| < 3.12 min/wk | –1.1 ± 6.1 | 5 | |||
| Carbohydrates (g/d) | |||||
| ≥ 3.12 min/wk | –13.84 ± 72.18 | 5 | 0.526 | N/A | |
| < 3.12 min/wk | 32.52 ± 138.63 | 5 | |||
| Carbohydrates (% of energy intake) | |||||
| ≥ 3.12 min/wk | –8.6 (–11.2– –5.6) | 5 | 0.016 | N/A | |
| < 3.12 min/wk | 5.9 (–1.4–6.9) | 5 | |||
| Fibres (g/d) | |||||
| ≥ 3.12 min/wk | –4.51 ± 4.94 | 5 | 0.624 | N/A | |
| < 3.12 min/wk | –1.04 ± 14.41 | 5 | |||
| Sodium (mg/d) | |||||
| ≥ 3.12 min/wk | –103 (–1,617–27) | 5 | 0.727 | N/A | |
| < 3.12 min/wk | –879 (–1,051– –213) | 5 | |||
| Proteins (g/d) | |||||
| ≥ 3.12 min/wk | –19.4 (–27.1–5.9) | 5 | 0.660 | N/A | |
| < 3.12 min/wk | –24.2 (–35.5– –8.2) | 5 | |||
| Proteins (% of energy intake) | |||||
| ≥ 3.12 min/wk | –2.9 ± 5.1 | 5 | 0.505 | N/A | |
| < 3.12 min/wk | –1.1 ± 2.4 | 5 | |||
Values are presented as mean ± standard deviation or median (1st quartile–3rd quartile). Cutoffs vary based on the median app usage of the specific subsample. *: GLTE score analyses are adjusted for university education, European descent, and investigation site because they significantly or marginally differed between usage groups in these analyses (Table S2). Fitbit® and dietary measure analyses could not be adjusted with multivariate models due to low sample sizes and are therefore shown as N/A. For statistical analyses, daily step count was transformed by 1/(10,000–x), MVPA was transformed by log (50–x), sodium was transformed by log (x + 2,000), proteins were transformed by log (x + 40), and carbohydrates (% of energy intake) were transformed by log (x + 30). GLTE: Godin Leisure Time Exercise questionnaire; LPA: light physical activity; MPA: moderate physical activity; MVPA: moderate-to-vigorous physical activity; VPA: vigorous physical activity.
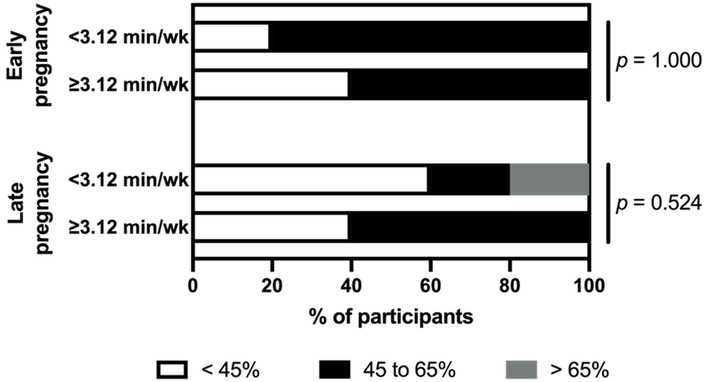
Proportions of participants who adhered to carbohydrate intake relative to total energy intake recommendations in early and late pregnancy. P values were obtained with Fisher test (n/group = 5).
Repeated measure analysis results are presented in Table 4 with grouping cutoffs specified for each outcome measure. A significant main effect of time was observed for Fitbit®-measured VPA time, which declined across pregnancy in the overall sample, as expected. A significant group*time interaction was also detected for protein intake (% of total dietary intake), showing a greater reduction in protein intake during pregnancy in the higher app usage group, but post hoc between-group comparisons for each time point were not significant (P = 0.691, 0.663, and 0.218 respectively). No other significant main effects of time or group*time interactions were found for the remaining lifestyle measures.
Associations between app usage levels and lifestyle repeated measures in pregnancy.
| Outcome measures | Early pregnancy | Mid pregnancy | Late pregnancy | P time | P group*time | |
|---|---|---|---|---|---|---|
| GLTE score* | ||||||
| ≥ 1.51 min/wk | 32.5 (16.0–46.0) | 31.0 (17.0–47.0) | 25.0 (15.0–46.0) | 0.646 | 0.669 | |
| < 1.51 min/wk | 14.5 (6.0–28.0) | 20.0 (10.0–37.5) | 15.0 (9.0–26.0) | |||
| Daily step count† | ||||||
| ≥ 3.12 min/wk | 5,905 ± 1,714 | 6,760 ± 2,423 | 6,265 ± 1,730 | 0.313 | 0.237 | |
| < 3.12 min/wk | 8,203 ± 3,286 | 7,780 ± 3,720 | 6,216 ± 1,475 | |||
| VPA time (min/d)† | ||||||
| ≥ 3.12 min/wk | 12.25 (6.79–16.36) | 13.29 (11.43–29.71) | 3.71 (0.33–10.00) | 0.022 | 0.576 | |
| < 3.12 min/wk | 9.29 (3.60–24.21) | 7.00 (2.32–21.50) | 1.25 (0.00–8.66) | |||
| MVPA time (min/d)† | ||||||
| ≥ 3.12 min/wk | 29.9 (14.6–33.4) | 42.7 (25.1–47.1) | 13.3 (3.7–29.6) | 0.103 | 0.559 | |
| < 3.12 min/wk | 21.7 (6.6–41.3) | 15.7 (9.5–31.8) | 6.0 (2.0–22.6) | |||
| MPA time (min/d)† | ||||||
| ≥ 3.12 min/wk | 15.3 (10.4–16.7) | 23.1 (13.7–29.7) | 9.6 (3.5–19.4) | 0.220 | 0.668 | |
| < 3.12 min/wk | 7.7 (2.6–13.7) | 8.5 (4.7–12.5) | 4.8 (2.0–12.9) | |||
| LPA time (min/d)† | ||||||
| ≥ 3.12 min/wk | 237 ± 85 | 205 ± 42 | 244 ± 31 | 0.758 | 0.273 | |
| < 3.12 min/wk | 259 ± 101 | 258 ± 85 | 241 ± 31 | |||
| Sedentary time (min/d)† | ||||||
| ≥ 3.12 min/wk | 700.9 ± 140.1 | 674.2 ± 96.6 | 720.2 ± 174.4 | 0.688 | 0.963 | |
| < 3.12 min/wk | 801.5 ± 235.2 | 749.0 ± 211.1 | 791.3 ± 165.9 | |||
| Energy (kcal/d)º | ||||||
| ≥ 2.85 min/wk | 1,711 ± 571 | 1,857 ± 606 | 2,070 ± 549 | 0.652 | 0.517 | |
| < 2.85 min/wk | 1,863 ± 427 | 1,664 ± 300 | 1,773 ± 477 | |||
| % of estimated energy intakeº | ||||||
| ≥ 2.85 min/wk | 54.3 ± 20.1 | 59.3 ± 20.9 | 66.3 ± 23.4 | 0.918 | 0.706 | |
| < 2.85 min/wk | 65.7 ± 15.5 | 58.2 ± 7.9 | 55.6 ± 18.2 | |||
| Lipids (g/d)º | ||||||
| ≥ 2.85 min/wk | 62.4 ± 20.8 | 71.7 ± 29.6 | 62.7 ± 20.6 | 0.880 | 0.424 | |
| < 2.85 min/wk | 72.6 ± 24.7 | 59.4 ± 11.3 | 64.5 ± 14.8 | |||
| Lipids (% of energy intake)º | ||||||
| ≥ 2.85 min/wk | 32.9 ± 2.4 | 33.6 ± 6.2 | 28.4 ± 11.5 | 0.655 | 0.320 | |
| < 2.85 min/wk | 35.3 ± 8.2 | 33.7 ± 4.9 | 34.1 ± 8.2 | |||
| Carbohydrates (g/d)º | ||||||
| ≥ 2.85 min/wk | 223 (205–254) | 240 (217–257) | 239 (210–265) | 0.930 | 0.976 | |
| < 2.85 min/wk | 228 (175–266) | 212 (188–248) | 236 (185–251) | |||
| Carbohydrates (% of energy intake)º | ||||||
| ≥ 2.85 min/wk | 50.6 ± 5.2 | 50.2 ± 7.2 | 41.1 ± 4.3 | 0.104 | 0.125 | |
| < 2.85 min/wk | 45.7 ± 8.0 | 49.9 ± 6.2 | 53.7 ± 19.1 | |||
| Fibres (g/d)º | ||||||
| ≥ 2.85 min/wk | 19.9 ± 7.6 | 21.7 ± 8.7 | 16.7 ± 4.4 | 0.339 | 0.798 | |
| < 2.85 min/wk | 17.2 ± 7.4 | 21.9 ± 7.8 | 18.0 ± 11.7 | |||
| Sodium (mg/d)º | ||||||
| ≥ 2.85 min/wk | 2,687 ± 763 | 2,783 ± 1,156 | 2,658 ± 1,595 | 0.984 | 0.889 | |
| < 2.85 min/wk | 2,635 ± 1,126 | 2,529 ± 719 | 2,794 ± 879 | |||
| Proteins (g/d)º | ||||||
| ≥ 2.85 min/wk | 74.1 ± 35.5 | 77.0 ± 29.2 | 69.3 ± 14.2 | 0.859 | 0.718 | |
| < 2.85 min/wk | 79.9 ± 10.0 | 69.5 ± 19.3 | 73.9 ± 23.9 | |||
| Proteins (% of energy intake)º | ||||||
| ≥ 2.85 min/wk | 16.5 ± 3.5 | 15.9 ± 1.9 | 13.6 ± 5.3 | 0.022 | 0.013 | |
| < 2.85 min/wk | 17.8 ± 3.1 | 14.9 ± 2.9 | 16.7 ± 2.0 | |||
Values are presented as mean ± standard deviation or median (1st quartile–3rd quartile). *: Early pregnancy: n = 30 and 26 per group respectively, mid pregnancy: n = 29 and 27 per group respectively, late pregnancy: n = 25 and 21 per group respectively; †: early pregnancy: n = 11 per group, mid pregnancy: n = 10 per group, late pregnancy: n = 9 and 8 per group respectively; º: early pregnancy: n = 8 and 5 per group respectively, mid pregnancy: n = 11 and 7 per group respectively, late pregnancy: n = 7 and 8 per group respectively. For statistical analyses, GLTE, VPA, MVPA, and MPA were transformed by log (x + 1), and carbs were simply log-transformed. GLTE: Godin Leisure Time Exercise questionnaire; LPA: light physical activity; MPA: moderate physical activity; MVPA: moderate-to-vigorous physical activity; VPA: vigorous physical activity.
In this uncontrolled clinical trial, users of the SmartMoms Canada app, an evidence-based mHealth lifestyle modification intervention, did not exhibit higher adherence to GWG recommendations compared to participants in a large Canadian, epidemiological study [12], though limitations may hinder comparability. Although these findings are preliminary, higher usage of the SmartMoms Canada app was significantly associated with lower odds of experiencing inadequate GWG. Mean weekly app usage was not associated with changes in PA, but higher usage was linked to a significantly smaller increase in carbohydrate intake as a proportion of total energy intake from early to late pregnancy. Overall, mean app usage in our sample was low, which suggests that the absence of more conclusive effects may be attributable to limited participant engagement with the app rather than a lack of intervention efficacy.
To our knowledge, this is the first study to assess associations between levels of engagement with an exclusively digital mHealth intervention and adherence to GWG recommendations, beyond previously published short-term preliminary findings from our trial [34]. Existing research evaluating the effects of standalone digital lifestyle programs targeting GWG management has been inconclusive. Among four mobile health interventions designed to promote healthy eating and PA habits in sedentary pregnant populations, none achieved significant reductions in rates of excessive GWG [47–50]. In contrast, Redman et al. (2017) [32] reported a 27-percentage point improvement in GWG guideline adherence among pregnant participants with a BMI ≥ 25.0 kg/m2 using the original US-based SmartMoms app in a randomized controlled trial. Although the SmartMoms Canada app is a customized version of the US product and retains key features such as data-driven feedback, the US-based version of the app included telehealth visits with healthcare professionals and was thus more intensive than the SmartMoms Canada intervention. In addition, our participants were not referred to the research team by their healthcare provider and were only contacted to collect data. Weekly push notifications from the app most likely did not prove sufficient incentives to use the intervention. These factors could explain discordances with our results.
A 2020 systematic review [31] of exclusively digital lifestyle interventions for pregnant women reported mixed results. Of the seven included studies, three reported beneficial effects on PA, a smaller decline in self-reported LPA and MPA [51], increased measured MVPA [52], and improved long-term PA levels [49] in mHealth groups vs. controls. In our sample, however, no significant associations were observed between app usage and changes in physical activity levels.
Regarding dietary outcomes, Rhodes’s 2020 systematic review found that only one out of the six studies assessing the effects of mHealth interventions on dietary behaviours found significant, positive results [31]. In our study, participants were instructed to complete food logs; however, only one significant association emerged: a higher app usage was linked to a smaller increase in carbohydrate intake as a proportion of total energy intake. Although statistically significant, this effect may not be clinically meaningful. Caution is needed when interpreting these results given the very small analytical sample and potential attrition bias—food log analyses were based on only 13% of our participants. More broadly, the lack of significant findings likely reflects limited statistical power, as the study was designed to detect small-to-moderate effect sizes across multiple lifestyle outcomes. This is important because the observed association between app usage and lower odds of insufficient GWG could be mediated by several non-significant lifestyle changes that collectively contribute to GWG outcomes.
App usage was analyzed as a categorical variable based on the median weekly usage rather than as a continuous measure. This approach was chosen to enhance the interpretability and clinical relevance, as associations between two continuous variables are less intuitive in clinical contexts. Using the median of weekly app usage ensured similarly sized groups, preserving statistical power, though it introduced somewhat arbitrary cut-offs. In the absence of an established threshold for “sufficient app usage”, the median split method was considered the most appropriate option given the limited sample size. It is also possible that app usage duration does not fully capture engagement with specific app features. For this reason, we examined the association between “Health” page use, which includes GWG information of participants, and GWG adherence. This analysis yielded similar results. Furthermore, overall app usage was strongly correlated with engagement across all app pages (Figure S1). Nonetheless, other potentially important dimensions of engagement—such as the quality of the interaction with app features or the intentionality behind usage—were not measured.
Collectively, the mean weekly SmartMoms Canada app usage was low in our sample. Most participants used the app for less than 2 minutes per week, and the highest registered mean usage time was 13.5 minutes per week, excluding usage of partner mHealth apps (i.e., Withings® and Fitbit® apps), which could not be measured. Previous research focusing on mHealth apps found that 44% of users engage for 1 to 10 minutes per day [53]. A study conducted in non-pregnant individuals reported that higher adherence to food logging is associated with lower body weight after a dietary intervention [54], and that goal setting and logging frequency are linked with greater weight loss in mHealth trials over 6 months [55].
Although two minutes of weekly engagement could theoretically be sufficient for users to access core app features, such as feedback on weight gain adequacy and PA tracking, more time would likely be required for consistent interaction with the SmartTips and exercise lists, which are the components presumed to drive detectable lifestyle changes. Thus, the lack of significant associations with excessive GWG and changes in lifestyle habits, especially for PA outcomes, may be due to low overall app adherence (low interaction with features), rather than lack of app effectiveness. While we were unable to disentangle these possibilities, future studies should consider participant interest in and motivation to use mHealth interventions. Strategies to enhance user engagement may also improve intervention effectiveness. For instance, endorsement or recommendation of an mHealth tool by a healthcare professional can increase uptake [56], and mHealth lifestyle interventions supported by clinicians tend to show greater effectiveness than standalone digital programs [26].
Low adherence was especially apparent given that 20% of participants never weighed themselves, 53% never wore the fitness and sleep tracker, and 67% never completed the food log—all core components of the apps’ feedback and self-monitoring features. Low app adherence was unexpected considering that a previous qualitative study conducted in a similar population found that most women in the perinatal period valued tracking their GWG in pregnancy [57]. Sociocultural factors, including the timing of the study during the later phase of the COVID-19 pandemic, may have contributed to reduced engagement.
A third of our study participants were lost to follow-up before the late pregnancy assessment. Those who dropped out had higher baseline levels of pre-pregnancy obesity, carbohydrate consumption, lower self-reported physical activity and were more likely to be of non-European ethnicity. These sociodemographic characteristics are associated with increased risk of excessive GWG [12, 58–60], suggesting that those who discontinued participation may have been the most likely to benefit from the features offered within the SmartMoms Canada app, especially considering that mean weekly app usage was lower in participants who abandoned the study. We hypothesize that if these participants had remained in the study and continued using the intervention, their modifiable risk factors for excessive GWG would have improved, potentially enhancing overall GWG adherence in our sample relative to Statistics Canada data. That said, our current data cannot confirm this hypothesis. Unfortunately, potential lack of interest in the app features or in continuing follow-ups could not be assessed. Although there was a satisfaction questionnaire that participants were asked to complete, those who were lost to follow-up during the study did not fill out the questionnaire.
Future research should explore strategies to improve both protocol and intervention adherence in participants. A 2017 descriptive qualitative study assessed the perceived acceptability, receptiveness, and potential feasibility of an earlier iteration of the SmartMoms Canada app, informing the design of the present trial [57]. That initial qualitative evaluation was conducted in Canada’s capital city, Ottawa, comprising a predominantly Caucasian and highly educated population. Given the 45% dropout rate and low intervention adherence observed among participants from the Winnipeg research site, a qualitative evaluation in this specific population might be valuable. Nevertheless, re-evaluating the acceptability of an mHealth intervention in a post-COVID-19 pandemic sociocultural context is warranted to determine whether earlier findings remain applicable. Based on our results and participant feedback, a version 2.0 update of the SmartMoms Canada app has been developed to enhance interactivity and expand the PA options for users, though limited changes could be applied due to its launch preceding the analyses done in this study. Its evaluation will provide valuable information relating to the effectiveness of these additional tools to improve user engagement and outcomes.
While our findings are the product of rigorous analyses, several limitations should be acknowledged. First, the absence of a true control group in our study design limits the ability to isolate intervention effects, precluding causal inferences between the SmartMoms Canada intervention and observed outcomes.
Second, there are differences between the historical control group and our sample that must be noted, which could impact their comparability. For instance, data from the MES were collected in 2005–2006 [12], approximately 15 years before our study recruitment. The prevalence of excessive GWG in the Canadian population may have increased between 2006 and 2021, as reported between 2009 and 2017 in the U.S. [61], especially considering the global increase in the prevalence of obesity that is particularly pronounced in North America [62], which would imply an underestimation of intervention effects in our study. Unfortunately, no reliable, up-to-date, Canadian data is available currently to verify this. On the other hand, the earlier timing of the MES reduces the probability of contamination by other mHealth interventions. Differences in data collection methods should also be considered: MES outcomes were based on self-reported data, including for GWG, whereas GWG was measured objectively in our study.
Third, high rates of loss to follow-up and missing data, even among participants who were assessed, limited statistical power, and introduced potential attrition bias, as discussed earlier. As such, our findings primarily apply to participants who remained in the study, especially for secondary outcomes where missing data were most prominent.
Fourth, GWG calculation was based on self-reported pre-pregnancy BMI, which tends to be underestimated [63]. This scenario may have inflated the proportion of participants classified as having excessive GWG and an underestimation of the proportion with inadequate GWG in our sample. Additionally, GWG categorization was based on the latest available weekly weight, which in some cases was recorded during the second trimester. Although our categorization accounted for gestational age at measurement, it may have introduced bias. However, second trimester excessive GWG is recognized as a strong predictor of total GWG, with sensitivities > 90% in Canadian pregnant women [64], and thus this limitation is unlikely to have substantially impacted our results.
Fifth, dietary intake was self-reported, which may have introduced desirability bias, leading to an overestimation of healthy food consumption and an underestimation of less healthy foods. Finally, Fitbit® fitness trackers are known to overestimate energy expenditure, with a mean error of 4% [65]. Nonetheless, we do not expect this limitation to have influenced between-group comparisons, as the bias is not presumed to differ across usage groups.
In conclusion, higher usage of the SmartMoms Canada app was associated with lower odds of experiencing insufficient—but not excessive—GWG, as well as with a small number of significant lifestyle changes, namely a lesser increase in carbohydrate consumption, within the context of a single-arm intervention trial. High dropout rates and low engagement with the intervention likely contributed to the limited number of significant findings. These results should be considered as exploratory, but they suggest that mHealth interventions may be most effective when used as an adjunct to clinician-led care rather than as standalone tools.
BMI: body mass index
EPDS: Edinburgh postnatal depression scale
GLTE: Godin Leisure Time Exercise
GWG: gestational weight gain
MES: Maternity Experiences Survey
MPA: moderate-intensity physical activity
MVPA: moderate-to-vigorous physical activity
PA: physical activity
The supplementary materials for this article are available at: https://www.explorationpub.com/uploads/Article/file/101197_sup_1.pdf.
We want to thank Kevin Semeniuk for his contribution in the study as the research coordinator and for the management of technical aspects of the study. We also wish to thank all study participants who volunteered to participate in our study. This study is part of C. Richer dit Laflèche’s Master’s dissertation which is publicly available in French [66].
CRdL: Formal analysis, Methodology, Visualization, Writing—original draft. SCS: Conceptualization, Funding acquisition, Methodology, Investigation, Writing—review & editing. LMR: Conceptualization, Funding acquisition, Methodology, Writing—review & editing. GXS: Conceptualization, Funding acquisition, Methodology, Writing—review & editing. JPB: Conceptualization, Funding acquisition, Methodology, Supervision, Writing—review & editing. KBA: Conceptualization, Funding acquisition, Methodology, Supervision, Writing—review & editing. All authors read and approved the submitted version.
The authors declare that they have no conflicts of interest.
The SmartMoms Canada study was approved by the REB of the University of Ottawa REB H-09-19-4795 and the REB of the University of Manitoba REB HS23407-H2019:448.
Informed consent to participate in the study was obtained from all participants.
Not applicable.
The raw data supporting the conclusions of this manuscript will be made available by the authors, without undue reservation, to any qualified researcher.
The study was funded by the Canadian Institutes of Health Research (Project Grant Program, [PJT-178360/2021]) and by the Public Health Agency of Canada (2015 Health Promotion and Chronic Disease Prevention Program, [1516-HQ-00057]). The funders had no role in study design, data collection and analysis, decision to publish, or preparation of the manuscript.
© The Author(s) 2026.
Open Exploration maintains a neutral stance on jurisdictional claims in published institutional affiliations and maps. All opinions expressed in this article are the personal views of the author(s) and do not represent the stance of the editorial team or the publisher.
Copyright: © The Author(s) 2026. This is an Open Access article licensed under a Creative Commons Attribution 4.0 International License (https://creativecommons.org/licenses/by/4.0/), which permits unrestricted use, sharing, adaptation, distribution and reproduction in any medium or format, for any purpose, even commercially, as long as you give appropriate credit to the original author(s) and the source, provide a link to the Creative Commons license, and indicate if changes were made.



View: 1065
Download: 22
Times Cited: 0


