 Commentary

Affiliation:
Grupo de Polímeros, Departamento de Química, Facultad de Ciencias, Universidad de Los Andes, Mérida 5101, Venezuela
Email: clarez@ula.ve
ORCID: https://orcid.org/0000-0001-8582-4380
Explor BioMat-X. 2026;3:101365 DOI: https://doi.org/10.37349/ebmx.2026.101365
Received: March 01, 2026 Accepted: May 07, 2026 Published: May 11, 2026
Academic Editor: Vasif Hasirci, Middle East Technical University, Turkey
The search for inexpensive raw materials for chitin production has led to the exploration of various natural resources, including some less conventional ones, such as plants and waste from the processing of various animals. In this context, the production of chitin from chicken bones and feet has been reported, attracting attention as a cheap and widely available source in some regions. However, to the best of our knowledge, birds do not possess genes that encode chitin synthases, the enzymes responsible for chitin biosynthesis. Therefore, this study analyzes the results reported in related articles, especially their FTIR spectra, to assess when the obtained material can be identified as chitin. The analysis revealed that, in some cases, there is poor agreement between the signals in these spectra and the characteristic signals established for well-characterized chitins, while in others, the spectra exhibit signals with a high noise-to-signal ratio that limits their use for identification. Furthermore, the X-ray diffraction studies reported in some of these works provide scarce support to confirm the presence of chitin in these materials. A search of two specialized databases confirmed that, to date, no results have been reported for genes expressing chitin synthases in birds. Finally, some recommendations are offered for properly addressing the studies necessary for the unambiguous identification of these materials.
Chitinous materials are widely distributed in nature and are among the oldest known, as demonstrated by their proven presence in fossil trilobites found in various parts of the world, some of them over 500 million years old [1]. Currently, these materials are found in a very large group of organisms, such as the cell walls of a wide variety of fungi, the exoskeletons of insects, the shells of crustaceans, etc., many of which have been exploited over time as inexpensive sources for obtaining chitin [2]. Chitin, in turn, is the starting material for the industrial production of chitosan, its best-known derivative due to the multiple applications it has found in the modern world [3].
More recently, numerous studies have also reported the extraction of chitin from unconventional sources such as the fruit of the plant commonly known as luffa [4], fish scales [5], and chicken feet [6–9], which need to be definitively confirmed. In the specific case of chicken feet, the presence of chitin appears unexpected, given that, as far as current knowledge indicates, birds do not possess genes encoding chitin synthases, the key enzymes required for chitin biosynthesis. Thus, this commentary article aims to briefly analyze the results reported in previous articles on chitin extraction from chicken bones and feet to assess whether the materials obtained can be considered chitin. The analysis focuses on two aspects: a) the presence or absence of genes encoding chitin synthases or related enzymes in chickens, and b) the evidence presented, especially the FTIR studies, to identify these materials.
A search for chitin synthase genes in vertebrates using the National Library of Medicine database of the National Center for Biotechnology Information (NCBI) [10] yielded a total of 848 records, broken down as follows: 732 for ray-finned fish, 48 for cartilaginous fish, 42 for lampreys, 22 for amphibians, 3 for hagfish, and 1 for lungfish, but no records were found for birds. An additional search using the Genome Browser Gateway of the Genome Institute, University of California, Santa Cruz [11], also yielded no results for chitin synthase genes in birds, including the common chicken (Gallus gallus). These results would indicate that the material obtained is not chitin, given the inability of the chickens to synthesize it. However, it is necessary to be a little cautious about the subject because the production of chitin in mammals had been denied some time ago and, currently, it has been found in several mammal species, i.e., the developing lumen of zebrafish, in epithelial cells of fish scales, and in at least three different cell types in salamander larvae [12]. Furthermore, the situation is more complex than it initially appears, as chitin could theoretically be obtained in several ways: a) the presence of non-endogenous chitin in the raw material, i.e., due to fungal contaminants (although this seems difficult to justify given the relatively high percentages of chitin obtained), b) chitin production through pathways other than chitin synthase, such as the proposed mechanism to produce chitin oligomers in humans [13].
Regarding this last point, it is important to consider that there is a possibility that GlcNAc chains can be formed without the mediation of any chitin synthase, as it has been proposed to occur at the beginning of the formation of hyaluronic acid (HA) chains, a reaction catalyzed by hyaluronan synthases (HAS) [14, 15]. It has been established that HAS forms a primer made up of between 7–9 GlcNAc units before alternately joining GlcNAc units with glucuronic acid (GA) to form HA [13]. Additionally, some genes that initially did not show obvious homologies with known genes, i.e., the specific gene of the endoderm in embryos of the frog Xenopus laevis, DG42 [16], have been subsequently found to show similarities with fungal chitin synthases [17] and rhizobium NodC genes, known to synthesize chitin oligomers [18].
While these findings do not definitively prove that vertebrates can generate macromolecular chitin in the absence of chitin synthase, they do leave open the possibility that this could occur. Thus, it is necessary to consider conducting future research on possible genes that encode other synthases with similar activity, perhaps under conditions where the addition of GlcNAc to the chains is favored by some specific conditions, e.g., a higher concentration of N-acetylglucosamine.
In general, FTIR spectroscopy is an excellent technique for identifying materials such as chitin and chitosan. In the case of chitin, the most important characteristic signals have already been widely established, showing little variation even when the chitin comes from different sources. Table 1 shows some of the most used for its identification, noting that, in general, their standard deviations are less than 6 cm–1, although obviously these values will depend on the studies employed to obtain them.
Some of the FTIR signals used for chitin identification.
| Signal(cm–1) | Work reference | Average | ± SD | ||||||||
|---|---|---|---|---|---|---|---|---|---|---|---|
| [19] | [20] | [21] | [21] | [22] | [23] | [24] | [25] | [26] | |||
| O–H stretching | 3,448 | 3,439 | 3,431 | 3,433 | 3,436 | 3,433 | 3,447 | 3,440 | 3,444 | 3,439 | 6 |
| C–H stretching | 2,883 | 2,885 | 2,889 | 2,882 | 2,877 | 2,890 | 2,891 | 2,885 | 5 | ||
| Amide I (A) | 1,660 | 1,662 | 1,653 | 1,656 | 1,649 | 1,652 | 1,652 | 1,660 | 1,660 | 1,656 | 5 |
| Amide I (B) | 1,627 | 1,630 | 1,622 | 1,622 | 1,621 | 1,621 | 1,619 | 1,627 | 1,623 | 1,624 | 4 |
| Amide II (N–H flexion) | 1,558 | 1,560 | 1,555 | 1,555 | 1,553 | 1,555 | 1,555 | 1,553 | 1,556 | 2 | |
| Amide III (C–N flexion) | 1,312 | 1,319 | 1,308 | 1,312 | 1,307 | 1,308 | 1,310 | 1,312 | 1,311 | 4 | |
| C–O stretching | 1,021 | 1,025 | 1,011 | 1,015 | 1,008 | 1,011 | 1,020 | 1,016 | 6 | ||
On the other hand, it is important to note that when these materials come from non-traditional sources, other techniques may be necessary to confirm results. Among these techniques, some simple ones can be employed, such as elemental analysis, which allow to establish the C/N ratio (~6.86 for pure chitin) and, from this, determine its purity [27], and the X-ray diffraction (XRD) studies, which are based primarily on the position and sharpness of the characteristic peaks in its spectra, i.e., α-chitin usually shows: a) an intense and sharp peak between 9.3–9.6° (reflection plane 020), b) a peak usually less intense between 12.7–12.9° (plane 021), c) the peak of greatest intensity between 19.2–19.7° (plane 110) and d) some minor peaks between 23.3–24.6° confirming the orthorhombic crystal structure, while β-chitin shows only two prominent signals: i) a peak between 8.5–9.1° (plane 020) and ii) a peak between 20.1–20.3 which confirm its monoclinic structure [28]. Additional techniques on chitin characterization can be found in numerous reviews dedicated to this topic [29, 30]. Furthermore, testing the obtained materials as substrates for chitinolytic (or deacetylases) enzymes could also provide additional information for the identification of these materials [31].
Regarding the evidence provided by researchers who have reported obtaining chitin from chicken bones and feet, it is mostly based on FTIR analysis of the obtained materials. Unfortunately, the analyses performed in these works show some flaws because either their signals (S) have been firmly assigned despite being heavily masked by noise (probably due to the presence of water in the sample) as can be seen in Figure 1 [6], or their match with the reference signals (Sr) is very low [7–9] (see Table 2). Table 2 also includes chitin signals obtained from other traditional sources (crab [32] and shrimp [19]), whose spectra are of acceptable quality for analysis and show the values of the main characteristic signals. The chitin spectrum signals from shrimp [19] have been used as references (Sr) for comparison. Similarly, the signals from chondroitin sulfate (CS), obtained from chicken keels [33], and HA, obtained from chicken combs [34], have also been included for comparison. For all the signals compared, a reasonable match was considered when S is within the interval Sr ± 6 cm–1, where the value of 6 cm–1 has been chosen because it is the highest value of the standard deviation obtained for the chosen signals (Table 1). The FTIR signals from crab chitin [32] (obtained from a clear spectrum) showed a 75% of agreement with the reference signals (2,925 cm–1, 1,661 cm–1, 1,558 cm–1, 1,417 cm–1, 1,315 cm–1, and 1,074 cm–1).
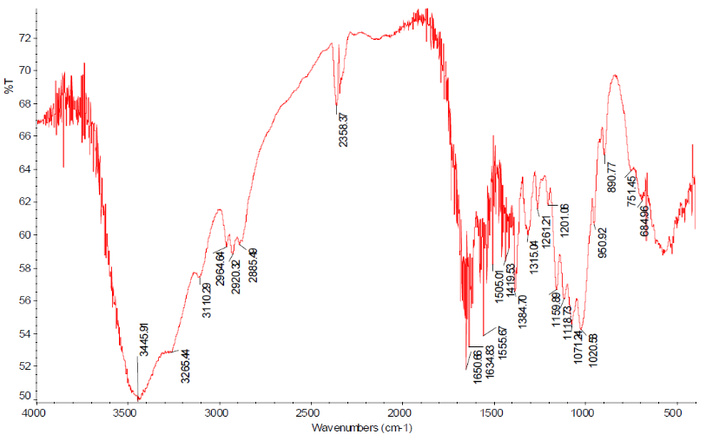
FTIR spectrum of the material reported as chitin obtained from chicken feet. Reprinted from [6]. © 2012 Jalal AF, et al. Licensed under a CC-BY.
Comparison of FTIR signals of materials obtained from chicken bones and feet with signals of standard chitins, chondroitin sulfate (CS), and hyaluronic acid (HA).
| Product (chicken feet) [6] | Product (chicken feet) [7] | Product (chicken bones) [8, 9] | Chitin (crab) [32] | Chitin (shrimp) [19] | CS (chicken keel) [33] | HA (chicken comb) [34] |
|---|---|---|---|---|---|---|
| Signals (cm–1) | ||||||
| 3,479 | ||||||
| 3,446ab | 3,433* | 3,431 | 3,436 | 3,448 | 3,452 | |
| 3,349 | ||||||
| 3,265a | 3,268 | |||||
| 3,201 | ||||||
| 3,110a | 3,106 | |||||
| 2,965a | 2,980 | 2,965 | ||||
| 2,920bc | 2,921abc | 2,925abc | 2,927 | 2,925 | 2,925 | |
| 2,885a | 2,866 | 2,885a | 2,883 | |||
| 2,358** | 2,360** | |||||
| 1,651 | 1,661a | 1,660 | ||||
| 1,635c | 1,621a | 1,627 | 1,632 | 1,638 | ||
| 1,574 | 1,588 | |||||
| 1,556a | 1,538 | 1,558a | 1,558 | |||
| 1,505 | 1,455 | 1,441 | ||||
| 1,420ac | 1,414ac | 1,417ac | 1,422 | 1,427 | 1,420 | |
| 1,385b | 1,376 | 1,384 | ||||
| 1,315a | 1,331 | 1,315a | 1,312 | |||
| 1,261a | 1,251a | 1,255 | ||||
| 1,201 | 1,228 | |||||
| 1,160ab | 1,157 | 1,160 | ||||
| 1,119ab | 1,113ac | 1,113 | 1,121 | |||
| 1,071a | 1,056 | 1,074a | 1,072 | 1,064 | ||
| 1,021ac | 1,029c | 1,021 | 1,023 | |||
| 951a | 966 | 957 | 927 | |||
| 891a | 896 | 859 | ||||
| 826 | ||||||
| 751a | 746 | 721 | ||||
| 685 | 689 | 698 | 669 | |||
The superscripts indicate the agreement of the analyzed signals with reference signals of chitin (a), CS (b), and HA (c). *: Mentioned in the paper but not observed in the spectrum. **: CO2 signal.
On the other hand, three of the materials obtained from chicken showed low agreement values for their signals, 30% (2,921 cm–1, 1,414 cm–1, and 1,113 cm–1) [7] and 33% (2,285 cm–1, 1,621 cm–1, and 1,251 cm–1) [8, 9], some of which also showed agreement with the CS and HA signals. Importantly, the spectra of these materials do not show the essential chitin signal around 1,554–1,560 cm–1 (amide II). Moreover, the two studies that used XRD to confirm the identity of chitin [8, 9] reported spectra that were unsuitable for analysis because, apart from starting at 20° (a region beyond where the “fingerprint” of chitin appears), they show sharp signals that seem to correspond more to inorganic crystals.
Regarding the other reported material [6], their FTIR signals showed a 70% of agreement with the reference signals and with a FTIR spectrum of standard chitin obtained under the same conditions [6]; however, its signals are not clear in some regions, exhibiting a high noise/signal ratio (perhaps due to the presence of moisture in the sample as it has been previously mentioned), which prevents an unambiguous assignment of many of them. This situation complicates the irrefutable identification of this material as chitin, without considering the lack of other analyses and the aggravating factor that several of its signals also coincide with those of CS (3,446 cm–1, 2,920 cm–1, 1,385 cm–1, 1,160 cm–1, and 1,119 cm–1) and HA (2,920 cm–1, 1,635 cm–1, 1,420 cm–1, 1,385 cm–1, 1,261 cm–1, and 1,020 cm–1). Thus, obtaining better FTIR spectra and performing additional analyses to confirm the identity of this material is essential in this case.
The extraction of chitin from chicken bones and feet has been reported in several studies. However, an examination of the limited evidence supporting these findings has shown that further work is needed to definitively establish the identity of the materials obtained. The identification presented to date is based primarily on the analysis of FTIR spectra of the obtained materials, which exhibit significant shortcomings such as: a) poor agreement of their signals with those reported for standard chitin samples, b) absence of important signals in some of them (amide II), c) spectra with a high noise-to-signal ratio (likely caused by moisture in the sample used to obtain the spectrum), etc. Furthermore, when complementary analyses were performed to confirm the presence of chitin, e.g., XRD studies, the spectra show a region (2θ > 20°) above where the chitin fingerprint appears. It is important to emphasize that the new studies to be addressed should consider the following points: i) Since no genes encoding chitin synthases have been reported in birds to date, a definitive confirmation of the chitin presence in these materials would imply a non-endogenous origin or its biosynthesis by a mechanisms that do not involve chitin synthases, ii) the identification of the materials obtained should be based on a battery of tests, which do not necessarily have to be carried out using advanced studies such as some of the nuclear magnetic resonance spectroscopic techniques; these can be carried out using simpler studies such as elemental analysis, XRD, comparison of the materials obtained with standard chitins as substrates for chitinolytic enzymes and/or deacetylases, iii) if FTIR spectroscopy is used, which is a very suitable technique for these purposes, emphasis should be placed on obtaining clean spectra, so that the signals can be assigned with low uncertainties.
HA: hyaluronic acid
XRD: X-ray diffraction
CLV: Conceptualization, Investigation, Writing—original draft, Writing—review & editing. The author read and approved the submitted version.
The author declares that there are no conflicts of interest.
Not applicable.
Not applicable.
Not applicable.
Not applicable.
Not applicable.
© The Author(s) 2026.
Open Exploration maintains a neutral stance on jurisdictional claims in published institutional affiliations and maps. All opinions expressed in this article are the personal views of the author(s) and do not represent the stance of the editorial team or the publisher.
Copyright: © The Author(s) 2026. This is an Open Access article licensed under a Creative Commons Attribution 4.0 International License (https://creativecommons.org/licenses/by/4.0/), which permits unrestricted use, sharing, adaptation, distribution and reproduction in any medium or format, for any purpose, even commercially, as long as you give appropriate credit to the original author(s) and the source, provide a link to the Creative Commons license, and indicate if changes were made.

View: 561
Download: 6
Times Cited: 0
