 Original Article

Affiliation:
Department of Biomedical Engineering, Rutgers, The State University of New Jersey-New Brunswick, Piscataway, NJ 08854, US
†The authors contributed equally to this work.
ORCID: https://orcid.org/0009-0009-4817-0627
Affiliation:
Department of Biomedical Engineering, Rutgers, The State University of New Jersey-New Brunswick, Piscataway, NJ 08854, US
†The authors contributed equally to this work.
ORCID: https://orcid.org/0009-0000-5194-0877
Affiliation:
Department of Biomedical Engineering, Rutgers, The State University of New Jersey-New Brunswick, Piscataway, NJ 08854, US
Affiliation:
Department of Biomedical Engineering, Rutgers, The State University of New Jersey-New Brunswick, Piscataway, NJ 08854, US
ORCID: https://orcid.org/0000-0003-2489-4275
Affiliation:
Department of Biomedical Engineering, Rutgers, The State University of New Jersey-New Brunswick, Piscataway, NJ 08854, US
ORCID: https://orcid.org/0000-0003-3344-337X
Affiliation:
Department of Biomedical Engineering, Rutgers, The State University of New Jersey-New Brunswick, Piscataway, NJ 08854, US
Email: mv582@soe.rutgers.edu
ORCID: https://orcid.org/0000-0002-6184-3103
Explor BioMat-X. 2025;2:101335 DOI: https://doi.org/10.37349/ebmx.2025.101335
Received: December 17, 2024 Accepted: March 15, 2025 Published: April 14, 2025
Academic Editor: Ajay Vikram Singh, German Federal Institute for Risk Assessment (BfR), Germany
The article belongs to the special issue Bioinspired Material for Regenerative Medicine
Aim: This study evaluated the impact of retinal extracellular matrix (ECM) and key biomaterial substrates on the motility of transplantable retinal cells with genomic manipulation, using the therapeutic molecule, Topoisomerase II beta (Top2b), as a model.
Methods: Tests first applied in ovo electroporation to examine the effects of a pharmacological Top2b inhibitor (ICRF-193) on progenitor motility and development of embryonic retina. Complementary qRT-PCR tests measured changes in select cadherin molecules in response to treatment. In vitro transfection produced cultured retinal progenitor cell groups with Top2b overexpression and Top2b knockdown. Differences in the adhesion and motility of Top2b altered groups, compared to wildtype cells, were measured upon biomaterial substrates used in emerging transplantation matrixes.
Results: Data illustrated significant differences in the number and spacing of retinal ganglion cells when retina was treated with ICRF-193, as well as downregulation of several key cadherin molecules. Cultured retinal progenitors with Top2b knockdown and Top2b overexpression exhibited different expression of chemotactic receptors, adhesion parameters, and modalities of migration upon substrates of laminin, poly-L-lysine, and collagen IV. Significant changes in cell morphology and surface area were also measured compared to wildtype cells.
Conclusions: Corroborating in vivo and in vitro data support Top2b as a therapeutic target for retinal progenitor motility but indicate significant differences in the migration of Top2b altered cells upon substrates used in transplantation. These data highlight the therapeutic advantages of bioinspired materials developed to aid the motility of replacement cells with modified genetic expression to improve transplantation outcomes across the nervous system.
Adult vision loss is a growing and worldwide public health challenge with degenerative disorders, such as age-related macular degeneration, diabetic retinopathy, and glaucoma, expected to increase dramatically within aging populations [1, 2]. Regenerative medicine offers promising strategies to treat adult retinal disorders through cell replacement therapy, where specialized biomaterials are used to transplant groups of donor stem-like cells to replace degenerated or dysfunctional neurons (reviewed in [3]). Contemporary usage of hydrogels [4–6], decellularized matrix [7, 8], and scaffolds [9–11] for donor cell delivery has significantly increased cell survival to enable quantitative bioengineering study of transplantation processes. In complement, replacement cells have become increasingly genetically manipulated to replicate desired properties of highly specialized neurons [12, 13]. Indeed, modern genomic editing has achieved selective gene expression within native cell groups to alleviate the well-known challenges of immune rejection and inadequate differentiation reported when adding new genetic material [14]. While this novel biotechnology provides newfound opportunities for therapeutic genomic targets, the downstream implications of gene editing, silencing, or manipulation on cell-cell and cell-matrix behaviors remain underexplored. Significantly, changes to these fundamental cell processes can be positively or negatively amplified when combined with matrix substrates used in transplantable biomaterials.
Bioinspired materials designed to support replacement cells with specialized gene expression hold great promise for transplantation therapy [15], as the donor cells must adhere and migrate within the delivery matrix prior to their infiltration into damaged host [16, 17]. Our group has previously applied in vitro modeling to report that principal matrix proteins can directly impact cell communication [18], as well as stimulate collective and individual cell migration [19, 20]. Abilities to regulate distinct and/or hybrid modalities of cell cohesion and motility using biomaterials are exciting tools with which to promote the infiltration of replacement cells.
Transplantation in the retina is an excellent model to develop bioinspired materials in synergy with genomic editing because the eye is a self-contained and largely immune-privileged system. Moreover, practical surgical procedures in the eye have been developed for a variety of animal models [21], while established imaging techniques facilitate monitoring of donor cell behaviors over time [22]. The human retina is a multi-laminated structure that is populated by interconnected networks of neurons and glia across three principal layers, as per Figure 1. In brief, light refracted into the eye is first absorbed by rod and cone photoreceptors of the outer nuclear layer (ONL) that synapse with secondary neurons of the inner nuclear layer (INL), i.e., horizontal, amacrine, and bipolar cells shown. Secondary neurons then synapse with retinal ganglion cells of the ganglion cell layer (GCL), which are projection neurons that deliver photochemical signals to the brain through the optic nerve. Importantly, retinal homeostasis is facilitated by Muller glia cells that maintain osmotic and ionic balance for neuronal synapse [23] as well as by the inner (IPL) and outer plexiform layers (OPL) that serve as retinal extracellular matrix (ECM) to facilitate synaptic communication across the specialized groups of neurons [24].
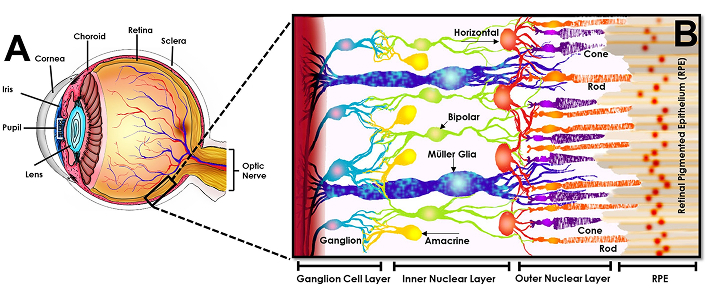
Schematic of the healthy adult retina. The human retina is a complex structure composed of specialized retinal neurons and Muller glia (MG) connected across three synaptic layers. The retinal pigment epithelium [9] is a single cell layer that lies between the neuroretina and choroid. Rod and cone photoreceptors interdigitate with RPE (retinal pigmented epithelium) but reside in the outer nuclear layer (ONL). Photoreceptors synapse across the outer plexiform layer (OPL) with secondary neurons in the inner nuclear layer (INL), i.e., the horizontal, amacrine, and bipolar cells shown. These secondary neurons then synapse across the inner plexiform layer (IPL) to communicate with retinal ganglion cells within the ganglion cell layer (GCL). These final, projection neurons transmit signals to the brain through the optic nerve. Modified from [25], CC-BY 4.0
Novel biomaterials are heavily investigated for the transplantation of retinal ganglion cells in the GCL [26, 27] significant to progressive vision loss in adults. Recent genomic targets for these cell replacements include DNA topoisomerases that regulate conformational changes in DNA topology during cell growth to affect migration, differentiation, and synapse (reviewed in [28]). The Topoisomerase II beta (Top2b) enzyme is important to the transcriptional regulation of genes needed in retinal development and has become an attractive regenerative target for its impacts on progenitor motility [29, 30]. Independent studies have demonstrated the mechanistic role of Top2b in the regulation of migration-targeted pathways, including via Rho GTPase signaling, and integrin-mediated adhesion (reviewed in [30–32]). The previous study from our group has demonstrated involvement of Top2b in the proper development and survival of postmitotic, retinal neurons [33, 34], suggesting that biomaterials developed to guide the adhesive and migratory behaviors of donor cells with modified Top2b expression have novel potential to promote the infiltration of replacement cells.
This study examined how changes in the expression of Top2b impacted in vivo motility in developing retina as well as in vitro cell migration upon transplantable matrix and protein substrates. Pharmacological inhibition of Top2b was observed to decrease cell-to-cell communication and cell alignment within GCL layers at early differentiation stages in embryonic day 6 (E6). Cultured replacement cells with persistent Top2b knockdown (Top2b-KD) and Top2b overexpression (Top2b-OE) exhibited varied expression of chemotactic receptors and significant differences in migration. Data additionally illustrated preferential attachment of Top2b-KD and Top2b-OE cell groups upon different matrix components, as measured by changes in the cell surface area and adhesive morphology. These corroborating results highlight the advantages of developing bioinspired materials to guide the infiltration of cell replacements with modified gene expression to improve transplantation outcomes.
Fertilized specific pathogen-free (SPF) white leghorn chicken eggs (Charles River Laboratories, Wilmington, MA, USA) were maintained at room temperature (25°C) for 2 h before being placed in an incubator at 37.5°C with 60% humidity. The eggs were incubated for 96–100 hr (~4 days) to procure chick embryos at developmental stage embryonic day 1–4 (E1–E4) or Hamburger-Hamilton stages (HH) 12–22.
Subretinal injections and in ovo electroporation of embryos at E4 were performed as per the literature [35, 36] and shown in Figure 2. Briefly, the amnion and vitelline membranes were carefully removed with fine, sterile forceps to expose the embryo. For retinal injection, capillary glass pipettes (1.4 mm diameter; Drummond Scientific Company, Broomall, PA, USA, 2-000-001) were pulled with a microelectrode puller to get a 20 mm taper tip. The tip was broken under a dissecting microscope using a tweezer to obtain a tip opening approximately 0.1 μm in diameter. The microneedle was loaded with a mixture of 500 μM of the Top2b inhibitor ICRF-193 (Santa Cruz Biotechnology, Dallas, TX, USA, 21416-68-2) dissolved in HIBERNATE® media (Gibco, Thermo Fisher Scientific, Waltham, MA, USA, A1247501). Many contemporary studies have applied the commercial molecule tested to inhibit both Top2b and Top2a [37, 38]. However, our study focused on cell migration, which is a cell process known to be regulated by Top2b rather than Top2a [39, 40]. Further, Top2a expression is mainly observed in proliferating cells, rather than in the post-mitotic cells used in this study [41]. Hence, the inhibitory effect of ICRF-193 in postmitotic cells that undergo migration is largely specific to Top2b. This commercial inhibitor was chosen because of its widespread usage in both in vivo and in vitro projects [40, 42, 43]. Further, the concentration used in testing was selected to corroborate published studies [40, 42, 43].
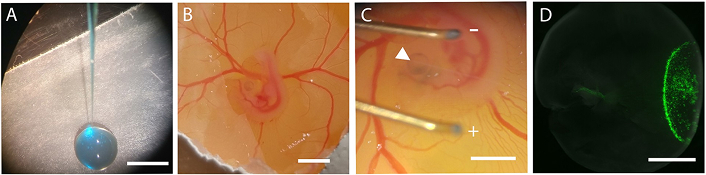
Summary of in ovo retinal injection and electroporation used to deliver pharmacology. (A) A microneedle is loaded with the Top2b inhibitor (blue) within a GFP plasmid solution for visualization. (B) The microneedle is inserted within an E4 chick embryo. (C) Electroporation of the eye is performed using a pulse generator (arrows point to electrodes) to (D) deliver reagent within the retina. Scale bar = 1 mm. E4: embryonic day 4
The reporter pCAG-GFP plasmid solution with a concentration ranging 3–6 μg/μL and 0.2 μL of fast green (0.025%) (MilliporeSigma, Burlington, MA, USA, 2353-45-9) was attached to a 0.1 mL syringe (Hamilton Company, Reno, NV, USA, Gastight Model 1710) for visual confirmation of solution delivery and mounted onto a manual micromanipulator (WPI, Sarasota, FL, M3301-M3-R) with a small piece of masterflex silicone tubing on the syringe needle. The mixture was injected directly into the embryonic subretinal space, and the embryo was electroporated with 5 square pulses of 15 V for 50 ms with 950 ms intervals using a pulse generator (BTX Harvard Apparatus, Boston, MA, USA, ECM 830). GFP expression was used as a marker to locate retinal tissue affected by the Top2b inhibitor ICRF-193.
Chick embryos post-E4 retinal injections were harvested from the shell and euthanized by decapitation at E6 and E12. The eyes were harvested and transferred to a petri dish of cold 1× PBS (phosphate buffer saline; Thermo Fisher Scientific, Waltham, MA, USA, BP3994). The retinal pigmented epithelium [9] was carefully dissected using fine forceps, and the cornea, lens, and vitreous were removed. The retinal tissue was then fixed in 4% paraformaldehyde (PFA) (Thermo Fisher Scientific, Waltham, MA, USA, AA433689L) in 1× PBS overnight at 4°C, followed by three times cold PBS wash for 10 min at 4°C and then infiltrated overnight in 30% sucrose (in 1× PBS). Embryos injected with the GFP-reporter plasmid constructs were verified for successful transfection via retinal inspection with a fluorescent dissection microscope (Leica Microsystems, Wetzlar, Germany, Leica MZ16FA), before embedding the retinal tissues in a solution of optimal cutting temperature compound (OCT, Electron Microscopy Sciences, Hatfield, PA, USA). Tissues embedded in OCT were stored at –80°C until ready for sectioning. Embedded tissue samples were sectioned using a cryostat to obtain sections of 12-μm-thickness (Thermo Fisher Scientific, Waltham, MA, USA, 0620E) and mounted on super-frost slides (Thermo Fisher Scientific, Waltham, MA, USA, 12-550-15S24), followed by air-drying. Immunohistochemistry using cell-specific markers was performed immediately afterwards.
Immunostaining was performed using Shandon Slide Rack (Thermo Fisher Scientific, Waltham, MA, USA). Slides containing tissue sections were placed on a warming plate for 15 min to remove excess OCT medium (Fisher Healthcare, Waltham, MA, USA, 23-730-571). Sections were then fixed with drops of 4% PFA, followed by 3 washes of 1× PBS for 10 min. Retinal sections were incubated for 1 hr in blocking solution [0.05% Triton X-100, 3% BSA, 10% goat serum or donkey serum (VWR, Radnor, PA, USA, 80054-446), in 1× PBS] at room temperature, followed by primary antibody overnight. Primary antibodies and dilutions used were as follows: mouse anti-Brn3a (1:200; MilliporeSigma, Burlington, MA, USA, AB5945) mouse, mouse Tuj1 (1:1,000; Abcam, Cambridge, UK, ab18207), mouse Calretinin (1:2,000; Chemicon, Rolling Meadows, Illinois, USA, MAB1568) and mouse Parvalbumin (1:1,000; Millipore, Burlington, MA, USA, MAB1572). Opposing control slides were not applied with any primary antibody. All slides were then washed with 1× PBS followed by the application of a secondary antibody carrying fluorescence from the appropriate host (mouse 594 nm, 1:300 dilutions; Jackson Immuno Research, West Grove, PA, USA, 715-585-150) for 1 hr. The slides were washed with 1× PBS and air dried, and a coverslip was placed on top to seal the samples using Cytoseal-60 (Thermo Fisher Scientific, Waltham, MA, USA, 50-252-72) for image analysis.
Retinal progenitor cells were commercially purchased (R28; Kerafast, Boston, MA, USA, EUR201) and cultured for testing. Growth media was prepared under sterile conditions using 89% Dulbecco’s Modified Eagle’s Medium (DMEM; ATCC, Manassas, VA, USA, 30-2002), 10% fetal bovine serum (FBS; Thermo Fisher Scientific, Waltham, MA, USA, 26140087), and 1% Pen-Strep (Gibco, Thermo Fisher Scientific, Waltham, MA, USA, 15-140-122). Cells were grown in ventilated, T-25 flasks (VWR, Radnor, PA, USA, 29185-300) for 4–5 days until near confluency. Growth medium was then aspirated, and cells were incubated with 3 mL of Trypsin (Gibco, Thermo Fisher Scientific, Ontario, CA, 25200-072) at 37°C for 5 min to dislodge adherent cells. Trypsin was then neutralized with 8 mL of R28 media and cells were pipetted into a 15 mL centrifuge tube and centrifuged at 1,500 rpm for 5 min. The supernatant was aspirated, and the cell pellet was resuspended in 3 mL of fresh R28 growth medium. The cells were then re-seeded in a new T-25 flask at 106 cells per mL and incubated at 37°C and 5% CO2 until confluency.
A series of 24-well plate (VWR, Philadelphia, PA, USA, 29442-044) were coated with 15 μg/mL laminin (LM) (Corning, NY, USA, 354239) and incubated for 24 hr. Confluent cells were plated at a density of 0.5 × 10⁵ cells/mL with MEM media. Cells were incubated for 24 hr and allowed to attach. Transductions were performed using a lentiviral vector (Origene, Rockville, MD, USA, TL516385V, labeled with GFP) with a multiplicity of infection (MOI) of 1.5. The lentiviral vector was mixed with the medium, added to the cells, and incubated for 24 hr. The media was replaced after 24 hr and cells were fixed with 4% PFA (Thermo Fisher Scientific, Waltham, MA, USA, AA433689L) and stained for the desired receptor expression. Transfections were performed using the Lipofectamine™ 3000 Transfection Kit (Thermo Fisher Scientific, Carlsbad, CA, USA, L3000015, labeled with GFP). The Lipofectamine 3000 agent was diluted in MEM media. The master mix was prepared by diluting the DNA (VectorBuilder, Chicago, IL, USA, VB900007-6027zju) with MEM media and adding the P3000 reagent and was incubated for 10–15 min. The master mix was added to the cells and incubated for 4 days. Live transfected cells were then selected for antibiotic resistance using a 2.5 mg/mL solution of puromycin dihydrochloride (Gibco, Thermo Fisher Scientific, Waltham, MA, USA, A1113803), as per Figure S1.
Cells were seeded in 24-well plates (VWR, Philadelphia, PA, USA, 29442-044) at a concentration of 2.5 × 10⁵ cells/mL and allowed to attach for 24 hr. Solutions of media from each well were removed, wells were washed 3 times with Dulbecco’s phosphate-buffered saline (DPBS; Sigma-Aldrich, Allentown, PA, USA, D8537), and cells were fixed with cold PFA (4%) for 5 min. Then, wells were washed with DPBS for 5 min twice at room temperature. Blocking buffer solution (0.05% Triton X-100, 2% donkey serum, and 3% BSA in DPBS) was added to each well for 15 min at room temperature. Following, wells were washed twice with DPBS for 2 min, and a primary antibody for the receptors was added to each well for overnight incubation: CXC chemokine receptor 4 (CXCR4; Invitrogen, Carlsbad, CA, USA, PA5-19856), fibroblast growth factor receptor (FGFR1; Invitrogen, Carlsbad, CA, USA, PA5-104788), and vascular endothelial growth factor receptor (VEGFR1; Proteintech, Rosemont, IL, USA, 13687-1-AP). The next day, each well was washed 3 times with 1× DPBS for 2 min, followed by the addition of secondary antibodies (Alexa Fluor 647 AffiniPure; ImmunoResearch Laboratories, Inc., West Grove, PA, USA, 711-605-152) 1 hr at room temperature. Wells were washed 3 times with 1× DPBS for 2 min before addition of DAPI (1:1,000; Thermo Fisher Scientific, Carlsbad, CA, USA, D1306) into each well for 5 min at room temperature. Each well was washed with DPBS 3 times for 2 min.
Boyden chamber assays (Sigma-Aldrich, St. Louis, MO, USA, ECM506) were used to examine the motility of each cell group toward a given concentration of different growth factors. Cells were seeded in the upper chamber of the well assay and allowed to settle on the upper surface of the membrane overnight. Growth factor solutions were then added to the media in the lower reservoir, and cells were left to migrate for 6 hr to through the transwell membrane, as described previously by our group and many others (Reviewed in [44]).
Transwell inserts used a polyester (PET) membrane (VWR, Radnor, PA, USA, 89235-020) of 10 μm thickness and 8.0 μm pore size. Approximately 600 μL of each growth factor vascular endothelial growth factor (VEGF; R&D Systems, Minneapolis, MN, USA, 564-RV), fibroblast growth factor-8 (FGF-8; Invitrogen, Carlsbad, CA, USA, PHG0184), and stromal derived factor 1-a (SDF-1a; Sigma Aldrich, St. Louis, MO, USA, SRP3276) was added to the bottom of separate transwell assays. Cells were seeded on the membrane at a concentration of 2.5 × 10⁵ cells/mL within media at 5% CO2 and 37°C and left to incubate for 6 hr. After incubation, cells remaining on the top membrane were removed using a wet cotton swab. Control cells were stained with calcein-AM (Thermo Fisher, Burlington, ONT, CA, C1430) and reconstituted in PBS. Only live, fluorescent cells validated via optical microscopy were used for experiments.
A parameter called the Cell Migration Index, CMI, was defined to numerically compare the results of motile cells in response to different chemoattractants and control experiments (medium only). CMI is defined as the ratio of average numbers of motile cells in response to an exogenous growth factor and the average number of motile cells in control wells, as shown:
where the subscript i denotes the reagent in a specific well measured, ni represents the number of motile cells in that well, and “Ncontrol” is the average number of motile cells in control wells, per experiment.
Concentrations of 15 μg/mL LM (Corning, Corning, NY, USA, 354239), 20 μg/mL poly-L-lysine (PLL) (Sigma Aldrich, St. Louis, MO, USA, P4707), and 20 μg/mL collagen IV (CIV) (Sigma Aldrich, St. Louis, MO, USA, C6745-1ML) were used to coat inner surfaces of 24-well plates (Falcon Corning, Corning, NY, USA, 353047). Uncoated polystyrene wells (VWR, Philadelphia, PA, USA, 29442-044) were used as a control. The plate was incubated at 37°C for 1 hr. Then, cells were seeded at 45,000 cells/mL in a 24-well plate. Five images were taken of each well using brightfield. This was repeated every 4 hr for 24 hr. A parameter called Cell Shape Index (CSI) was used to evaluate cell morphology, defined as:
where P is the cell perimeter and A is the cell area. A CSI value of 0 represents a purely circular cell while a value of 1 represents a purely elongated cell [45].
Expression levels of four genes encoding adhesion molecules were measured using quantitative, real time polymerase chain reaction (qT-PCR): cadherin 2 (Cdh2), cadherin 6B (Cdh6B), cadherin 7 (Cdh7), and cadherin 8 (Cdh8). Primer specificity was verified using Basic Local Alignment Search Tool (BLAST), which confirmed the selected forward and reverse primers listed. A FASTA sequence of desired species specific (Gallus gallus) mRNA was acquired from NCBI nucleotide database as shown in Table 1.
Design of specific primers for qRT-PCR of chick retina
| Name | PCR product (bp) | Primer sequence |
|---|---|---|
| Cdh2 | 426 | Forward: AGCTGACCAACCTCCAACAGReverse: TGTACTTTCTCTCTGTCGAGCC |
| Cdh6B | 269 | Forward: CCCCCAGAGCACCTACCAATReverse: ATCGAGGGTCCACGTGAGTA |
| Cdh7 | 319 | Forward: GACCCTTCAGCGACATGACAReverse: TGTGCTGGATTCTGACTCTCC |
| Cdh8 | 289 | Forward: TGGTGATTTGCGTAGCTTGTGReverse: TCTGTATGTAACCGGCCAACT |
Primer pairs were selected based on PCR product size (200–300 bp) and analyzed using IDT’s oligo analyzer tool. Primers were examined for hairpin loop structures, high ∆G values and annealing temperature range Tm values for specificity and reliability. Relative gene expression data were analyzed using the conventional 2–ΔΔCt (DDCT) method [46].
Microscopic images were analyzed using an upright fluorescence microscope (Zeiss Axio Imager A1) with a monochrome digital camera Axiocam MRM (Zeiss, Oberkochen, Germany). Images were acquired to confirm cell-specific markers in 549 nm, 594 nm, and 647 nm channels. Images were captured at the same exposure and threshold, and at the same intensity per condition. Cells that were modified to overexpress or knockdown Top2b expression were evaluated for CSI, surface area, and migration if they displayed a GFP tag after 24 hr of incubation. Each well was imaged five times, and ImageJ software was used to evaluate 5 cells per image for CSI, surface area, and migration distance. Fluorescing cells were counted using ImageJ.
Each in vitro data set was collected from replicates using n = 4 per condition, with five images collected per well containing at least five cells per image. A Shapiro-Wilks test was performed to assess the normality of the data. Cell migration was analyzed with two-way ANOVA with Tukey’s post-hoc test. Surface area index and CSI were analyzed with two-way ANOVA with Dunnett’s post-hoc test. Cell receptor expression was evaluated using Kruskal-Wallis rank test with Dunn’s multiple comparisons post-hoc test. Significance was denoted as (*) p < 0.05, (**) p < 0.01, (***) p < 0.001, and (****) p < 0.0001.
The first set of tests examined the effects of pharmacological Top2b inhibition using the well-established chick model of retinal embryonic development [47]. Tests combined our previous methodology of in ovo retinal injection with electroporation to deliver ICRF-193, a known potent topoisomerase II inhibitor [48]. Figure 3 depicts histological sections of developing chick retina at embryonic day E6 and E12, treated and untreated with the Top2b inhibitor ICRF-193. Images of E6 illustrate the nuclei (DAPI staining in blue) of neuronal cells within the outer (ONBL) and inner neuroblastic layer (INBL), which are early developmental stages of the ONL, INL, alongside the GCL. Tests first examined differences in the neuronal marker beta tubulin III (Tuj1), a structural component of the microtubule network expressed during the earliest stages of neuronal differentiation in the chick retina [49]. As shown (Figure 3A, 3B), both the number and intensity of Tuj1+ retinal cells (red) in the INBL were significantly reduced via Top2b inhibition compared to control retina. Top2b inhibition additionally disrupted cellular arrangement of the INBL layer at E6, as its thickness was significantly reduced compared to control and INBL cell arrangement depicted wide spacings not observed in control retina. Images gathered at the later differentiation stage of E12 illustrate nuclear staining of neuronal cells (DAPI in blue) within the developed retinal ONL, INL, and GCL. In addition, OPL and IPL separate the cell layers at this developmental stage, as marked. Data (Figure 3C, 3D) illustrate no significant differences observed in the number of Tuj1+ cells between Top2b-treated and control retinas at E12. Moreover, differences in the thickness of GCL layers were insignificant (as shown by arrows).
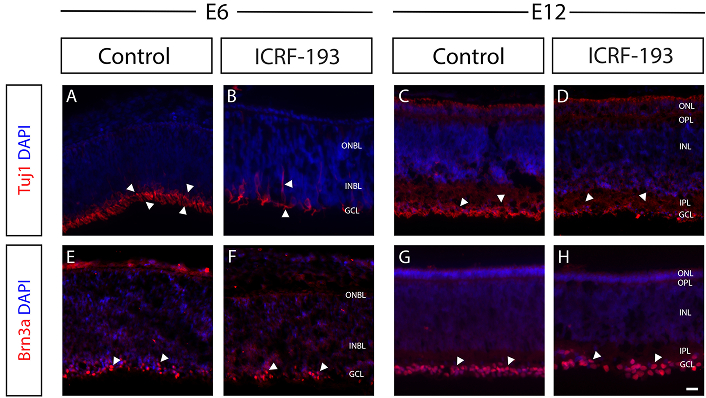
Inhibition of Top2b delays the development and alignment of the ganglion cell layer (GCL). Representative fluorescence images of immunostained sections of chick embryonic retina treated with a commercial Top2b inhibitor (ICRF-193) against control at embryonic developmental day E6 and E12. Neurofilaments of the developing inner plexiform layer (IPL) were stained with anti-Tuj1 (A–D), and retinal ganglion cells were stained using anti-Brn3a (E–H). All cell nuclei were stained with DAPI (in blue). At E6, Tuj1+ labeled processes of retinal ganglion cells (RGCs) in the control retinas (A), but its expression was widespread and reduced in the ICRF-193 treated sections (i.e., Top2b inhibited) (B). Brn3a+ cells were located in the GCL of control retinas (E) but were more widely dispersed and formed grouped cell masses in the inner neuroblastic layer (INBL) and outer neuroblastic layer (ONBL) in ICRF-193 treated retinas. At E12 no significant differences (D) in Tuj1+ expression or in (H) numbers of Brn3a+ cells were observed. Arrowheads indicate Tuj1+ or Brn3a+ cells. Scale bar = 50 μm. E6, E12: embryonic day 6, day 12; GCL: ganglion cell layer; ONL: outer nuclear layer; OPL: outer plexiform layer; INL: inner nuclear layer; IPL: inner plexiform layer
Retinal slices were next examined for differences in expression of the marker Brn3a, a transcription factor critical to the differentiation of dendritic arbors that regulate function in retinal ganglion cells [50, 51]. Images at E6 (Figure 3E, 3F) reveal that Brn3a+ cells (red) were located uniformly along the INBL in control retinas but observed to be unevenly dispersed along the INBL of Top2b-inhibited retina. Moreover, Brn3a+ cells were highly clustered in ICRF-193 treated retinas, but not in control (denoted by arrows). By E12, however, Top2b-inhibited retinas and illustrated no significant differences in cell clustering within the GCL compared to control (Figure 3G, 3H).
Control and Top2b-inhibited retina were additionally studied for changes in the expression of calretinin and parvalbumin, two calcium-binding proteins that regulate calcium transport and neuronal excitability [52, 53]. Figure 4 illustrates decreases in the expression of calretinin (red) across cells of the INBL between control and ICRF-193 treated retina at E6. As shown, decreased levels were observed along a significantly thinner INBL (Figure 4A, 4B). However, no difference in calretinin expression or GCL thickness was observed by E12 (Figure 4C, 4D). Retinas stained for parvalbumin similarly showed lowered expression in cells of the INBL between control and ICRF-193 treated retina at E6. Moreover, arrows point to significant reduction of INBL thickness with lower expression of parvalbumin (Figure 4E, 4F). By E12, however, changes in parvalbumin expression within the GCL were insignificant across control and treated retina (Figure 4G, 4H).
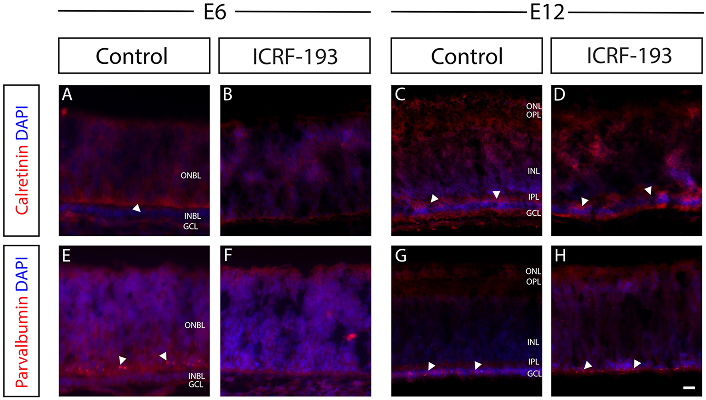
Top2b inhibition disrupted calcium signaling across retinal ganglion cells (RGCs). Representative fluorescence images of immunostained sections of chick embryonic retina treated and untreated with a commercial Top2b-inhibitor (ICRF-193) at E6 and E12. Neurofilaments were stained with anti-calretinin (A–D) and intracellular calcium-binding proteins with anti-parvalbumin (E–H; in red). Cell nuclei were stained with DAPI (in blue). At E6, calretinin-labeled neurofilaments in both the GCL and outer neuroblastic layer (ONBL) (A), while its expression was dramatically reduced in ICRF-193 treated (Top2b inhibited) retinas (B). Arrowhead indicates the inner neuroblastic layer (INBL). Parvalbumin expression was detected in the RGCs at the INBL-ONBL boundary (E, arrowheads), but not detected in ICRF-193 treated retina (F). At E12, the control and ICRF-193 treated samples showed no significant differences in calretinin (C, D) or parvalbumin expression (G, H). Scale bar = 50 μm. E6, E12: embryonic day 6, day 12; GCL: ganglion cell layer; ONL: outer nuclear layer; OPL: outer plexiform layer; INL: inner nuclear layer; IPL: inner plexiform layer
Our study next examined differences in the gene expression of adhesion molecules known to be significant to cell to cell signaling and GCL formation [54]. Tests applied qRT-PCR between developing retina treated and untreated with Top2b inhibitor ICRF-193 to illustrate relative changes in the gene expression of four critical cadherin molecules in E6–E12 retina: Cdh2, Cdh6B, Cdh7, and Cdh8. Figure 5 illustrates that levels of gene expression for all cadherin molecules were lower for Top2b-treated retina than control from E6–E10. However, the relative expression of Cdh2, Cdh6B, Cdh7, and Cdh8 was insignificant (p > 0.05) between control and Top2b-inhibited retina by E12.
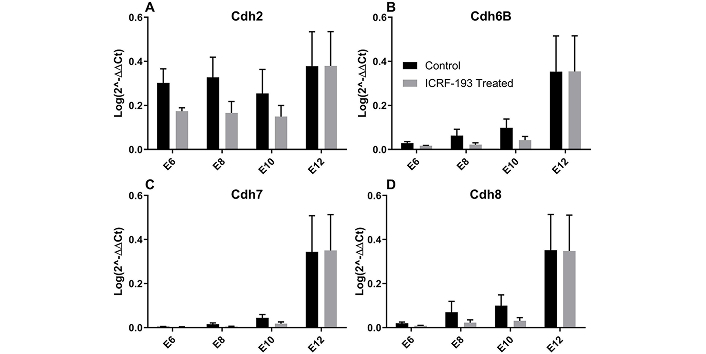
Relative expression of genes for cadherin molecules as determined by qRT-PCR using the 2–ΔΔCt (DDCT) method. Relative expressions of (A) Cdh2, (B) Cdh6B, (C) Cdh7, and (D) Cdh8 are shown at E6 through E12 for embryonic chick retina treated with a commercial Top2b inhibitor (ICRF-193) against control. E6–E12: embryonic day 6–12
Experiments next manipulated a heterotypic, retinal progenitor cell line previously reported to contain a majority of retinal ganglion cells [55] to develop two distinct cultured cell groups with different profiles of Top2b expression. Top2b-KD were produced through in vitro transfection with a Top2b-shRNA (shTop2b) plasmid construct previously established by our group [29], and Top2b-OE were developed via transfection with a plasmid encoding Top2b cDNA. Retinal progenitor cells with unaltered Top2b expression are denotes as wildtype or Top2b-WT. Figure 6 illustrates Top2b-induced differences measured in the expression of 3 chemotactic receptors of interest to retina: VEGFR (receptor for VEGF ligand), FGFR (receptor for FGF-8 ligand), and CXCR4 (receptor for SDF-1a, also known as CXCL12). As seen, no significant differences (p > 0.05) were measured in the expression of VEGFR between Top2b-WT, Top2b-KD, and Top2b-OE cell groups. However, expression of FGFR was significantly higher for Top2b-WT than Top2b-KD (p < 0.01), while FGFR expression of Top2b-KD cells was not significantly different against Top2b-OE (p > 0.05). By contrast, Top2b-OE cells exhibited dramatic increases in the expression of CXCR4, with average intensity values that were 2.5× higher than Top2b-WT (p < 0.05). VEGFR and FGFR expressions in Top2b-OE cells were only slightly higher than Top2b-WT (p > 0.05).

Cultured retinal progenitor cell groups with Top2b overexpression (OE) and knockdown (KD) illustrate altered expression of select chemotactic receptors compared to wildtype cell groups with no Top2b manipulation (WT). Cell groups illustrated significant differences in the expression of selected chemotactic receptors: vascular endothelial growth factor receptor (VEGFR1), fibroblast growth factor receptor (FGFR1), and c-x-c chemokine receptor 4 (CXCR4, receptor for the stromal cell-derived factor 1, SDF-1a, ligand). Statistical significance across the cell groups is denoted by p-value: * < 0.05, ** < 0.01, **** < 0.0001 as via two-way ANOVA tests followed by Dunnett’s post-hoc test
Top2b-KD, Top2b-OE, and Top2b-WT cell groups were next exposed to external growth factors to examine the effects of Top2b expression on chemotaxis. Cell migration was evaluated using the Cell Migration Factor, CMI (Eq. 1), which normalized the number of motile cells of the Top2b-WT group towards the media only condition (no added growth factors, CMI = 1.0). Figure 7 shows that Top2b-WT cells migrated with a lower CMI value to FGF than to media control (p < 0.05), with a larger CMI value to VEGF relative to media control (p < 0.05). Cells of the Top2b-WT group exhibited migration with comparable CMI between SDF-1a and the media control (p > 0.05). Motile Top2b-KD cells produced lower CMI values than Top2b-WT cells, with a CMI value of 0.02 ± 0.058 compared to media control. Top2b-KD cells migrated in lower numbers to all growth factors studied, with a CMI of 0.13 ± 0.155 to FGF (p < 0.05), CMI of 0.15 ± 0.295 to VEGF (p < 0.05), and CMI of 0.08 ± 0.185 to SDF-1a (p = 0.05). Lastly, smaller total numbers of Top2b-OE cells migrated toward media control than those of the Top2b-WT cell group, with a CMI value of 0.56 ± 0.42. Top2b-OE cells migrated in higher numbers than Top2b-KD cells but in lower numbers than Top2b-WT cells to all growth factors relative to media control. Motile Top2b-OE cells displayed an average CMI of 0.19 ± 0.009 to FGF (p < 0.01), CMI of 0.32 ± 0.216 to VEGF (p < 0.05), and a CMI of 0.35 ± 0.151 to SDF-1a (p < 0.05).
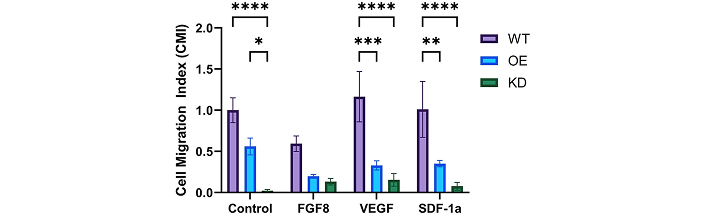
Top2b manipulation altered the measured chemotactic migration of cultured progenitor cell groups. The migration of cells with Top2b overexpressed (OE) and knockdown (KD) was measured against wildtype cells without manipulation, Top2b-WT (WT). Data is represented using the cell migration index, CMI, which normalized the number of motile cells by the number of WT motile cells to the control (media solution only). Statistical significance is denoted by p-value: * < 0.05, ** < 0.01, *** < 0.001, **** < 0.0001 as per Kruskal-Wallis with Dunn’s post-hoc test
The final set of experiments measured morphological differences between Top2b-KD, Top2b-OE, and Top2b-WT cell groups attached upon LM, PLL, CIV, and polystyrene (PST, used as control). These materials were selected for study because they (a) have each been well studied in mechanisms of cell adhesion [56], (b) are components of many contemporary biomaterials [26], and (c) have been examined previously by many groups with retinal progenitors for applications in transplantation [15, 18, 57].
Data represents cell morphology using the parameter of CSI commonly applied to denote varying levels of cell elongation significant to functional matrix adhesion [58]. Figure 8A shows that average CSI values of Top2b-WT cells were observed to decrease over 24 hr for all surface polymers used. As seen (Figure 8A-1), values of CSI upon PST (as control) were highest immediately after plating, with an initial value of 0.95 ± 0.06 that decreased to a minimum value of 0.49 ± 0.09 at 24 hr. CSI of Top2b-WT cells adhered upon CIV followed a similar pattern, with a maximum value of 0.87 ± 0.05 after plating and a minimum CSI of 0.44 ± 0.11 at 24 hr. By contrast, cells of the Top2b-WT group adhered upon LM with an initial CSI of 0.86 ± 0.09, but then decreased sharply after 12 hr. The CSI of these cells upon LM reached a minimum of 0.36 ± 0.15 after 24 hr. Lastly, the CSI values of Top2b-WT cells adhered upon PLL illustrated the largest and sharpest decrease in values, with a maximum of 0.77 ± 0.09 upon plating and a minimum of 0.36 ± 0.08 after 24 hr. In all cases, groups of Top2b-WT cells exhibited large changes in adhesion within the first 12 hr of overnight attachment, and illustrated small changes in the proceeding 12 hr. Statistical significance is shown per time point against PST (used as control).
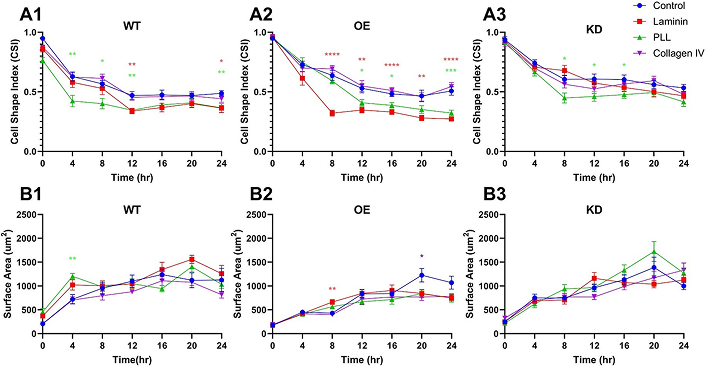
Substrates stimulate different adhesion responses from progenitor cell groups with modified Top2b manipulation. Calculations for the Cell Shape Index (CSI) of retinal progenitors with wildtype Top2b (WT) expression (A1), Top2b overexpression (OE) (A2), and Top2b knockdown (KD) modified (A3) illustrate different morphologies upon substrate proteins of control (glass, polystyrene), laminin, poly-L-lysine (PLL), and collagen IV. Changes in cell surface area (SA) are similarly denoted for retinal progenitors with wildtype Top2b expression (WT) (B1), Top2b overexpression (OE) (B2), and Top2b knockdown (KD) (B3) upon the same substrate molecules. Statistical significance against control is denoted by p-value: * < 0.05, ** < 0.01, *** < 0.001, **** < 0.0001 as per two-way ANOVA followed by Tukey’s post-hoc test
The adhesion of Top2b-KD cells exhibited similar patterns of adhesion upon PST (control) surfaces with average CSI values of ~0.95 for all conditions. CSI values decreased upon each matrix substrate over 24 hr, with the lowest CSI of 0.42 ± 0.15 measured upon PLL (p < 0.05). In contrast to the group of Top2b-WT cells, adhesion of Top2b-KD cells upon LM illustrated slower changes over time. Further, adhesion of Top2b-OE cells displayed similarly decreasing values of average CSI upon matrix substrates but demonstrated a dramatic decrease for adhesion upon LM. As seen, while all CSI values approached 1.0 upon initial plating, the CSI of Top2b-OE cells upon LM decreased sharply after only 8 hr and reached a minimum value of 0.47 ± 0.09 after 24 hr (p < 0.05). Top2b-OE cells also exhibited increased CSI during adhesion upon PLL and CIV compared to PST (control).
Lastly, cell adhesion was assessed via changes in the average surface area of each cell group, as shown in Figure 8B. Top2b-WT cells exhibited the largest average surface area upon LM (p < 0.05), with statistically insignificant changes (p > 0.05) upon PLL or CIV (Figure 8B-1). By contrast, the highest average surface area of Top2b-KD cells was measured upon PLL (p < 0.05) (Figure 8B-2) and highest upon PST for Top2b-OE cells (Figure 8B-3), with insignificant differences on all other surface matrices (p > 0.05).
Regenerative medicine offers promising treatment for adults with degenerative vision loss through cell replacement therapy, which transplants donor stem cells to replace dysfunctional and apoptotic neurons. Contemporary replacement cells have become increasingly bio-engineered using genomic editing to recapitulate explicit responses of specialized retinal neurons [59]. How these novel, edited cells interact with the biomaterials developed for their transplantation is critical, as migratory responses upon and within the biomaterial initiate the infiltration of replacement cells needed within the retinal host. The current study evaluated how bioinspired materials can be developed to support the transplantation of cells with manipulated gene expression of Top2b as a model target for retinal cell replacements.
Top2b has received renewed interest in transplantation therapy because of its well-established regulation of genes critical to the differentiation and motility of retinal progenitors [33, 34]. Recent studies demonstrated that knock out models of Top2b resulted in the systemic death of both vertebrate and invertebrate animals [30, 60], while selective deletion of Top2b was able to alter the lamination of developing retina in mice [33, 34] and zebrafish [61]. This project first examined the impact of pharmacological Top2b inhibition on early retinal development (E6) using the commercial molecule ICRF-193, a known catalytic inhibitor widely used in cancer therapy [62, 63]. Treatment with ICRF-193 produced lower numbers of cells in the retinal GCL, an overall thinner GCL layer with irregular cellular spacing, and reduced levels of differentiation (Figure 3). While ICRF-193 has been widely used as a Top2b inhibitor in prior studies, the molecule may exhibit partial activity against other topoisomerases (e.g., Top2a) to confound mechanistic interpretations. However, our study focused on the migration of postmitotic cells, which preferentially express Top2b, rather than Top2a [39–41]. Hence, the inhibitory effect of ICRF-193 in postmitotic cells that undergo migration is largely specific to Top2b. This effect is consistent with observed migration defects in Top2b knockout mice studies [29, 30, 34]. Moreover, Top2b inhibition reduced calcium signaling between cells within the GCL (Figure 4), suggesting dysregulation in neuronal signaling due to reduced cell interactions with plexiform layers. This comprehensive data highlights Top2b as a therapeutic target for cell replacement therapy with understudied impacts on cell-to-matrix interactions able to alter cell motility.
Pharmacological inhibition of Top2b additionally downregulated expression of cadherin molecules significant to cell-to-cell cohesion (Figure 5). This result is novel because it points to the roles of cell-to-cell adhesion molecules in promoting different modalities of migration. De/differentiated cells are well-known to respond to external stimuli via collective behaviors, such as clustering and organoid formation [64–66] that can lead to collective migration. Downregulation of Top2b may, therefore, inadvertently promote individual cell migration, which may be beneficial or detrimental to the migration of replacement cells upon selected biomaterials for transplantation. Interestingly, few studies have considered the collective responses of replacement cells upon transplantation matrix or within adult host ECM [67, 68]. These results validate the interplay of Top2b regulation with ECM components in retina, as each of these fundamental processes depends upon cell interactions with developing plexiform layers, which serve as retinal ECM for their constituent, structural proteins essential to synaptic connections between neurons. Our data highlights new opportunities for development and/or application of bioinspired materials able to attenuate or promote these behaviors to improve transplantation outcomes.
As the effects of pharmacological inhibition were predictably depleted by later embryonic stages (in this study E12), we next examined effects of Top2b regulation in transfected cells to selected cytokines significant to retinal development [69, 70]. Top2b-OE cells illustrated significantly higher expression of FGFR1 and CXCR4, while expression of all receptors in Top2b-KD cells was less than Top2b-WT (i.e., no Top2b modifications) cell groups (Figure 6). As expected, Top2b-KD cells were then observed to migrate in the lowest numbers towards all growth factors. However, Top2b-OE cells failed to exhibit higher migratory responses than the wildtype group (Figure 7) despite the higher expression of cognate cell receptors. We note that existing data support the specificity of Top2b knockdown and knockout in migration phenotypes [30, 33, 34] and also address concerns about off-target effects. Future work will perform mechanistic study to explore Top2b rescue and downstream effectors. We hypothesize that this result is due to collective cell migration, where motile clusters with an average size larger than the pores of the transwell membrane were unable to migrate across the assay. Our group has previously reported the upregulation of cadherin in cultured wildtype progenitors with higher expression of CXCR4, as well as demonstrated the clustering and collective motility responses of de/differentiated retinal cells [19, 20, 71]. Our current results are consistent with published data and underscore future studies to apply our microfluidic devices to image clustered cell migration [20].
Our final set of tests examined how Top2b regulation impacted cell adhesion upon substrates used for transplantable biomaterials, as Top2b-KD cells exhibited elongated morphology upon PLL while Top2b-OE cells exhibited the most elongation upon LM (Figure 8). The larger values of CSI measured from the different adhered cell groups suggest that modification of Top2b expression impacts the selection of constituent substrates needed to develop biomaterials that promote infiltration. These underexplored impacts of gene manipulation provide new opportunities for development of bioinspired materials to aid the migration of replacement cells into retinal host. This has high clinical relevance because it indicates that biomaterials can be paired to genetically modified Top2b cells to augment cell migration into host retina. This is a highly underexplored first step in achieving the integration desired via transplantation. We also note that while Top2b was used as a model in our study, the data highlight selective pairing of ECM components with cells modified for specific characteristics, in complement to development of compound biomaterials with properties that better mimic physiological conditions. Future study will apply established microfluidics-approach to visualize gene edited cell groups for the average size and distribution of cell clusters [25] and to evaluate how this collective modality can be enhanced or attenuated upon different biomaterial substrates. Future experiments will also utilize CRISPR technology to produce retinal progenitor cell groups with altered Top2b regulation for long term culture and transplantation study.
In summary, development of transplantable materials is a crucial aspect of cell replacement therapy that must incorporate the modalities of cell behavior upon matrix substrates. Stem cell replacements for dysfunctional retinal neurons are increasingly gene-edited and/or manipulated, which often impacts cell-to-cell and cell-to-matrix responses needed to stimulate infiltration into retinal host. Bioinspired materials able to modulate the nature and modalities of adhesion and migratory responses of transplanted cells have great potential to advance transplantation outcomes.
Cdh2: cadherin 2
CIV: collagen IV
CMI: Cell Migration Index
CSI: Cell Shape Index
DPBS: Dulbecco’s phosphate-buffered saline
E6: embryonic day 6
ECM: extracellular matrix
FGFR: fibroblast growth factor receptor
GCL: ganglion cell layer
INBL: inner neuroblastic layer
INL: inner nuclear layer
IPL: inner plexiform layer
LM: laminin
OCT: optimal cutting temperature
ONL: outer nuclear layer
OPL: outer plexiform layer
PBS: phosphate buffer saline
PFA: paraformaldehyde
PLL: poly-L-lysine
PST: polystyrene
SDF1-a: stromal derived factor 1-a
Top2b: Topoisomerase II beta
Top2b-KD: Topoisomerase II beta knockdown
Top2b-OE: Topoisomerase II beta overexpression
VEGFR: vascular endothelial growth factor receptor
The supplementary figure for this article is available at: https://www.explorationpub.com/uploads/Article/file/101335_sup_1.pdf.
The co-authors thank Ms. Larissa Oprysk for her contributions to the development of figures.
ACD, ARL, BR: Validation, Writing—review & editing. RR: Data curation. LC: Conceptualization, Writing—review & editing. MV: Conceptualization, Supervision, Writing—original draft, Writing—review & editing. All authors read and approved the submitted version.
The authors declare that they have no conflicts of interest.
All of the animal experiments were waived by the Institutional Animal Care and Facilities Committee at Rutgers University. Chick embryos up to embryonic day 18 (E18) are not considered vertebrates by the Institutional Animal Care and Facilities Committee (IACUC) at Rutgers University. Thus, the embryos (E1–E12) studied in this project are not subject to IACUC approval.
Not applicable.
Not applicable.
The raw data supporting the conclusions of this manuscript will be made available by the authors, without undue reservation, to any qualified researcher.
This work was supported by the National Institutes of Health [R21 EY031439-01]. The funders had no role in study design, data collection and analysis, decision to publish, or preparation of the manuscript.
© The Author(s) 2025.
Open Exploration maintains a neutral stance on jurisdictional claims in published institutional affiliations and maps. All opinions expressed in this article are the personal views of the author(s) and do not represent the stance of the editorial team or the publisher.
Copyright: © The Author(s) 2025. This is an Open Access article licensed under a Creative Commons Attribution 4.0 International License (https://creativecommons.org/licenses/by/4.0/), which permits unrestricted use, sharing, adaptation, distribution and reproduction in any medium or format, for any purpose, even commercially, as long as you give appropriate credit to the original author(s) and the source, provide a link to the Creative Commons license, and indicate if changes were made.

Sunil Choudhary ... Donato Gemmati
Vladimir Karpiuk ... Olga Ponkina
Zhaoying Ma ... Jan T. Czernuszka
Ashkan Farazin, Seyedeh Farnaz Darghiasi
