 Original Article

Affiliation:
1Faculty of Engineering, Uninettuno University, 00186 Rome, Italy
2Laboratory of Electrophysiology for Translational Neuroscience, Institute of Cognitive Sciences and Technologies – National Research Council, 00185 Rome, Italy
Email: karolina.armonaite@uninettunouniversity.net
ORCID: http://orcid.org/0000-0001-5763-490X
Affiliation:
1Faculty of Engineering, Uninettuno University, 00186 Rome, Italy
Affiliation:
1Faculty of Engineering, Uninettuno University, 00186 Rome, Italy
3Dipartimento di Impresa e Management, LUISS University, 00198 Rome, Italy
ORCID: http://orcid.org/0000-0001-6880-8477
Explor Neuroprot Ther. 2023;3:139–150 DOI: https://doi.org/10.37349/ent.2023.00043
Received: February 10, 2023 Accepted: April 26, 2023 Published: June 30, 2023
Academic Editor: Rafael Franco, Universidad de Barcelona, Spain
The article belongs to the special issue The Urgent Need for New Hypotheses to Develop Effective Therapeutic Tools Against Alzheimer's Disease
Aim: Up to date many successful attempts to identify various types of lesions with machine learning (ML) were made, however, the recognition of Alzheimer’s disease (AD) from brain images and interpretation of the models is still a topic for the research. Here, using AD Imaging Initiative (ADNI) structural magnetic resonance imaging (MRI) brain images, the scope of this work was to find an optimal artificial neural network architecture for multiclass classification in AD, circumventing the dozens of images pre-processing steps and avoiding to increase the computational complexity.
Methods: For this analysis, two supervised deep neural network (DNN) models were used, a three-dimensional 16-layer visual geometry-group (3D-VGG-16) standard convolutional network (CNN) and a three-dimensional residual network (ResNet3D) on the T1-weighted, 1.5 T ADNI MRI brain images that were divided into three groups: cognitively normal (CN), mild cognitive impairment (MCI), and AD. The minimal pre-processing procedure of the images was applied before training the two networks.
Results: Results achieved suggest, that the network ResNet3D has a better performance in class prediction, which is higher than 90% in training set accuracy and arrives to 85% in validation set accuracy. ResNet3D also showed requiring less computational power than the 3D-VGG-16 network. The emphasis is also given to the fact that this result was achieved from raw images, applying minimal image preparation for the network.
Conclusions: In this work, it has been shown that ResNet3D might have superiority over the other CNN models in the ability to classify high-complexity images. The prospective stands in doing a step further in creating an expert system based on residual DNNs for better brain image classification performance in AD detection.
In the turning point of the appearance of chat generative pre trained transformer (ChatGPT), which is based on the transformers and is able to generate novel content, rather than simply analyse existing data like expert systems, one might be interested if this technological advancement will serve in predicting health conditions, such as brain lesions and neurodegenerative diseases from a variety of medical data. However, despite all the features that this model has, it is not yet without limitations [1]. This means that research in deep neural network (DNN) expert system models is crucial for a better prediction of neuropathologies such as Alzheimer’s disease (AD). In fact, neurodegenerative processes in the brain, most often diagnosed when the stage of dementia, a clinical syndrome characterised by substantial progressive cognitive decline, have already an impact on daily life [2]. A purely biological method to detect AD is to control the accumulation of amyloid β, inducing the spread of tau pathology [2], however, this is an invasive technique and is most often performed when the neurobehavioral symptoms are already present. Instead, in Parkinson’s disease, there are no clear biomarkers since the reason for this dementia is the loss of dopaminergic neurons in substantia nigra pars compacta [3]. For this reason, early detection of brain degeneration from brain imaging is needed, and here, the DNN classificators can come into play.
The advancements to deploy machine learning (ML) in brain images classification have been made, but the results achieved are not yet completely satisfying. One of the reasons is that up to date there are no typical characteristic patterns (signatures) of structural and functional cerebral alterations, and in mild cognitive impairment (MCI), the disease might be misclassified with other types of brain pathology present in a cognitively normal (CN) subject [4]. Looking at the alteration of the brain with AD, one should focus on plaques, tangles, and cerebral atrophies. However, epidemiological autopsy studies of individuals with and without dementia showed that atrophy of brain tissues was the factor that most strongly correlated with dementia at all ages [5].
Nevertheless, rather successful attempts to deploy ML are present, such as support vector machine (SVM) for classifying AD and non-AD MRI [6]. Also, the K-nearest neighbour (KNN) system with feature extracting procedure has also achieved promising results > 88% [7]. Furthermore, the deep convolutional neural networks (DCNN) classifying images from healthy subjects, the ones with MCI and with AD achieved training accuracy > 92% for each class [8]. It is needed to mention that many researches often focus on a subset of binary classification problems such as CN vs. MCI, MCI vs. AD, or CN vs. AD [9, 10], which allows to achieve higher prediction accuracy, where multiclass predictions are more challenging. Moreover, success in brain image classification may come from the pre-processing procedure. That is, before applying ML algorithm, wavelet transforms, dimensionality reduction, shearlet transform, and other techniques [6, 10, 11]. However, feature definition often relies on manual procedures such as the outlining of brain structures, which can be prone to variability, and that has also a long image pre-processing procedure, as well as could be computationally consuming.
There is a decent amount of literature that has well studied AD Imaging Initiative (ADNI) database applying ML and DNN systems to detect AD [12]. The comparison of various ML methods, such as AdaBoost, Random Forest, KNN, and SVM was investigated in Khan & Zubair, 2022 [13], where the validation accuracy has been achieved by up to 93% using hybrid model learning. In the work reported by Jain et al. [14], 2019, a three-dimensional 16-layer visual geometry-group (3D-VGG-16) architecture for feature extraction for transfer learning was deployed. And other studies obtain higher than 96% of validation accuracy with DNN [15–17].
Here the two DNN models are proposed, 3D-VGG-16 and three-dimensional residual network (ResNet3D), showing that the multiclass classification from the three groups CN, MCI, and AD can achieve promising results with a minimal dedication to pre-processing of images step. We believe that the ResNet3D has superiority over 3D-VGG-16 model, which comes mainly from the ability to handle deeper structures avoiding vanishing gradient descent due to the residual connections [18, 19], moreover, the ResNet3D has been shown to outperform other networks in some three-dimensional (3D) medical image analysis tasks, such as tumour segmentation and classification, due to its ability to capture more complex features and representations [20]. Nevertheless, we still deployed the 3D-VGG-16 network for comparison. Our main goal was to verify the already existing results and to show the potential of residual networks (ResNets) model in brain image classification in comparison to a more traditional convolutional neural network (CNN). The reason stands primarily in the research of an automatic system that can analyse high-complexity images without increasing its computation time and complexity and has the potential to be interpreted.
Thanks to the ADNI, we could access the magnetic resonance imaging (MRI) dataset which is publicly available at the adni.loni.usc.edu. We downloaded one of their created collections: ADNI1—2 years, 1.5 T MRI scans, totally consisting of 2,042 images, which were collected from 2,042 subjects (1,205 males and 837 females) age ranging 55–92 years old. MRI images were classified into three groups: CN—567 images, MCI—1,206 images, and AD—269 images. We performed the analysis in five main steps: 1) Access the ADNI database and download MRI collection; 2) image pre-processing; 3) dataset division into training, validation, and testing sets; 4) deploying the artificial neural networks; 5) provide performance metrics. We provide a scheme of our work in Figure 1.
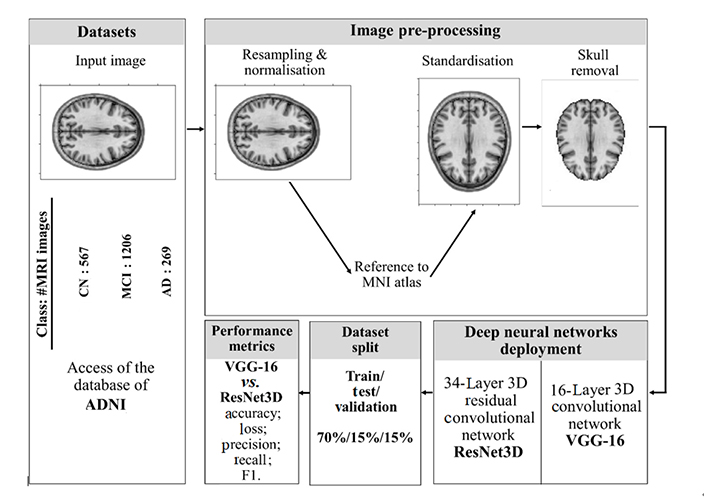
The overall diagram of the steps of the analysis provided in this work. Brain images represented in the figure are created with Python library Nilearn, which is specifically designed for manipulation as well as visualisation of neuroimaging data, thus, the reason for them here is only to depict the process. MNI: Montreal Neurological Institute
We do not apply any image transformation to be submitted to the network as in some previous works [7, 11]. However, we perform some necessary pre-processing steps such as normalization, resampling, standardisation, and skull-stripping to prepare the images for training. These steps are inevitable since the purpose is to ensure that the structure of all images is of the same shape so that the classification would not be biased by irrelevant to the disease features.
The reason why these pre-processing steps in MRI scan image analysis are important is that MRI scans are typically acquired with different spatial resolutions, voxel sizes, and orientations. Resampling involves transforming the image to a standard size, resolution, and orientation. This step helps to ensure that the features extracted from the image are consistent across different scans and can also reduce computational complexity. Where normalization helps to solve the problem of intensity variations due to differences in acquisition parameters, scanner hardware, and patient anatomy. Normalization involves scaling the intensity values to a common range to ensure that the network can learn meaningful patterns from the images.
This process allows us to identify the regions common to the original and normalized images that would represent the same anatomical structures. For a DNN to locate a certain image region as relevant is easier if they are adapted to one point of reference. We referred to the Montreal Neurological Institute (MNI), The McConnell Brain Imaging Centre atlas, as Evans et al. [21] tried to overcome the variabilities by using a single subject brain as a template and introduced the concept of a statistical MRI atlas for brain mapping. Since images we receive from the ADNI database have different formats and positions, at this stage we can adapt them according to a single template.
Since skull bone does not provide additional information to identify the neurodegenerative processes in the brain, its removal is useful for eliminating irrelevant information from images leaving only brain tissue. This step prevents the computational workload and saves the networks from additional confusion. After this step, the images were ready to be submitted to the DNN. We performed the skull-stripping step with functional MRI of the brain (FMRIB) Software Library brain extraction tool (FSL-BET) toolkit from Nipype in Python programming language.
In order to verify the performance of the network, these tests usually are performed with unseen model data. In this particular case, the dataset was divided into three sets: training set consisted of a total of 1,476 images, the validation set of 260 images, and the test set of 306 images. The split was implemented with a ratio of 70/15/15 (%) for train/test/validation sets respectively. The networks were trained on the training set, the validation set was used for the optimization of the network parameters after each training epoch. And the test set was used to evaluate the success of the model.
Both train/test/validation split and k-fold cross-validation are commonly used techniques for evaluating the performance of ML models. The choice between the two methods largely depends on the size of the dataset and the specific goals of the analysis. Many authors claim that k-fold cross-validation or leave-one-out validation is a plausible method to evaluate the model [22, 23]. However, there are some general advantages of train/test/validation over k-fold cross-validation. Few of them are that train/test/validation split is easier to interpret than the cross-validation and that the latter has higher computational complexity [24]. Another pitfall of cross-validation is its variability and that a repeated procedure might be needed [24, 25]. Moreover, train/validation/test is more often applied when there is a sufficiently high number of data [24]. We selected train/test/validation split method mostly relying on the reasoning that we had enough large datasets to train and validate the network.
In this work, a pipeline was implemented to classify MRI images deploying two DNN models, 3D-VGG-16 and ResNet3D. To implement the networks, Keras and Tensorflow libraries in Python 3.9 were used. To calculate the loss of the network, a cross-entropy function was deployed. In order to adjust the weights correctly while training the network, Adam optimizer function [26] was used for the ResNet3D model, and a root mean square (RMS) error as an optimizer function [27] for 3D-VGG-16, both networks were trained with a learning rate of 0.0001. The purpose of loss function and optimizer is to reduce the error in classification, so that the features of each group are associated and learned correctly. An early stopping [28] parameter was used based on validation accuracy and convergence speed while training both models for 20 epochs. Eventually, evaluation of specificity (precision), sensitivity (recall), F1 score and area under the receiver operating characteristic (ROC) curve (AUC), which is also an accuracy, was performed. AUC is calculated as the average of the micro F1 score for all the classes. It evaluates the ratio of how many correct predictions were made out of the total available in the class.
The architecture of Very DCNNs was proposed by Simonyan and Zisserman [29]. It is based on the CNN model; however, the novelty of 3D-VGG-16 lies in the evaluation of increasing the depth of the layers from 16 to 19 in the network and using very small (3 × 3 × 3) convolution filters.
For the MRI images of ADNI dataset classification, we implemented a stack of 16 convolutional layers followed by 13 convolutional layers and three fully-connected layers. Each layer contained the rectified linear unit (ReLU) non-linear activation function, except the final layer was the soft-max activation layer. The model was trained for 20 epochs. A schematic image of 3D-VGG-16 network is provided in Figure 2, and in Figure S1 we provide a summary of the model with the number of parameters indicated.
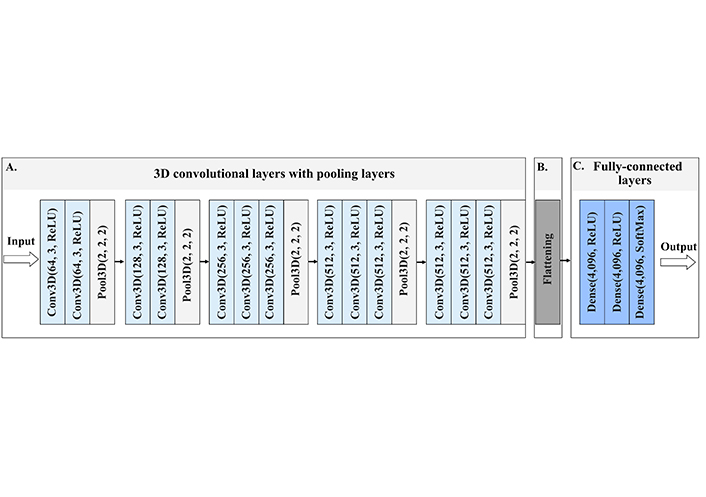
Architecture of 3D-VGG-16, a schematic visualisation of the 3D-VGG-16 neural network. (A) The input to the first Conv3D is of a fixed size, red-green-blue (RGB) format image. The image is passed through the stack of convolutional layers, where the first numbers inside the brackets indicate the number of filters, and the second number the size of the filter, in this case, 3 stands for 3 × 3 × 3 size filter passes through the image with one-pixel stride, this allows preserving the spatial resolution after the convolution. After convolution layers follow the spatial 3D pooling layer. Pooling is performed over the 2 × 2 × 2 pixel window, with stride 2. This layer preserves the shape and edges of the image; (B) flattening layer turns the 2D feature maps into a 1D feature vector, which is submitted to fully-connected layers; (C) three fully-connected layers follow the stack of convolutional layers of 4,096 channels each. All hidden layers are equipped with ReLU function, which allows for overcoming the problem of vanishing gradient descent, thus enhancing the learning process. The last layer contains the nonlinear softmax function, that gives the probability distribution of classes. The class with the highest probability will be selected as the predicted class. Conv3D: 3D convolutional layer
The ResNet3D is based on ResNets proposed by He et al. [30]. In general, ResNets are advantageous, because they introduce shortcut connections that bypass a signal from one layer to the next, which reduces to a minimum the issue of vanishing g gradient descent. We developed a ResNet3D network following the work of Hara et al. [31], where they used ResNet3D to identify human movements from videos. There is no temporal component in the structural MRI images, however, we used the spatiotemporal identification capability of ResNet to enhance the spatiospatial features [14].
We implemented a 34-layer ResNet3D model (Figure 3). The model consists of one initial convolutional layer, 16 residual units, and 3 fully connected layers. We train the model with 20 epochs and then extracted testing and training metrics. We also visualize the number of parameters of the model providing its’ summary in Figure S2.
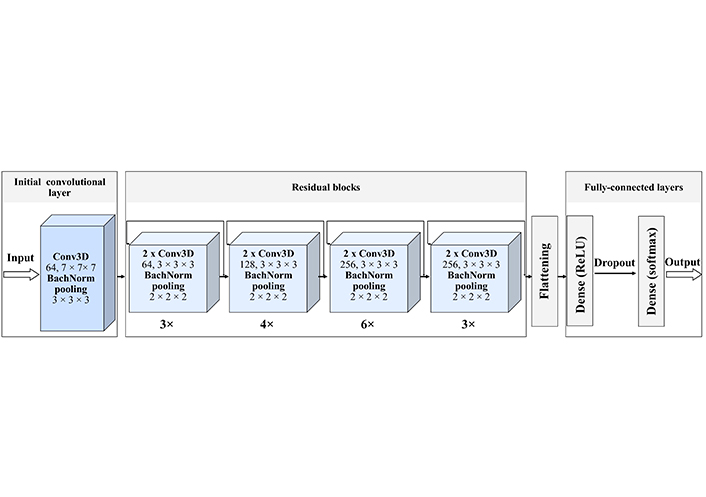
ResNet3D-34 architecture. The created network starts with the initial Conv3D, with 64 filters and a size of 7 × 7 × 7. Then 4 residual blocks follow. Each of these blocks has a certain number of residual units, indicated as a number below the block 1) 3 units with 64 filters; 2) 4 units with 128 filters; 3) 6 units with 256 filters; 4) 3 units with 512 filters, each filter of size 3 × 3 × 3, with the stride of 1 pixel, each unit contains two convolutional layers. Each convolutional layer is batch normalized, that is every time a feature map is created it is normalized and then submitted to the following block, this improves the learning efficiency. The last block is three fully connected dense layers with a dropout, that excludes inefficient connections. Each hidden layer is activated by the ReLU function and the for the classification we use the soft-max activation function
We analysed 2,042 MRI images from ADNI database. The images were divided into three groups: CN, MCI, and AD with 567, 1,206, and 267 images per group respectively. For the image pre-processing we only normalized and standardized the images to fit the uniform format and removed the skull as an unnecessary feature for the brain tissue analysis.
Deploying two models, the 3D-VGG-16 and ResNet3D, we found the latter to be more successful. Its success might lay in the spatiotemporal or, in the case of static image, spatiospatial analysis of the image [14] as well as the ability to avoid vanishing gradient descent. ResNet3D models, in general, have superior capabilities of learning specific spatial and temporal relationships, while reducing computational costs [30]. The aim of this work is to investigate and make a step in creating an expert system based on supervised learning to detect neurodegenerative processes from brain images not increasing the complexity of the model, and not reducing the probability to possibly interpret it.
The ResNet3D model performed better, with 85% validation accuracy, while the 3D-VGG-16 reached barely 61% (Table 1). Moreover, due to the set-up parameter of early stopping, the network stopped after 6 epochs due to lack of convergence, which might occur due to failure to minimize the error and being sensitive to inhomogeneous amount of data in each category. It is important to note that using the 3D-VGG-16 network, we also experienced several out-of-memory problems, which indicates the computational power consumption of the network and inefficacy of trainability. While the ResNet3D was trained faster, more efficiently, and with higher accuracy.
DNN models performance metrics
| Model | Training epochs/early stopping (yes/no) | Training time per epoch (s) | Training | Validation | ||
|---|---|---|---|---|---|---|
| Accuracy (%) | Loss | Accuracy (%) | Loss | |||
| 3D-VGG-16 | 20 (yes, after 6 epochs) | 409 | 57.43 | 96.23 | 61.92 | 91.01 |
| ResNet3D | 20 (no) | 74 | 98.37 | 6.62 | 85.38 | 7.06 |
Here we provide a short summary of the two models’ performance in classifying ADNI MRI brain slice images. It is seen that ResNet3D model has superiority over 3D-VGG-16 due to the higher training and validation accuracy. Furthermore, the time required for one epoch training in ResNet3D model is shorter. Due to the different optimizers used for both networks, the loss function units are different and thus, cannot be compared. However, for 3D-VGG-16 model loss is extremely high.
Since we are interested in creating a potential system that is able to analyse MRI brain images with high accuracy, we are concentrating on the more detailed investigation of the performance of the ResNet3D model giving the classification report. Not only the validation accuracy of the ResNet3D model was high (Figure 4), but also the precision, recall, F1 score, and support metrics for each group were promising (Table 2).
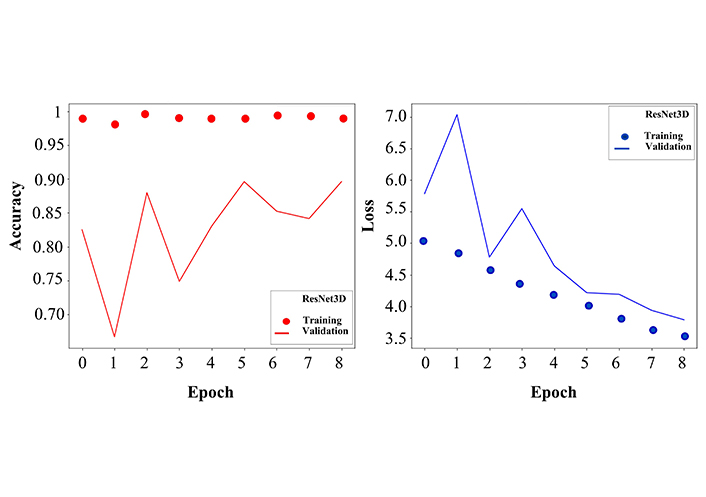
Accuracy and loss curves for training and validation sets. Left: the dotted curve describes the training accuracy, which fluctuates around 1, demonstrating the effective learning process. The solid curve stands for validation accuracy, where more fluctuations are observed, however in an early stage, after 8 epochs, it reaches 85% of classification accuracy. The values on the y-axis are given as the ratio and not in percentage. Right: similar to the left panel, here we show the loss function for training (dotted line) and validation (solid line). After 8 epochs the training and validation error decreases to a minimum. The network was trained for 20 epochs, but here the curves are represented only up to 8 epochs because the convergence of accuracy and loss functions saturated at the 8th epoch
ResNet3D model performance evaluation
| Class | Precision (%) | Recall (%) | F1 score (%) |
|---|---|---|---|
| CN | 85.93 | 79.71 | 82.70 |
| MCI | 88.55 | 91.30 | 89.90 |
| AD | 66.66 | 66.66 | 66.66 |
Metrics for each category classification are given. MCI class has the highest scores, this might have occurred due to the larger dataset
In this work, we provided a brief overview of the two DNN models, 3D-VGG-16 and ResNet3D, that in previous studies also showed success in analysing images from skin lesions to coronavirus disease of 2019 (COVID-19) infection-affected lungs [32, 33]. However, while most health pathologies have typical symptomatics and it is easier to automatically group them [34], it is not the case in neurodegenerative diseases, such as AD [35]. Nevertheless, analysing the ADNI images with semi-CNN ResNet3D we achieved a credible classification score, nearly 98% training, and higher than 85% validation accuracies.
The appearance of CNN provided a great prospective in supervised learning image classification. However, developing DNNs, after a certain number of layers the model diminishes its learning process, this is due to that during back-propagation process, the gradients decrease and vanish while propagating to the lower layers. This prevents weight learning and updating in the layers, which blocks the network from converging [36]. Where the 3D-VGG-16 networks have similar architecture to CNN, only that here, the number of hyperparameters is reduced, always using a 3 × 3 filter with a 1-step stride to convolve it with an image analysed. However, this is still a large network of 16 layers and also does not solve the encountered problems of vanishing gradient descent as well as smaller dimension features from learning process. Thus, one needs a better solution how to improve the learning process of the network, instead of increasing its volume, which often ends up as a clumsy, with thousands of parameters, and stagnant network without convergence in accuracy.
He et al. [30] proposed a different framework, which is based on a residual learning formulation of the shortcut connections where the output of a previous layer can be mapped to the connecting layer. The ResNet3D architecture typically consists of several residual blocks, each of which represents a sum of identity mapping and a stack of convolutions. The convolutional layers from the standard ResNet are replaced with 3D convolution blocks [37]. An advantage of residual learning is that it does not increase the complexity of the network, while optimizing its performance, unlike in visual geometry-group (VGG) networks, which is crucial when one has to analyse enough large amount of high-resolution brain images. Another benefit of 3D network models is that 3D convolutional kernels are invariant to the tissue discrimination in all dimensions, thus it can more easily learn fractal features of the cortex voxels [14]. Eventually, ResNets have the ability for embedding learning, where discrete features of the analysed image can be mapped to a lower dimensional space and meaningfully represent the same properties in a transformed way. These features further can be deployed with transfer learning by combining any ML classifier to advance the neurodegenerative process detection in the MRI image [18] and move towards an expert system for AD detection.
Despite achieving a promising result with ResNet3D model, we encountered some issues and uncertainties. One of them was the elimination of the skull from the MRI images. During the brain extraction procedure, the main problem was to find an appropriate parameter for the fractional intensity threshold. In practice, this parameter measures the aggressiveness of the algorithm in removing image components that do not represent brain tissue. A very small value would leave some irrelevant information in the image, while a very large value might remove some brain tissues. The main difficulty was that not all MRI data is obtained and preprocessed in the same way before being stored in the ADNI database, and instead, we apply the same filter to all datasets. Thus, it would not be possible to find an ideal fractional intensity threshold for the entire dataset. Nevertheless, before applying the filter for skull removal we performed several tests, and a threshold of 0.2 was used, as it was able to maintain a correct balance for most images. It is needed to mention that besides FSL-BET there are other methods, such as the high-definition brain extraction tool (HD-BET), based on artificial neural networks that provide a robust result in skull-stripping [38]. Nevertheless, HD-BET is a novel tool for brain extraction, we opted for a more traditional FMRIB Software Library (FSL) technique due to its versatility, that is, we could perform more functions with one toolkit.
It is also important to specify that training a 3D architecture is a much slower learning process and increases the need for more images. In general, the more complex the network and the more information it has to process, the more observations it has to learn from, therefore efficiency of the network might decrease.
Furthermore, the inhomogeneous amounts of data in different classes for training and for validation might strongly impact the DNN performance, it can be simply biased by the features learnt from the group with larger contents. Thus, tests could be done by varying the amount of data in different classes and tracking how the performance of the DNN changes.
We have illustrated in this project, in a practical way, how to use neural networks (3D-VGG-16 and ResNet3D) to support the diagnosis of AD. However, the achieved results are not yet cutting-edge and further developments are needed. In the paper, we have addressed some problems that we still encounter today in the construction of a DNN, especially in the field of medical diagnosis. The use of various open libraries, such as SimpleElastix, and open databases such as ADNI have allowed us to read, process, and contribute to the development of systems for neurodegenerative brain disease diagnosis. Nevertheless, a more generalized DNN infrastructure, with less computational and time complexity requirements as well as higher interpretability [39, 40] is needed. Therefore, following the first step, to have deployed the ResNet3D network on ADNI database, we further aim to improve this pipeline with transfer learning, by deriving the relevant maps from ResNet models. Such work has been implemented by Dyrba et al. [40] in 2021, where they tackle the CNNs interpretability problem with layer-wise relevance propagation (LRP) and deep Taylor decomposition to inspect the relevant feature in the MRI scan images feature maps. However, these maps do not hold the ground truth yet. Further developments are needed for a more precise prediction of the neurodegenerative processes in the brain from MRI images to move towards an expert system in clinical application for AD.
3D: three-dimensional
3D-VGG-16: three-dimensional 16-layer visual geometry-group
AD: Alzheimer’s disease
ADNI: Alzheimer’s Disease Imaging Initiative
CN: cognitively normal
CNN: convolutional neural network
DNN: deep neural network
MCI: mild cognitive impairment
ML: machine learning
MRI: magnetic resonance imaging
ReLU: rectified linear unit
ResNet3D: three-dimensional residual network
ResNets: residual networks
The supplementary material for this article is available at: https://www.explorationpub.com/uploads/Article/file/100443_sup_1.pdf.
We are grateful for those who made the magnetic resonance imaging datasets publicly available.
KA: Investigation, Methodology, Project administration, Resources, Supervision, Validation, Visualization, Writing—original draft. MLV: Conceptualization, Data curation, Formal analysis, Software. LL: Writing—review & editing.
The authors declare that they have no conflicts of interest.
Not applicable.
Not applicable.
Not applicable.
Data used in preparation of this article were obtained from the Alzheimer’s Disease Neuroimaging Initiative (ADNI) database (adni.loni.usc.edu). As such, the investigators within the ADNI contributed to the design and implementation of ADNI and/or provided data but did not participate in analysis or writing of this report. A complete listing of ADNI investigators can be found at: http://adni.loni.usc.edu/wp-content/uploads/how_to_apply/ADNI_Acknowledgement_List.pdf
Not applicable.
© The Author(s) 2023.
Copyright: © The Author(s) 2023. This is an Open Access article licensed under a Creative Commons Attribution 4.0 International License (https://creativecommons.org/licenses/by/4.0/), which permits unrestricted use, sharing, adaptation, distribution and reproduction in any medium or format, for any purpose, even commercially, as long as you give appropriate credit to the original author(s) and the source, provide a link to the Creative Commons license, and indicate if changes were made.

Rafael Franco, Joan Serrano-Marín
Jesús Avila ... Félix Hernández
Glòria Salort ... Jesús A. García-Sevilla
Milind Watve, Ashwini Keskar Sardeshmukh
Iyawnna Hazzard ... Forshing Lui
