Systematic Review

Affiliation:
1Facultad de Medicina, Universidad Autonoma de Yucatan, Merida, YUC 97000, Mexico
Email: omanzano@correo.uady.mx
ORCID: https://orcid.org/0000-0001-6286-7556
Affiliation:
1Facultad de Medicina, Universidad Autonoma de Yucatan, Merida, YUC 97000, Mexico
Affiliation:
2Sistema Bibliotecario, Universidad Autonoma de Yucatan, Merida, YUC 97000, Mexico
Affiliation:
3Physical Therapy Department, College of St. Scholastica, Duluth, MN 55811, USA
ORCID: https://orcid.org/0000-0002-6106-5794
Affiliation:
4Department of Neuroscience, Centro de Investigaciones Regionales “Dr. Hideyo Noguchi”, Universidad Autonoma de Yucatan, Merida, YUC 97000, Mexico
ORCID: https://orcid.org/0000-0003-1118-3220
Affiliation:
5Physical Therapy Department, Oregon State University-Cascades, Bend, OR 97702, USA
ORCID: https://orcid.org/0000-0003-3645-7312
Explor Neuroprot Ther. 2025;5:1004106 DOI: https://doi.org/10.37349/ent.2025.1004106
Received: March 11, 2025 Accepted: April 29, 2025 Published: May 22, 2025
Academic Editor: Aurel Popa-Wagner, University of Duisburg-Essen, Germany
Background: High-intensity training (HIT) increases walking speed for individuals with chronic stroke. Several recent studies have examined its application for those in the subacute phase following a stroke. This systematic review examines the application of HIT in the subacute phase following a stroke.
Methods: A systematic search for studies that compared HIT (defined as 60–84% heart rate reserve or 77–93% heart rate maximum) to lower-intensity training, conventional physical therapy, placebo, or no intervention in adults 0–6 months post stroke. Randomized or quasi-randomized controlled trials, cohort studies, and case-controlled studies published in peer-reviewed journals in English were included. The primary outcome of interest was walking speed; the secondary outcome was walking endurance. Two independent evaluators performed literature selection, data extraction, and assessed study quality using the revised Cochrane risk-of-bias tool. Reporting followed PRISMA guidelines.
Results: Of 1,642 studies initially retrieved, 10 studies with a total of 677 participants were included. All experimental groups showed an average positive change in self-selected walking speed (range: 0.20–0.56 m/s). HIT resulted in statistically significant improvements in walking speed versus comparison interventions in 4 studies. Eight studies that measured walking endurance found an average increase of 60 to 197 m following HIT.
Discussion: HIT demonstrated superior outcomes in self-selected walking speed and walking endurance for individuals in the subacute phase post stroke, both immediately following intervention and at follow-up. These findings align with the clinical practice guideline (CPG) for chronic stroke patients. Further randomized clinical trials are needed to strengthen the evidence.
Impairments caused by stroke are a severe public health problem with broad social and economic consequences worldwide [1]. Due largely to impaired motor control [2] at one-month poststroke, only 40% of people walk with minimal or no assistance [3]. Even 12 weeks after a stroke, 36% of survivors continue to experience dependence on an assistive device or another person for walking [4]. Therefore, practical and effective methods for recovery of walking stand to improve stroke survivors’ quality of life and have economic implications for communities and society.
For ambulatory people in the chronic phase poststroke, a clinical practice guideline (CPG) provides strong evidence that moderate to high-intensity training (HIT) achieved by increasing walking speed or the load of work to reach 60–80% of heart rate reserve (HRR) or 70–85% of heart rate maximum (HRmax), or virtual reality walking training at similar intensities, improves walking speed and walking endurance [5]. In addition to walking speed and distance, high-intensity walking training [6–13] and high-intensity cycle ergometry [14–16] improve other walking parameters in the chronic poststroke population.
Optimizing rehabilitation during the subacute phase, defined as 7 days–6 months [17] poststroke, is desirable due to the unique milieu of enhanced brain plasticity [17]. During this sensitive neuroplastic period, spontaneous and intervention-mediated functional recovery is accelerated [18]. Some suggest that current practice in neurorehabilitation does not adequately capitalize on this plastic period [18]. Leveraging early poststroke plasticity, a few researchers have studied high-intensity interventions in the acute and subacute phases poststroke. However, no systematic review has synthesized the outcomes of HIT methods in which walking was the primary intervention method for people in the subacute phase poststroke.
This review synthesizes evidence for HIT on the outcomes of walking speed and endurance for people during the subacute phase poststroke. Considering the relevance of critical periods for brain plasticity and their associated impact on neuromotor recovery, it is necessary to analyze the scope of this intervention in the early phase in those patients with control perform HIT. Randomized or quasi-randomized controlled trials or cohort studies that compared HIT to lower intensity training, conventional physical therapy, placebo, or no intervention in the subacute phase poststroke were included.
We used best practices for the completion of this systematic review [19], including providing a bias-reduced summary of its application to the rehabilitation of walking function for those in the subacute phase of stroke. Additional objectives were to ensure the safety of HIT for this population, advance knowledge translation of the method, and contribute to future practice guidelines and healthcare policy recommendations for this population.
A systematic search for studies that compared HIT to lower-intensity training, conventional physical therapy, placebo, or no intervention in adults 0–6 months post stroke was completed. This systematic review was registered a priori, in PROSPERO (ID: CRD42022315900) and was conducted following PRISMA guidelines [20]. The literature search was performed in Web of Science (WOS), Scopus, and PubMed Central databases between the dates of January 1st, 2010, to March 24th, 2022. Search terms included the following medical subject headings: 1) Population: stroke, acute stroke, subacute stroke, early stroke, very early stroke, cerebrovascular. 2) Intervention: locomotor training, locomotor gait training, HIT, high-intensity interval training (HIIT), high-intensity stepping training, treadmill training, walk training. 3) Comparison: conventional physical therapy, low-intensity or moderate-intensity training. 4) Outcome: gait speed, walking speed. Example code: (stroke OR acute stroke OR subacute stroke OR early stroke OR very early stroke OR cerebrovascular) AND (locomotor training OR locomotor gait training OR HIT OR HIIT OR high-intensity stepping training OR treadmill training OR walk training) AND (gait speed OR walking speed). EndNote software version 21 was used for bibliographic data management. This review relies on existing published research, no new data were generated or analyzed. Data supporting the findings are available in the reviewed articles and in some cases, the supplementary materials.
The following inclusion criteria guided study selection: 1) Randomized or quasi-randomized controlled trials, cohort studies, or case-controlled studies published in peer-reviewed journals in English between January 1st, 2010 to March 24th, 2022; 2) study participants were 0–6 months poststroke (acute and subacute phases) with reduced walking function; 3) high-intensity gait training (defined as 60–84% of the reserve HR or 77–93% of the maximum HR) [21] was compared with low-intensity training, conventional physical therapy, placebo or no intervention; 4) outcomes included gait speed in meters per second (m/s).
One author screened all titles and abstracts to identify studies that met the inclusion criteria and deleted duplicates. A second author verified this process using the same procedure. One author extracted data elements from the studies, and a second author verified the information. Extracted data included: study design, sample demographics, intervention type and description, self-selected and fastest-safe gait speed (m/s), and 6-minute walk test results, in meters, as a measure of walking endurance.
Two reviewers assessed the methodological quality of each study across all five domains of the revised Cochrane risk-of-bias tool (RoB2) [22]. Disagreements about the ratings were discussed until a consensus was reached for each rating.
The study selection process is shown in Figure 1. The initial search yielded 1,642 articles, 674 from PubMed, 69 from Scopus, and 899 from the Web of Science (WOS). After removing duplicates, screening records titles and abstracts, and reviewing reference lists, 117 were assessed for eligibility. After a full-text review, 107 studies failed to meet the inclusion criteria. Finally, ten studies were included for qualitative synthesis. Five studies were randomized-controlled trials, three were pilot studies, one was a retrospective cohort, and one was a quasi-experimental/historical cohort.
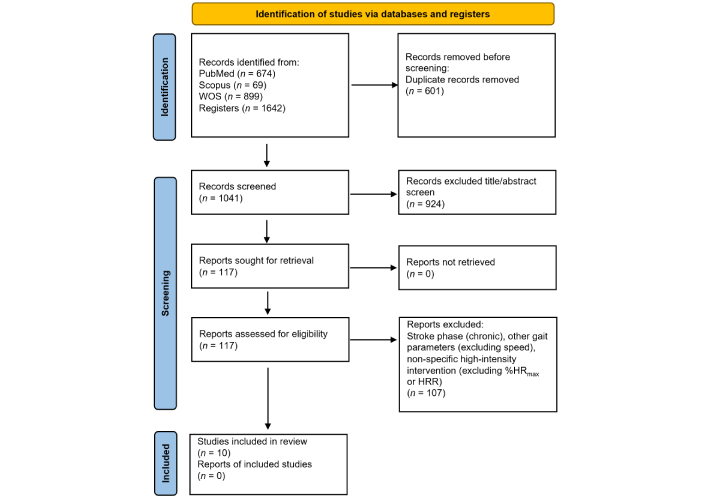
Study selection process for review. WOS: Web of Science; HR: heart rate; HRR: heart rate reserve
Studies included in this review were conducted in Australia (n = 1), the Netherlands (n = 1), Norway (n = 1), the United States (n = 5), and Canada (n = 2). Across the studies, there were 677 participants, 64% of whom were male. Most participants (508) were in an experimental group, they ranged from 12 to 257 participants. The average age of the participants was 60 and 61 years in the experimental and control groups, respectively. Across studies, the average age of participants ranged from 52 [23] to 74 years [24]. The mean number of days between stroke and study intervention was 53 ± 26 days. Notably, in two studies [24, 25], the mean number of days before intervention was much lower, 13 days for the experimental group. All the studies were conducted in outpatient settings. All participants had a walking impairment, and only a small number of participants could not walk without assistance. Table 1 summarizes participant characteristics.
Participants characteristics
| Study | Country | n | Group | Participants | Sex (male/female) | Age (SD)—years | Mean (SD)—days poststroke at start of intervention |
|---|---|---|---|---|---|---|---|
| Outermans et al. 2010 [26] | Netherlands | 43 | C | 21 | 17/4 | 56 (9) | 24 (8) |
| E | 22 | 19/3 | 57 (9) | 23 (8) | |||
| MacKay-Lyons et al. 2013 [27] | Canada | 50 | C | 26 | 14/12 | 59 (13) | 23 (4) |
| E | 24 | 15/9 | 62 (15) | 23 (6) | |||
| Holleran et al. 2014 [23] | USA | 12 | E | 12 | 8/4 | 52 (13) | 96 (54) * |
| Leddy et al. 2016 [30] | USA | 24 | C | 12 | 8/4 | 61 (10) | 89 (40) |
| E | 12 | 9/3 | 55 (12) | 108 (57) | |||
| Hornby et al. 2016 [28] | USA | 32 | C | 17 | 12/5 | 60 (9.2) | 89 (44) |
| E | 15 | 12/3 | 57 (12) | 114 (56) | |||
| Mahtani et al. 2017 [41] | USA | 36 | C | 13 | 9/4 | 61 (9.3) | 88 (41) |
| E | 23 | 16/7 | 54 (12) | 106 (57) | |||
| Moore et al. 2020 [24] | Norway | 110 | C | 56 | 29/27 | 74 (14) | 15 (11) |
| E | 54 | 35/19 | 73 (10) | 13 (10) | |||
| Henderson et al. 2022 [25] | USA | 257 | E | 257 | 158/99 | 62 (9.5) ** | 13 (9) ** |
| Klassen et al. 2020 [29] | Canada | 73 | C | 24 | 14/10 | 58 (13) | 26 (11) |
| E | 49 | 30/19 | 57 (11) | 28 (10) | |||
| Brauer et al. 2021 [40] | Australia | 40 | E | 40 | 27/13 | 68 (13) | 27 (24) |
| Total | 677 | C | 169 | 432/245 | mean = 60 (11) | mean = 53 (26) | |
| E | 508 | ||||||
C: control group; E: experimental group; SD: standard deviation; (*): converted from months; (**): converted from a range
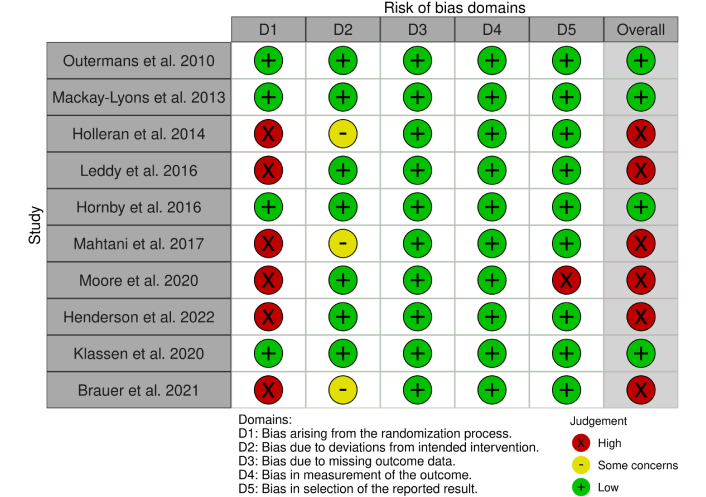
Four studies were classified as good quality and low risk [26–29]. Additional results of the risk-of-bias assessment are shown in Figure 2.
The most common adverse events reported were falls (between 6 and 8 falls were reported in 3 different studies) [23, 24, 30]. Cardiovascular function-related events were reported in 3 different studies [23, 28, 29]. Other minor adverse events that were reported included skin breakdown, seizures, and pain. The authors described adverse events to be unrelated to the intervention and found they occurred at similar rates in the control and experimental groups. Thus, HIT did not appear to increase the likelihood of adverse events when compared to conventional or lower-intensity therapies.
Across studies, the average HIT intervention duration was 6 weeks, the range was 4–12 weeks. The average number of sessions was 28, the range was 12–40. The average session duration was 45 minutes, the range was 30–60 minutes. In one study, one subgroup, determining optimal poststroke exercise 2 (DOSE2), trained for 120 minutes per session [29]. Some authors reported the number of steps per therapy session; these details and other characteristics of the interventions are found in Table 2.
Intervention characteristics, comparison condition, and outcomes reported
| Study | Intervention characteristics | Comparison | Outcomes | ||||
|---|---|---|---|---|---|---|---|
| HR/HRR | Times/week | Sessions | Time (minutes) | Program | |||
| Outermans et al. 2010 [26] | 70–80% HRR | 3 | 12 | 45 | 10 stations (2.5 min) | Low-intensity | 10MWT/6MWT |
| Mackay-Lyons et al. 2013 [27] | 60–75% HR | 3–5 | 48 | 60 | 12 weeks. Assisted by 1–2 therapists. 25–30 min on treadmill | Conventional therapy | 10MWT/6MWT |
| Holleran et al. 2014 [23] | 70% HRR | 5 | 36 | 60 | 10 weeks. Assisted by 1–5 therapists. Treadmill, overground, and upstairs training with different challenges on task walking. Steps per session: 2,887 ± 780 | None | Gait speed (GaitMat II)/6MWT |
| Leddy et al. 2016 [30] | 70–80% HRR (73% peak) | NR | 34–40 | 40–60 | 10 weeks. Treadmill, overground, and upstairs training with different challenges on task walking. Steps per session: 2,641 ± 727 | Conventional therapy | Gait speed (Walking plataform- Equitest, Inc., Chalfont, PA)/6MWT |
| Hornby et al. 2016 [28] | 70–80% HRR (74% peak) | 4–5 | 34 | 40–60 | 10 weeks. Treadmill, overground, and upstairs training with different challenges on task walking, assisted by 1–5 therapists. Steps per session: 2,358 ± 860 | Conventional therapy | Gait speed (GaitMat)/6MWT |
| Mahtani et al. 2017 [41] | 70–80% HRR | 4–5 | 40 | 40–60 | 4 weeks. Treadmill, overground, and upstairs training with different challenges on task walking, assisted by 1–5 therapists | Conventional therapy | Gait speed (Motion Analysis Corp., Santa Rosa, California) |
| Moore et al. 2020 [24] | HR 66% (79% HR peak) | NR | 21 | 45–60 | 3 weeks. Two subgroups, self-selected speed (SSS) and fastest speed (FS). Steps per session: 1,866 ± 653 | Conventional therapy | 10MWT/6MWT |
| Henderson et al. 2022 [25] | 70–85% HRmax | NR | 33 | NR | 30 days. Treadmill, overground, and upstairs training with different challenges on task walking. Steps per session: 2,641 ± 727 | None | 10MWT/6MWT |
| Klassen et al. 2020 [29] | 60% HRR | 5 | 20 | 60–120 | 4 weeks. Two subgroups: DOSE1, 60 minutes per session, and DOSE2; an additional 60 more minutes for training, weight-bearing exercises, straightening, and balance exercises. Steps per session: 2,169 ± 1106 | Conventional therapy | 5MWT/6MWT |
| Brauer et al. 2021 [40] | 40–60% HRR | 3 | 24 | 30 | 8 weeks. Treadmill training and self-management based on the health action process approach (HAPA), 5–10 minutes per session, 3× a week | None | 10MWT/6MWT |
HR: heart rate; HRR: heart rate reserve; HRmax: heart rate maximum; 10MWT: 10-meter walk test; 6MWT: six-minute walk test; NR: not reported; DOSE: determining optimal poststroke exercise; 5MWT: 5-meter walk test
Table 3 presents outcomes on the effect of HIT on gait speed from all 10 studies reviewed here. Seven studies had a comparison group, and 4 compared outcomes between HIT and the comparison group statistically. Six studies included outcomes from one or two follow-up timepoints between 2 and 12 months post-intervention. Also shown are the outcomes of HIT on fastest safe gait speed, which was reported by 3 of the 10 studies reviewed. The minimal clinically important difference (MCID) in self-selected gait speed for people with pathology, 0.10 to 0.20 m/s, is provided for reference [31].
The effect of HIT on walking speed and walking endurance
| Author (year) | Group | Condition | Gait speed | 6-minute walk test | ||||||
|---|---|---|---|---|---|---|---|---|---|---|
| Walking speed pre/post (m/s) | Mean difference (m/s) | P-value | Walking speed at follow-up (m/s) | Walking endurance pre/post (m) | Mean difference (m) | P-value | Walking endurance at follow-up (m) | |||
| Outermans et al. (2010) [26] | C | SS | 1.4 ± 0.5/1.4 ± 0.4 | 0 | 0.03 | None | 401 ± 132/422 ± 128 | 21 | 0.02 | No follow-up |
| E | SS | 1.5 ± 0.5/1.7 ± 0.5 | 0.2 | 459 ± 146/519 ± 165 | 60 | |||||
| MacKay-Lyons et al. (2013) [27] | C | SS | 0.56 ± 0.19/0.71 ± 0.20 | 0.15 | None | 6 months = 0.73 ± 0.2012 months = 0.74 ± 0.17 | 195 ± 78/232 ± 80 | 37 | None | 6 months = 239 ± 8912 months = 242 ± 81 |
| E | SS | 0.52 ± 0.21/0.75 ± 0.22 | 0.23 | 6 months = 0.76 ± 0.19 12months = 0.78 ± 0.22 | 189 ± 82/279 ± 89 | 90 | 6 months = 282 ± 9912 months = 287 ± 88 | |||
| Holleran et al. (2014) [23] | E | SS | 0.33 ± 0.27/0.66 ± 0.35 | 0.33 | N/A | 3 months = 0.65 ± 0.36 | 119 ± 94/263 ± 170 | 144 | N/A | 3 months = 260 ± 169 |
| FS | 0.47 ± 0.41/1.00 ± 0.67 | 0.53 | 3 months = 0.95 ± 0.62 | |||||||
| Leddy et al., (2016) [30] | C | SS | 0.47 ± 0.28/0.58 ± 0.25 | 0.11 | None | 2–3 months = 0.63 ± 0.29 | Not collected | |||
| E | SS | 0.35 ± 0.18/0.76 ± 0.36 | 0.39 | 2–3 months = 0.78 ± 0.38 | ||||||
| Hornby et al. (2016) [28] | C | SS | 0.35 ± 0.24/0.43 ± 0.27 | 0.08 | < 0.05 | 2 months = 0.47 ± 0.35 | 131 ± 108/160 ± 111 | 29 | < 0.05 | 2 months = 169 ± 121 |
| E | SS | 0.32 ± 0.25/0.59 ± 0.37 | 0.27 | 2 months = 0.65 ± 0.42 | 116 ± 88/232 ± 149 | 116 | 2 months = 227 ± 160 | |||
| C | FS | 0.46 ± 0.35/0.57 ± 0.43 | 0.11 | None | 2 months = 0.60 ± 0.43 | N/A | ||||
| E | FS | 0.48 ± 0.37/0.84 ± 0.60 | 0.36 | 2 months = 0.85 ± 062 | ||||||
| Mahtani et al. (2017) [41] | C | SS | 0.62 ± 0.31/0.75 ± 0.33 | 0.13 | < 0.01 | None | Not collected | |||
| E | SS | 0.54 ± 0.32/1.00 ± 0.47 | 0.56 | |||||||
| Moore et al. (2020) [24] | C | SS | 0.62 ± 0.34/0.79 ± 0.34 | 0.17 | < 0.001 | None | 243 ± 138/303 ± 130 | 60 | < 0.001 | No follow-up |
| E | SS | 0.64 ± 0.33/1.00 ± 0.40 | 0.36 | 243 ± 141/378 ± 156 | 135 | |||||
| C | FS | 0.85 ± 0.49/1.00 ± 0.49 | 0.15 | < 0.001 | None | N/A | ||||
| E | FS | 0.89 ± 0.49/1.37 ± 0.52 | 0.48 | |||||||
| Henderson et al. (2022) [25] | E-LoA > 5 | SS | 0.08 (0–0.23)/0.63 (0.38–0.95) | 0.55 | N/A | None | 16 (6–44)/213 (117–317) | 197 | N/A | No follow-up |
| Klassen et al. (2020) [29] | C | SS | 0.39 ± 0.22/0.74 ± 0.37 | 0.35 | None | 6 months = 1.0 ± 0.5012 months = 1.07 ± 0.60 | 129 ± 77.6/246 ± 138 | 137 | 0.02 | 6 months = 328 ± 14412 months = 351 ± 180 |
| E -DOSE1 | SS | 0.44 ± 0.25/0.90 ± 0.31 | 0.46 | 6 months = 1.02 ± 0.2412 months = 1.04 ± 0.23 | 129 ± 97.3/307 ± 118 | 178 | 6 months = 358 ± 12512 months = 401 ± 146 | |||
| C | SS | 0.39 ± 0.22/0.74 ± 0.37 | 0.35 | None | 6 months = 1.0 ± 0.5012 months = 1.07 ± 0.60 | 129 ± 77.6/246 ± 138 | 137 | 0.03 | 6 months = 328 ± 14412 months = 351 ± 180 | |
| E-DOSE2 | SS | 0.42 ± 0.25/0.97 ± 0.40 | 0.55 | 6 months = 1.02 ± 0.4412 months = 1.11 ± 0.43 | 138 ± 95.5/315 ± 142 | 177 | 6 months = 355 ± 14912 months = 375 ± 147 | |||
| Brauer et al. (2021) [40] | E | SS | 0.72 ± 0.29/0.99 ± 0.36 | 0.27 | N/A | 26 weeks = 1.01 ± 0.33 | 277 ± 142/368 ± 144 | 91 | N/A | 26 weeks = 402 ± 141 |
C: control group; SS: self-select speed; E: experimental group; None: not reported; N/A: does not apply; FS: fastest speed; LoA: level of assistance; DOSE: determining optimal poststroke exercise. Variability is noted as standard deviation or range
Table 3 also presents outcomes of the 6-minute walk test from the 8 studies in which it was reported. Of the 8 studies, 5 had a comparison group, and 4 compared outcomes between HIT and the comparison group statistically. Five studies included outcomes from one or two follow-up timepoints between 2 and 12 months post-intervention. The clinically significant threshold for change in walking endurance, 50 meters [32], is provided for reference.
Across ten studies, the effects of HIT on self-selected gait speed were consistently positive, with the mean difference after treatment ranging from 0.2 to 0.56 m/s. There were seven comparisons of HIT to a control condition; in each comparison, HIT resulted in superior self-selected walking speed. Six studies followed up with participants between 2 and 12 months. In 5 of the 6 studies, self-selected walking speed was maintained or had increased at follow-up. This is the first systematic review to synthesize the findings of HIT where the primary method was walking training for people in the subacute phase poststroke.
Study participants were, on average, 60 years old, and participated in the intervention a mean of 53 days after their event. The HIT intervention was typically about 28 sessions of 45 minutes in 6 weeks. Regarding safety, no studies concluded that HIT was unsafe for participants. Authors described adverse events as unrelated to the intervention and found they occurred at similar rates in the control and experimental groups. Thus, HIT did not appear to increase the likelihood of adverse events when compared to conventional or lower-intensity therapies. It is important to consider that selection bias and participant heterogeneity, if present in the studies reviewed, would contribute to an overestimation of the safety of the intervention.
The results of this review mirror evidence for the use of HIT in the chronic stroke population. A review published in 2019, HIIT produced significant improvements in gait speed and walking endurance compared to baseline, and the effect of HIIT was superior to moderate intensity exercise for improvements in gait speed, similar for walking endurance [33]. In a systematic review and meta-analysis, also published in 2019 [34], high-intensity exercise resulted in meaningful differences in walking endurance and comfortable gait speed. Because only 14% of the participants in this review were in the subacute phase, the conclusions may not generalize to this population. In 2020, a locomotor CPG presented strong evidence that moderate to high-intensity walking training or virtual reality walking training improves gait speed and walking endurance in the chronic phase poststroke. The locomotor CPG recommended further research with this method for the subacute population [5]. After the locomotor CPG was published, another study [35] also demonstrated a magnitude of improvement with HIIT of 0.15 m/s in gait speed in a chronic stroke population.
The fastest safe gait speed is a less common outcome in studies of HIT; only three of ten studies reported it. All three reported a positive mean difference in fastest safe gait speed immediately following HIT, the range was 0.36–0.53 m/s.
Initial improvements in motor control following stroke are thought to be due to spontaneous neural adaptation, a stimulating environment, and the opportunity for training [18]. Among the studies reviewed here, those that start their intervention during the first month (13, 23, 27 and 28 days) poststroke reported benefits in self-selected gait speed and walking endurance, however, they were no higher than those achieved in the studies in which they began their intervention after the third month; 106, 108 and 114 days poststroke. Regarding walking endurance, the studies with the greatest post-intervention difference: 197, 177–178, and 135 m, started treatment with a mean of 13, 28, and 13 days poststroke, respectively. This may be evidence of a synergistic effect of HIT with the early neural adaptation in walking distance outcomes [36–39]. The consistent short-term benefits of HIT support its early use in rehabilitation.
At follow time frames of 6 to 12 months walking endurance changes were minimal and not greater, on average, than the clinically significant threshold for change in walking endurance of 50 meters, the exception of Klassen et al. (2020) [29] who found an increase of 70–94 m at 12 months following the intervention. Additionally, some studies did not collect follow-up data, and some presented this information in a limited time between 2–12 months. Taken together, the evidence in this review is not sufficient to understand the effects of the intervention in the long term.
This review focused on walking outcomes, however, there is evidence that HIT results in improvements in non-locomotor outcomes as well. In one study, activities of daily living, as measured by the Barthel index, improved, although not statistically significantly, compared to conventional therapy [24]. Significant improvement in functional independence, especially among those who were able to walk without assistance at discharge from inpatient care, has been documented [25]. Quality of life (EQ-5D-5L index score) demonstrated significant improvements that were sustained in the medium term [29]. Improvements in activities and participation in the community [Impact on Participation and Autonomy Questionnaire (IPAC)] were observed, but no significant differences were found between experimental a control groups [40]. The non-locomotor outcomes of HIT could be the subject of a future review.
Some limitations of this review should be considered. There was considerable heterogeneity in the HIT interventions in the studies reviewed here. For example, the cardiovascular intensity targets ranged from 40% to 80% of HRR, or 60 to 85% HRmax. The dose of HIT also varied across study protocols. While typical sessions lasted 60 minutes, protocols ranged from 12–40 sessions across 3 to 10 weeks. Additionally, the selection of activities, such as overground or treadmill walking or stair climbing, among other modalities, was variable. Heterogeneity in HIT intensity, session duration, and frequency, as well as the time point it was administered during the subacute phase post stroke, should be standardized to improve study quality and future clinical translation. Only studies published in English were included, which may have introduced bias; this reduces the generalizability of findings by excluding relevant evidence. Six of ten studies were categorized as having a high risk of bias in one or more domains of the RoB2 tool. This suggests the need for improvement in study quality.
In summary, this systematic review provides encouraging evidence that HIT, particularly walking-based HIT, can significantly improve self-selected gait speed and walking endurance in individuals during the subacute phase poststroke. These improvements appear consistent across studies, with sustained benefits observed in the majority of follow-ups. While HIT did not increase the risk of adverse events, limitations such as study heterogeneity, potential selection bias, and high risk of bias in several studies highlight the need for more rigorous and standardized research. Although the evidence aligns with findings from chronic stroke populations and supports early implementation of HIT, the long-term effects and potential benefits on non-locomotor outcomes remain unclear. Future studies should aim to standardize HIT protocols and investigate its broader impact on recovery and quality of life to fully establish its value in subacute stroke rehabilitation.
CPG: clinical practice guideline
DOSE: determining optimal poststroke exercise
HIIT: high-intensity interval training
HIT: high-intensity training
HR: heart rate
HRmax: heart rate maximum
HRR: heart rate reserve
LoA: level of assistance
MCID: minimal clinically important difference
AOM: Conceptualization, Data Curation, Formal analysis, Methodology, Investigation, Visualization, Project administration, Writing—original draft, Writing—review & editing. AB: Data Curation, Formal analysis, Methodology, Validation, Writing—original draft, Writing—review & editing, Supervision. HS: Formal analysis, Methodology, Supervision, Writing—original draft. CC: Methodology, Validation. SIS and EAP: Data curation, Investigation. All authors read and approved the submitted version.
The authors declare that they have no conflicts of interest.
Not applicable.
Not applicable.
Not applicable.
The data that support the findings of this study are available from the corresponding author upon reasonable request.
Not applicable.
© The Author(s) 2025.
Open Exploration maintains a neutral stance on jurisdictional claims in published institutional affiliations and maps. All opinions expressed in this article are the personal views of the author(s) and do not represent the stance of the editorial team or the publisher.
Copyright: © The Author(s) 2025. This is an Open Access article licensed under a Creative Commons Attribution 4.0 International License (https://creativecommons.org/licenses/by/4.0/), which permits unrestricted use, sharing, adaptation, distribution and reproduction in any medium or format, for any purpose, even commercially, as long as you give appropriate credit to the original author(s) and the source, provide a link to the Creative Commons license, and indicate if changes were made.